

Translate this page into:
Land use changes in the Min River basin and their impact on carbon storage
⁎Corresponding author at: Fujian Chuanzheng Communications College, Fujian Province, Fuzhou 350007, China. jiangwenjia23@163.com (Wenjia Jiang),
-
Received: ,
Accepted: ,
This article was originally published by Elsevier and was migrated to Scientific Scholar after the change of Publisher.
Peer review under responsibility of King Saud University
Abstract
Background
The changes in land use patterns may provide immediate economic advantages, but they also lead to significant disruptions in ecosystem services. These modifications have the potential to adversely impact water supply, air quality, disaster response, carbon storage, and biodiversity. Therefore, these modifications affect the provision of ecosystem services and have a negative effect on human well-being. Hence, it is crucial to investigate how land use changes affect carbon storage to enhance ecosystem services, lessen the consequences of climate change, advance human welfare, and direct effective land management practices.
Methods
Min River Basin (MRB) is a significant water reservoir in China, providing valuable ecosystem services. Currently, the MRB is undergoing significant alterations in the land use due to country’s policy changes. Therefore, this study analyzed alterations in land use, dynamics of the alterations, and transfer matrix in MRB. The alterations in these indices were recorded for three time periods, i.e., 2000, 2010, and 2020. Furthermore, the influence of land use changes on carbon storage was investigated by InVEST (Integrated Valuation of Ecosystem Services and Tradeoffs) model.
Results
The main land use classes in the MRB consisted of forest land, grassland, and arable land, and most of the alterations were recorded among these three classes. The arable land was declined by 163–333 km2, while grassland reduced by 23–233 km2 from 2000 to 2020. Likewise, forest land witnessed a decrease of 34–167 km2 from 2000 to 2020. The dominant land use dynamics consisted of construction land and water areas, whereas the entire land use dynamics exhibit a consistent increasing trend. Moreover, carbon storage witnessed a significant decrease during the study period due to the reduction in forest land, grassland, and arable land.
Conclusion
The land use patterns in the MRB have witnessed substantial transformations because of recent policy implementations. Land use changes from forest land, arable land and grassland to other types exerted significant influence on carbon storage. Generally, carbon storage decreased from 2000 to 2020. The decline in carbon storage in the MRB is mostly attributed to urban growth, and construction activities. Therefore, these activities should be carefully monitored to improve carbon storage in the basin.
Keywords
Land use
Land Classification
Min River
Change analysis
GIS

1 Introduction
The interplay between land use, people, and nature is crucial in tackling global sustainability issues. Human activities have extensively modified the Earth’s land surface, resulting in notable changes to carbon sources, biodiversity, and food security (Winkler et al., 2021). Approximately 75 % of the Earth’s terrestrial area has undergone human-induced modifications in the last century (Luyssaert et al., 2014). Alterations in the land use are a vital quantitative measure for assessing ecological environmental impacts. The alterations in the land use around aquatic systems/rivers are very observable due to the high frequency of human activity (Ghute et al., 2023). Human activities such as agriculture, urbanization, and construction of dams may lead to changes in land use within river basins. These changes have the potential to impact water resources, water quality, sediment loads, and ecosystem services. Implementing sustainable land management methods is essential for mitigating these consequences and safeguarding the well-being of river basin ecosystems (Chakraborty, 2021). Reducing carbon emissions and increasing carbon sinks have become essential components of economic development in China since the country committed to the “dual carbon” goals. Land use is one of the most crucial aspects of interaction between humans and nature, and it represents a significant carbon reservoir. The transition between various land use types affects terrestrial carbon cycling, thereby impacting human well-being (Chang et al., 2022; Li et al., 2020, 2022).
China has enacted several key regulations regarding land use change during the 1990s to combat land degradation and facilitate urbanization, resulting in notable effects. The land use change policy of the country consisted of converting agriculture to forests and grasslands was introduced in 1999 (Wang et al., 2018). Although the implementation of policy helped to expand the extent of forest, concerns regarding its cost-effectiveness and ability to target the greatest environmental objectives still exist. Land use change policies in the country have sought to achieve a harmonious equilibrium between environmental conservation and economic development, transitioning from a top-down regulatory approach to market-driven strategies. Nevertheless, there are still obstacles to enhancing the effectiveness and precision of these regulations to attain sustainable land use (Liu et al., 2014).
The transition among different land use classes could offer immediate economic advantages. The direct economic advantages of land use change might include improved economic expansion, increased investments, employment generation, and prospective cash gains (Harewan et al., 2023; Zhang et al., 2023). Nevertheless, possible trade-offs and consequences for food security, environmental sustainability, and local people must be considered when engaging in land use changes for economic reasons. The changes in the land use trigger significant changes or imbalance in ecosystem services, leading to alterations or degradation in areas such as water resources, air quality, disaster prevention, and biodiversity. This process influences the development of ecosystem service functions, thereby impacting human well-being (Dosdogru et al., 2020; Liu et al., 2021). Land use changes may have complex trade-offs and implications for food security, environmental sustainability, and the local population (Shi et al., 2021; Zhao et al., 2023). This highlights the need of careful planning, using sustainable approaches, and involving appropriate stakeholders to minimize negative consequences and promote sustainability (Padilha et al., 2024; Van Schmidt et al., 2023).
The Min River, with a length of around 577 km, is the biggest river in Fujian Province that flows into the sea. The basin area of this region comprises about 50 % of the whole area of Fujian Province (Lu, 2004). It satisfies 40 % of the province's overall water demand for commercial purposes and ensures the safety of drinking water for ∼ 33 % of the inhabitants. The river is often referred to as the 'Mother River' by the inhabitants of Fujian. To effectively regulate and safeguard the Min River basin (MRB), it is crucial to uphold the principle that mountains, rivers, forests, farmlands, lakes, grasslands, and sands constitute a community of life. The practical application of this principle can be seen via many forms of land use. Consequently, analyzing the transition between various land use classes within the MRB has immense importance in enhancing the ecological environment quality and transforming the Min River into a secure, thriving, ecologically balanced, aesthetically pleasing, and harmonic river of satisfaction. However, there is still relatively limited research on alterations in the land use in MRB, especially for the three periods of 2000, 2010, and 2020. This study determined the changes in land use categories in the MRB and their impact on the carbon storage. The major objective was to infer the land use changes from 2000 to 2020 in MRB and determine their impacts on carbon storage. It was hypothesized that the land use changes exerted negative impact on caron storage from 2000 to 2020. The results would help to understand the carbon storage changes and underlying reasons.
2 Materials and methods
2.1 Study area
The Min River is located in Fujian Province and regarded as the longest river in the region. It stretches from longitude 116°23′ to 119°35′ and latitude 25°23′ to 28°16′. The basin has an approximate size of 6.1 × 10⁴ km2 (Fig. 1). The topography of the basin mostly consists of mountains and characterized by a subtropical monsoon climate. The topography exhibits a gradient from the northwest to the southeast. The basin encompasses four cities in Fujian Province, i.e., Nanping, Ningde, Sanming, and Fuzhou, constituting ∼ 50 % of Fujian’s total land area. It functions as a crucial ecological buffer zone for the Fujian province. The Jianxi River, Futun River, and Shaxi River are the three main tributaries that flow into the upper parts of the basin. The Gutian River, Anren River, and Youxi River are the three principal tributaries in the middle reaches. There is a lot of vegetation in the upper and middle portions of the basin, mostly in the form of evergreen coniferous and broad-leaved forests. The Dazhang River, Qibu River, and Taojiang River are the three principal tributaries in the downstream region. The urban region of Fuzhou City is mostly dominated by the lower reaches. It divides into the Wulong River and the Minjiang River on Nantai Island. Human activity has a significant influence on land usage in this region.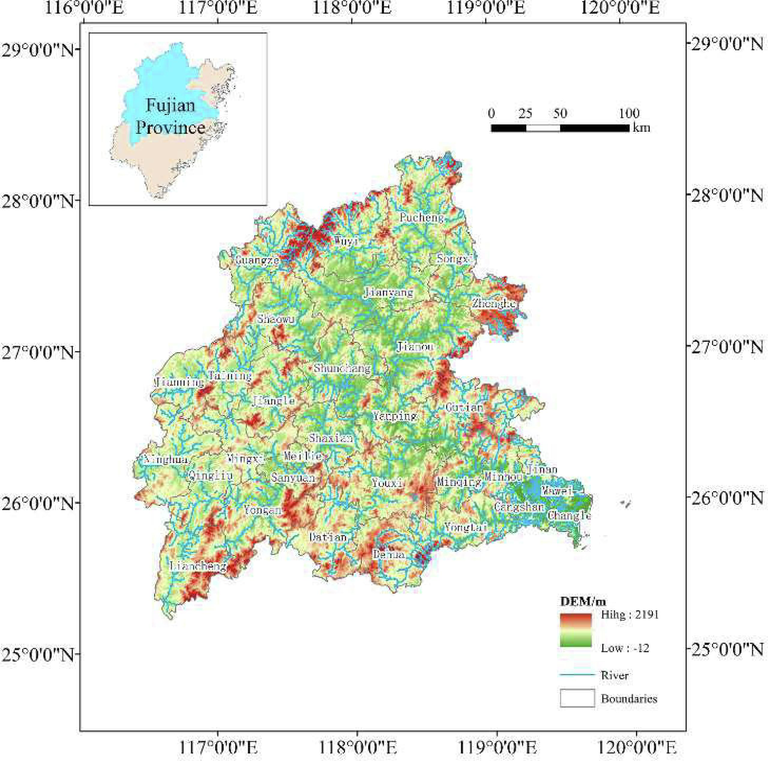
Topographic map of Min River basin.
2.2 Data collection
The data used in the current study to determine land use changes in the MRB were derived from Landsat TM/OLI remote sensing images for the years 2000, 2010, and 2020. These images had a spatial resolution of 30 m × 30 m. Remote sensing images gone through radiometric and atmospheric corrections, image mosaicking, and registration processes in the ArcGIS 10.7 software (ESRI (Environmental Systems Resource Institute), 2012) to obtain the basin extent. Additional supporting materials included basic geographic information data of the basin, administrative division data, and digital elevation model (DEM) data obtained from GlobeLand30 (https://www.globallandcover.com). The primary data collection sources were Chinese Academy of Sciences and the Wuhan University Data Center. The data processing is divided into two stages, i.e., data preprocessing and remote sensing image interpretation. The remote sensing interpretation was validated for accuracy, resulting in an overall classification accuracy of > 87 % for the three periods of remote sensing images. The Kappa coefficients were > 0.8, which meet the criteria for data processing and analysis. Land use classification data for the basin was acquired from the remote sensing images by human–computer interactive visual interpretation. Landscape types in the basin were classified into six distinct categories according to the criteria set by ‘Current Land Use Classification’. The classified categories were arable land (AL), forest land (including shrubs) (FL), grassland (GL), water areas (WA) (including wetlands), construction land (CL), and unused land (UL).
2.3 Data analysis
Land use dynamics can accurately quantify the speed of change in land use, which is necessary for studying variations in land use change and trends at regional level (Zhang et al., 2023). Single land use dynamics was determined according to equation (1).
In the equation, K = single land use dynamics, Ua = area of land use class under consideration at the initiation of investigation, Ub = area of land use class under consideration at the termination of investigation, and T=length of the study period.
The direction and speed of land use transfer among various land use classes can be investigated by land use transfer matrix (Mölders, 2013). The land use transfer matrix was determined according to equation (2).
In the equation, Bm × N=area of the mth land class at the initial period transformed into the nth land class at the terminal period, and k = number of land use types.
2.4 InVEST model and carbon storage
The InVEST is a comprehensive model used to asses ecosystem service functions. The model establishes relationships between ecosystem structure, functional changes, ecosystem service supply flows, and their values, enabling quantitative analysis and spatial representation of various ecosystem services (Moreira et al., 2018). The ‘carbon storage and sequestration – (CSS)’ module of the terrestrial ecosystem sub-model uses a land-use-based approach to estimate carbon storage. It is currently an effective method for calculating carbon stocks (Lipatov et al., 2021; Xie et al., 2015). This study utilized CSS module, which included total carbon stocks such as aboveground (Cabove), belowground (Cbelow), soil (Csoil), and dead organic matter/wood carbon (Cdead, which includes carbon from litter, fallen or standing dead trees). Total carbon was integrated with land use types to calculate carbon storage in the study area at pixel scale. The CSS module effectively reflects the spatiotemporal distribution patterns of terrestrial carbon sinks in a region. The total carbon present in different land use types was computed by using equation (3), whereas the carbon storage of entire land use classes under consideration was calculated by using equation (4).
In equation (3), I=categories of land use types, Ci-total = total carbon density (t hm−2) for land use type i, Ci-above, Ci-below, Ci-soil, and Ci-dead denote aboveground biomass carbon density, belowground biomass carbon density, soil carbon density, and deadwood carbon density (thm−2), respectively for the respective land use type.
In equation (4), Ctotal = total carbon stock of the terrestrial ecosystem, Si = total area of land use type i (hm−2), and m = number of land use types.
Carbon densities in Fujian Province have been validated for accuracy by Tao and Suhong (2024). The MRB occupies nearly half of Fujian Province and regarded as a significant component of the provincial territory. Therefore, carbon density values for Fujian Province (Table 1), can serve as the carbon density values for this study. C_above = aboveground biomass carbon density, C_below = belowground biomass carbon density, C_soil = soil carbon density, C_dead = deadwood carbon density.
Land use type
C_above
C_below
C_soil
C_dead
Arable land
21.34
11.69
96.47
2.40
Forest land
40.98
6.82
141.95
3.40
Grassland
19.65
19.46
126.60
2.90
Water area
0.00
0.00
91.50
0.00
Construction land
0.00
0.00
82.8
0.00
Unused land
27.44223
4.57
84.17
2.40
3 Results
3.1 Spatial distribution of land use
Spatial distribution of land use in MRB from 2000 to 2020 is illustrated in Fig. 1. The main land use categories in the basin were forest land (FL), grassland (GL), and arable land (AL) (Fig. 2). The area is mostly covered by FL, which is in line with the overall condition of Fujian Province, known for its abundant mountains and huge forest cover. The basin has scattered AL and GL. Although their total size seems decreasing, they constitute a significant component of the land in the basin. The water areas are scattered throughout the basin and consistently increased with time. The area designated for construction witnessed the highest increase (704.93 km2) compared to the rest of the land use classes. The increase in the construction area (CA) was near the estuary of MRB, with dispersed increases in other parts. A significant decline (23.63 km2) was noted in unused land (UL) over this time, particularly from 2000 to 2010. Nevertheless, the decrease in UL from 2010 to 2020 was less evident.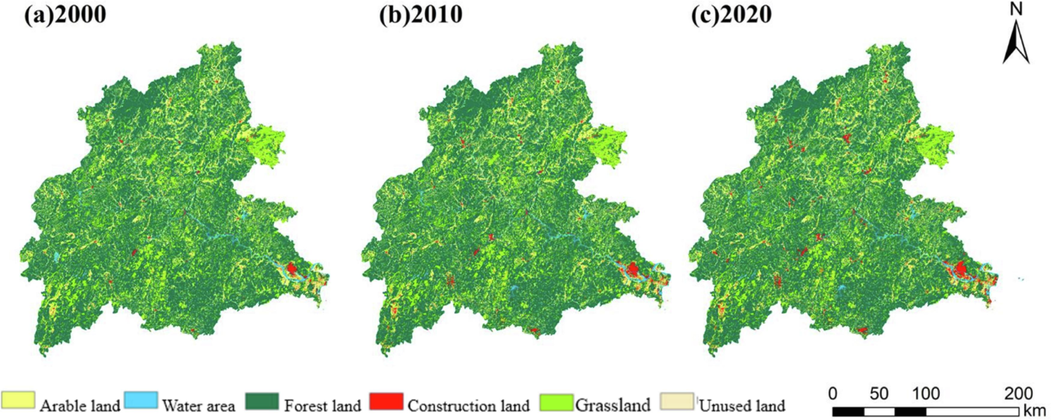
Spatial distribution of land use in Min River Basin during 2000 (a), 2010 (b), and 2020 (c).
3.2 Land use transfer matrix
The land use transfer matrices for 2000–2010, 2010–2020, and 2000–2020 were computed by using the land use statistics for the years 2000, 2010, and 2020 in MRB and are provided in Table 2. Similarly, the net inflow/outflow of different land use classes is given in Table 3. The AL recorded the most net outflow for the whole study period, with a total outflow area of 333.74 km2. The AL and was mainly converted to FL (724 km2) and CL (337 km2). The second highest change was observed for the GL. The net outflow of GL area was 233 km2, and majority of this change occurred between 2000 and 2010. Most of the GL was converted to FL (847.21 km2) followed by CL (109 km2). The FL also experienced a net outflow of 167.84 km2 during this period. The FL was mainly transferred to AL and GL, both totaling over 700 km2. The largest net growth in land area was recorded for CL, which increased by 704.93 km2. The FL and AL land observed the highest decline among different land use classes. Most of the FL has been transformed into GL and AL, with a total conversion areas of 1762.03 km2 and 262.92 km2 respectively. The transition from AL into FL and GL has resulted in the transformation of 273.13 km2 and 247.63 km2, respectively. The GL area has expanded mostly because of the conversion of FL and AL, with an influx of 1762.03 km2 and 247.63 km2, respectively. The most significant expansion was noted for CL, which increased from 74.69 km2 to 334.84 km2, mostly derived from AL. The subsequent notable growth was observed in WA, which increased from 26.41 km2 to 145.61 km2, mostly derived from AL and FL. AL=arable land, FL=forest land, GL=grassland, WA=water area, CL=construction land, and UL=unused land.
Land transfer
Area km2
2000–2010
2010–2020
2000 to 2020
AL − AL
9771.67
8945.71
8903.57
AL − FL
155.79
705.45
723.90
AL − GL
29.53
129.99
134.20
AL − WA
50.06
25.53
68.18
AL − CL
160.79
196.79
337.62
AL − UL
0.08
0.45
0.44
FL − AL
166.21
694.72
716.86
FL − FL
42198.17
41366.42
41046.68
FL − GL
306.75
573.48
748.95
FL − WA
24.75
25.40
47.44
FL − CL
153.30
152.88
287.55
FL − UL
0.72
2.08
2.42
GL − AL
52.96
139.82
168.16
GL − FL
421.89
557.51
847.21
GL − GL
9122.60
8716.09
8538.96
GL − WA
5.61
6.87
10.95
GL − CL
71.89
44.97
109.41
GL − UL
0.52
0.40
0.79
WA − AL
4.01
17.71
17.92
WA − FL
32.68
20.92
45.64
WA − GL
3.99
9.65
11.36
WA − WA
595.02
635.33
550.91
WA − CL
3.02
11.37
12.85
WA − UL
0.02
0.06
0.06
CL − AL
8.60
35.71
26.77
CL − FL
2.54
29.78
12.99
CL − GL
1.29
12.05
6.17
CL − WA
1.45
4.91
3.57
CL − CL
536.96
844.43
501.33
CL − UL
0.005
0.03
0.01
UL − AL
0.47
0.50
0.88
UL − FL
3.91
1.99
5.64
UL − GL
1.50
0.51
2.12
UL − WA
18.15
1.50
18.49
UL − CL
0.94
5.32
7.02
UL − UL
33.70
25.23
24.52
Land use types
2000–2010
2010–2020
2000–2020
Arable land
−163.99
−169.74
–333.74
Forest land
−34.92
−132.91
−167.84
Grassland
−209.82
–23.88
–233.70
Water areas
56.29
4.49
60.79
Construction land
376.06
328.86
704.92
Unused land
–23.62
−6.804
−30.429
3.3 Land use dynamics
The analysis of land use dynamics from 2000 to 2010 indicated a decline in AL, GL, and UL. The decreases in these classes were rather significant, particularly with UL exhibiting a dynamic rate of −4.03 %. The FL witnessed a minor variation with a small decline. The WA and CL increased during this period and CL observed a significant increase. The dynamic value for CL was 6.83 %. The land use changes recorded from 2010 to 2020 were not significantly different from those observed during 2000–2010. There was a little reduction in AL, GL, and FL, whereas the rate of change in UL was decreasing. The variable changes in WA also witnessed a decreasing trend, suggesting little fluctuation throughout this period. The CL exhibited an upward trend throughout this period, showing a rise in the amount of land available for development. However, the pace of growth was more effectively managed compared to the 2000–2010. A continuous decrease was observed in AL, FL, GL, and UL between 2000 and 2020. The change in FL was not significant, while AL and GL fluctuated by approximately −0.2 %. Although the dynamic values were comparatively small, the significant decrease in all three land use patterns had a substantial impact on the region because of their large area. The WA, CL, and UL saw notable fluctuations, with construction land seeing a substantial increase of 6.4 %. In contrast, UL decreased by 2.6 %, while water areas witnessed a little increase of 0.48 % (Table 4).
Land Use Types
2000–2010
2010–2020
2000–2020
Arable land
−0.0016
−0.0017
−0.0016
Forest land
−0.0001
−0.0003
−0.0002
Grassland
−0.0022
−0.0003
−0.0012
Water areas
0.0088
0.0006
0.0048
Construction land
0.0683
0.0356
0.0640
Unused land
−0.0403
−0.0194
−0.0259
3.4 Spatiotemporal variation in carbon storage
The highest carbon storage regions were concentrated in the southwestern mountainous and hilly areas of the MRB. These areas are covered by forests with high vegetation coverage. Medium carbon storage areas were mainly located in suburban areas of cities, as well as in mountainous/hilly regions and near water sources, land use types are cropland and grassland. Low carbon storage areas were distributed along both sides of the river and in urban areas, especially near the downstream estuary where extensive areas are classified as low carbon storage zones. Overall, decreasing trend was noted in carbon storage from 2000 to 2020. Carbon storage was 113.61 × 10⁷ tons during 2000, which slightly decreased to 113.31 × 10⁷ tons by 2010, representing a decrease of 0.3 × 10⁷ tons compared to 2000. Carbon storage further decreased to 113.05 × 10⁷ during 2020, reflecting a reduction of 0.26 × 10⁷ tons compared to 2010 and 0.56 × 10⁷ tons compared to 2000. The rate of decrease in carbon storage from 2010 to 2020 has slowed down compared to 2000 to 2010 (Fig. 3).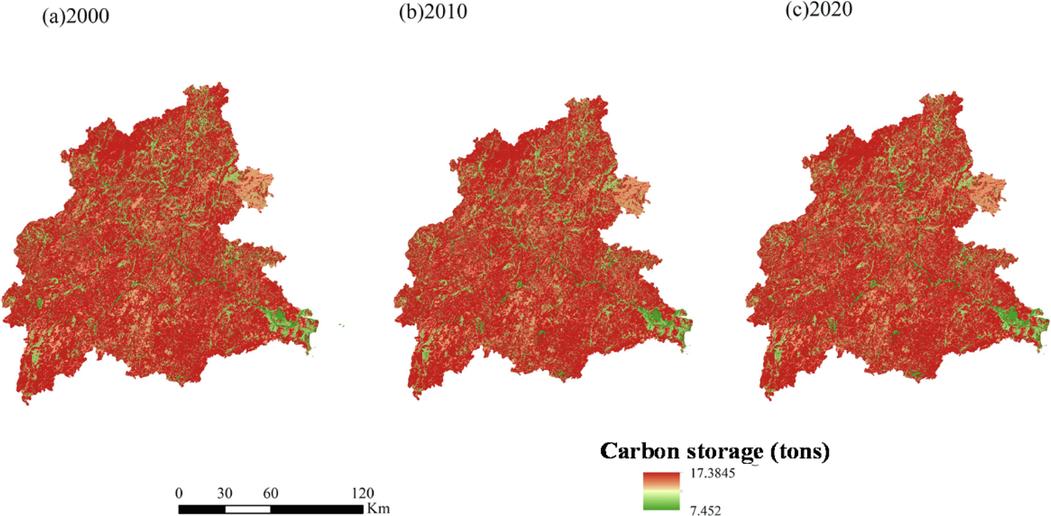
Carbon storage in Min River Basin during 2000 (a), 2010 (b), and 2020 (c).
3.5 Land use alterations and carbon storage
The land use changes proved highly correlated with the changes in carbon storage. The FL and GL decreased over time in two consecutive periods (i.e., 2000–2010 and 2010–2020), and decrease rate slowed down during the second period (2010–2020). This trend closely aligns with the changes observed in carbon storage, which overall decreased during the study period but showed a slower rate of decline in the second period. Spatially, the reduction in FL and GL overlaps to some extent with the decrease in carbon storage. The areas of reduction were primarily concentrated around urban centers, roads, and near rivers, especially noticeable at the downstream estuary of the Basin. Over the past two decades, this area has seen the most significant increase in urban development, coinciding with the most pronounced decrease in carbon storage.
4 Discussion
Significant changes were recorded in the land use within the MRB from 2000 to 2020. The most noteworthy shift was in CL, which had a substantial increase of 704.93 km2. The changes in AL, GL, and FL followed this trend. Overall, two land use classes witnessed an increase, whereas the rest of the four observed a decrease in total area during 2000 to 2020. The CL and WA were increased, whereas AL, FL, GL, and UL noted a decline during this period. Similarly, a substantial decline in AL, GL, and UL was noted between 2000 and 2010, whereas CL observed large increase. The decreasing trend of AL and GL was slowed down between 2010 and 2020; however, the decrease in unused land remained significant. Nevertheless, construction land witnessed is a large growth. The amount of AL, FL, GL, and UL in the MRB decreased between 2000 and 2020. However, the trend of decrease has been slowed down. This is associated with the government’s current efforts to protect the environment, which include advocating for programs like reforesting agricultural land and restoring meadows (Quan et al., 2023; Zhou et al., 2008; Zhu et al., 2016). There has been a notable expansion in both WA and CL. The conversion of AL and FL into WA is of particular significance, and it is directly linked with to the development of water conservation infrastructure, such as hydroelectric power plants in the basin, as well as the influence of agricultural water diversion and irrigation (Sun et al., 2023; Xiao et al., 2023; Zhen et al., 2023). A significant rise was noted in CL. A notable area (196.79 km2) of AL was transitioned to CL. Similarly, 152.8879 km2 FL was turned into CL. These findings indicate that a substantial amount of forest and agricultural lands were converted into urban development during the study period.
The variations in land use types in the MRB displayed notable regional and geographical variability in temporal and spatial change features. A significant portion of UL was developed, with a considerable portion being transformed into a WA between 2000 and 2010. This is closely linked to the extensive water infrastructure development that occurred during this period, including the construction of hydroelectric plants, which significantly increased the size of water bodies (Sun et al., 2023; Xiao et al., 2023; Zhen et al., 2023). Furthermore, a substantial reduction in FL was recorded during 2010 and 2020. Most of the FL was converted into AL during this period. Geographically, there was a substantial expansion of CL in the lower part of the river, particularly in the areas around Fuzhou between 2000 and 2020. This aligns with the economic progress of Fuzhou during the respective period (Lin and Liu, 2022; Wu et al., 2008). Overall, there was a notable increase in the amount of land used for construction in the flat regions on both sides of the river. This aligns with the approach of promoting economic growth in waterfront areas. The alterations in FL and AL are mostly focused on the central and upper sections of MRB. The alterations exhibit a notable but somewhat dispersed nature, displaying a clear irregular pattern marked by small-scale fragmentation and large-scale concentration, which generally aligns with regions of high population density.
The alterations in land use types were mostly derived by a combination of natural and socio-economic factors between 2000 and 2020. The variations in land use types throughout this period were little influenced by natural factors, and they displayed a consistent regional stability (Ming et al., 2022; Niu et al., 2022; Wu et al., 2023). There were minor changes in land use types in high-altitude areas and forest land remained the dominating land type. The changes in land use during this period were primarily driven by social and economic forces, particularly in response to fast regional economic expansion. Population increases, increasing urbanization, and the emergence of port economies had a substantial influence on alterations in land use. This is clearly seen by the significant growth in the amount of land allocated for building between 2000 and 2020.
Urban development, rural construction, and the cultivation of new farmland in the MRB have been the leading factors contributing to the overall decline in carbon storage across the region from 2000 to 2020. Carbon storage has shown a decreasing trend year by year in Fujian Province, dropping from 113.61 × 10⁷ tons to 113.05 × 10⁷ tons, a decrease of 0.56 × 10⁷ tons. Forests and grasslands are the primary carbon reservoirs in Fujian Province, with forests alone accounting for 85.0 % of the total area. The major reason for the decline in carbon storage in the basin is the extensive conversion of forests and farmland into urban development areas.
Spatially, the distribution of carbon storage in the basin exhibits distinctive characteristics. Over the past 20 years, the lower reaches of the Min River in Fuzhou have been both a region with low carbon storage thresholds and the area experiencing the greatest loss of carbon storage. In contrast, the middle and upper reaches of the river, mainly in cities like Sanming and Nanping, represent high carbon storage threshold areas, although changes in carbon storage in these regions have been relatively minor. In summary, the dominant factors contributing to the decline in carbon storage in Fujian Province from 2000 to 2020 have been urban development, rural construction, and the cultivation of new farmland.
5 Conclusions
The MRB experienced notable shifts in land use between 2000 and 2020. Although there was minor decrease, forest land was the dominant land use category in the basin. Arable land and grassland recorded a significant decrease, and the lost area was converted to construction land or forest land. Construction land had the greatest growth, mostly in the areas next to the estuary and metropolitan regions. An expansion was recorded in water areas, accompanied by a reduction in the amount of unused land, particularly from 2000 to 2010. The decrease in arable land and grassland significantly decreased carbon storage. Although carbon storage had a general decrease, the rate of loss decreased between 2010 and 2020, which aligns with the stability seen in land use changes. Therefore, it is recommended that the conversion of land to construction areas should be monitored carefully to further decline the loss of carbon storage in the basin.
CRediT authorship contribution statement
Wenjia Jiang: Writing – review & editing, Writing – original draft, Visualization, Validation, Supervision, Software, Resources, Project administration, Methodology, Investigation, Funding acquisition, Formal analysis, Data curation, Conceptualization. Gui Chen: Writing – review & editing, Visualization, Validation, Resources, Investigation, Formal analysis, Conceptualization. Ayesha Idrees: Writing – review & editing, Software, Formal analysis, Data curation, Conceptualization. Jingling Bao: Writing – review & editing, Visualization, Software, Methodology, Investigation, Data curation. Yuying Fu: Writing – review & editing, Visualization, Software, Investigation, Data curation, Conceptualization. Jingyan Chen: Writing – review & editing, Visualization, Investigation, Formal analysis, Data curation, Conceptualization. Zhimin Lin: Writing – review & editing, Visualization, Software, Methodology, Investigation, Formal analysis, Data curation, Conceptualization. Abdel-Rhman Z. Gaafar: Writing – review & editing, Visualization, Funding acquisition, Formal analysis, Conceptualization. Mohamed S Elshikh: Writing – review & editing, Validation, Methodology, Funding acquisition, Formal analysis, Conceptualization.
Acknowledgements
This study is funded by Program of Fujian Provincial Key Laboratory of Agroecological Processing and Safety Monitoring (Fujian Agriculture and Forestry University)) (Grant No. NYST-2021-04)” Fujian Chuanzheng Communications College Science and Education Development Fund Doctor Research Launch Special (No.20220109). Science and Education Development Fund Project of Fujian Chuanzheng Communications College (No. 20220204). The authors extend their appreciation to the Researchers supporting project number (RSPD2024R686), King Saud University, Riyadh, Saudi Arabia.
Declaration of competing interest
The authors declare that they have no known competing financial interests or personal relationships that could have appeared to influence the work reported in this paper.
References
- Chakraborty, S.K., 2021. Land-Use Changes: Floodplains, Dams, and Reservoirs – Integrated River Basins Management, in: Riverine Ecology Volume 2. Springer International Publishing, Cham, pp. 531–607. Doi: 10.1007/978-3-030-53941-2_6.
- Effects of land use and cover change (LUCC) on terrestrial carbon stocks in China between 2000 and 2018. Resour. Conserv. Recycl.. 2022;182
- [CrossRef] [Google Scholar]
- Potential impacts of land use/cover and climate changes on ecologically relevant flows. J. Hydrol. (Amst.). 2020;584:124654
- [CrossRef] [Google Scholar]
- ESRI (Environmental Systems Resource Institute), 2012. ArcMap 10.1. ESRI.
- Impact assessment of natural and anthropogenic activities using remote sensing and GIS techniques in the Upper Purna River basin, Maharashtra, India. Model. Earth Syst. Environ.. 2023;9:1507-1522.
- [CrossRef] [Google Scholar]
- Analysis of land conversion to economic growth: The case of other purpose areas. IOP Conf. Ser. Earth Environ. Sci.. 2023;1192:012052
- [CrossRef] [Google Scholar]
- Carbon dynamics in the northeastern qinghai-tibetan plateau from 1990 to 2030 using landsat land use/cover change data. Remote Sens. (Basel). 2020;12
- [CrossRef] [Google Scholar]
- Effects of land use and land cover change on soil organic carbon storage in the Hexi regions, Northwest China. J. Environ. Manage.. 2022;312
- [CrossRef] [Google Scholar]
- Evaluation of Fuzhou’s urban competitiveness based on the analysis of the economic zone on the west coast of the straits. Front. Bus. Econ. Manage.. 2022;6:8-13.
- [CrossRef] [Google Scholar]
- Spatial variation of organic carbon stocks in peat soils and gleyzems in the Northeast of Sakhalin Island. Eurasian Soil Sci.. 2021;54
- [CrossRef] [Google Scholar]
- Key issues of land use in China and implications for policy making. Land Use Policy. 2014;40
- [CrossRef] [Google Scholar]
- Land use and land cover change in the Yellow River Basin from 1980 to 2015 and its impact on the ecosystem services. Land (Basel). 2021;10:1080.
- [CrossRef] [Google Scholar]
- Fujian Geographical Atlas. Fuzhou, China: Fujian Atlas; 2004.
- Land management and land-cover change have impacts of similar magnitude on surface temperature. Nat. Clim. Chang.. 2014;4:389-393.
- [CrossRef] [Google Scholar]
- Spatial-temporal patterns of ecosystem services supply-demand and influencing factors: A case study of resource-based cities in the Yellow River Basin, China. Int. J. Environ. Res. Public Health. 2022;19:16100.
- [CrossRef] [Google Scholar]
- Land use and land cover changes impact on climate and air quality. J. Chem. Inf. Model. 2013
- [Google Scholar]
- Spatial assessment of habitat conservation status in a Macaronesian island based on the InVEST model: A case study of Pico Island (Azores, Portugal) Land Use Policy. 2018;78
- [CrossRef] [Google Scholar]
- Evolution and influencing factors of landscape pattern in the Yellow River Basin (Henan Section) due to land use changes. Water (Basel). 2022;14:3872.
- [CrossRef] [Google Scholar]
- Land cover implications on ecosystem service delivery: A multi-scenario study of trade-offs and synergies in River Basins. Environ. Manag.. 2024;73:753-768.
- [CrossRef] [Google Scholar]
- Patterns and drivers of carbon stock change in ecological restoration regions: A case study of upper Yangtze River Basin, China. J. Environ. Manage.. 2023;348:119376
- [CrossRef] [Google Scholar]
- Trade-offs and synergies of multiple ecosystem services for different land use scenarios in the Yili River Valley, China. Sustainability. 2021;13:1577.
- [CrossRef] [Google Scholar]
- Water transfer infrastructure buffers water scarcity risks to supply chains. Water Res.. 2023;229:119442
- [CrossRef] [Google Scholar]
- Evaluation of land use change and carbon storage in Fujian Province based on PLUS-InVEST model. J. Soil Water Conserv.. 2024;38:246-257.
- [CrossRef] [Google Scholar]
- Trade-offs in adapting to changes in climate, land use, and water availability in California. Ecol. Soc.. 2023;28:art9.
- [CrossRef] [Google Scholar]
- Land-use changes and land policies evolution in China’s urbanization processes. Land Use Policy. 2018;75
- [CrossRef] [Google Scholar]
- Global land use changes are four times greater than previously estimated. Nat. Commun.. 2021;12:2501.
- [CrossRef] [Google Scholar]
- Wu, D.W., Zhang, X.L., Mao, H.Y., Wu, H., 2008. Socio-economic driving forces of land-use change in Fuzhou, the southeastern coastal area of China, in: 2008 International Workshop on Earth Observation and Remote Sensing Applications. IEEE, pp. 1–11. Doi: 10.1109/EORSA.2008.4620335.
- Driving forces behind the spatiotemporal heterogeneity of land-use and land-cover change: A case study of the Weihe River Basin, China. J. Arid. Land. 2023;15:253-273.
- [CrossRef] [Google Scholar]
- China’s hydropower resources and development. Sustainability. 2023;15:3940.
- [CrossRef] [Google Scholar]
- Improvement of the evaluation method for ecosystem service value based on per unit area. J. Nat. Resour.. 2015;30
- [Google Scholar]
- Socio-economic impacts of agricultural land conversion: A meta-analysis. Land Use Policy. 2023;132:106831
- [CrossRef] [Google Scholar]
- Distinguishing the effects of land use policies on ecosystem services and their trade-offs based on multi-scenario simulations. Appl. Geogr.. 2023;151:102864
- [CrossRef] [Google Scholar]
- Ecological water, a new focus of China’s water management. Sci. Total Environ.. 2023;879:163001
- [CrossRef] [Google Scholar]
- Vegetation dynamics and forest landscape restoration in the Upper Min River Watershed, Sichuan, China. Restor. Ecol.. 2008;16:348-358.
- [CrossRef] [Google Scholar]
- Ecosystem restoration and conservation in the arid inland river basins of Northwest China: Problems and strategies. Ecol. Eng.. 2016;94:629-637.
- [CrossRef] [Google Scholar]


