

Translate this page into:
Kidney transcriptome analysis of rats (Rattus norvegicus) revealed induction of renal injury and damage markers in response to melamine
⁎Corresponding author. a.elshehawi@tu.edu.sa (Ahmed M. El-Shehawi)
-
Received: ,
Accepted: ,
This article was originally published by Elsevier and was migrated to Scientific Scholar after the change of Publisher.
Peer review under responsibility of King Saud University.
Abstract
Objectives
Melamine is a major environmental indigestible pollutant molecule that represents a pertinent risk to human health on a daily bases. The focus of the current study was the investigation of melamine effects on the rat (Ratus norvegicus) kidney transcriptome for detecting changes in gene expression during the early stages of the kidney damage.
Methods
Melamine was administered for 1 month to rats at 60 and 120 mg/kg/day to investigate its impact on the whole transcriptome of rat kidney. Transcriptome developed from mRNA of kidney cells was established using Illumina NovaSeq 6000 System with paired end sequencing of 100 bp with sequencing depth of 60 million reads and sequencing coverage of 6 Gb.
Results
Results indicated the upregulation of 379 and 718 genes in the M60 and the M120 groups consecutively and the downregualtion of 167 and 392 in the M60 and the M120 groups consecutively. Also, melamine administration significantly enriched 2329 GO (Gene Ontology) terms (1890 BP terms, CC 191 terms, 248 MF terms) and 198 KEGG (Kyoto Encyclopedia of Genes and Genomes) pathways. Differentially expressed genes (DEGs) were related to process involved in kidney functions as well as early stages of kidney injury and fibrosis. These included cell–cell adhesion, cell-matrix adhesion, cytoskeleton organization, response to stress, olfactory transduction and perception, and several interesting kidney function markers. The enriched GO terms and KEGG pathways were also related to the DEGs groups.
Conclusions
Results of the current study confirm that subchronic sublethal levels of melamine were able to initiate the early stages of kidney injury and fibrosis and introduce some early markers of kidney injury in the early diagnosis of kidney damage.
Keywords
Melamine
Rat
Kidney
Transcriptome
Differentially expressed genes
Kidney function markers

1 Introduction
Melamine is a nitrogen-containing compound, which is extensively used in various industrial applications including plastics, resins, filters, dishware, and adhesive materials (Cook et al., 2005; Xue et al., 2011). Melamine has low acute toxicity of 3 g/kg body weight when it is orally administered (Gossner et al., 2009). Subchronic studies on rat and mice evaluated its toxicity at 18 mg/kg feed (Heck and Tyl, 1985; NTP, 1983). Due to its high LD50 in animals, melamine is not considered as an acute toxic compound, yet its presence in foods represents a pertinent risk to human health. Its oral LD50 was reported as 3.2–7 g/kg body weight (Skinner et al., 2010; Dai et al., 2015). On the other hand, co-contamination of melamine and Cyanuric acid (structurally related to melamine) are more toxic and both are required for the formation of kidney stones and consequently kidney failure (Liu et al., 2014; Yin et al., 2016).
In September 2008, the Chinese milk deliberate adulteration crisis raised the international awareness to the melamine contamination and toxicity in food and feed products. This included the adulteration of infant milk formula and other food products with melamine. Aftermath, statistics indicated that 47 affected countries, an estimated 294,000 infant victims in China alone of which 51,900 were hospitalized, and 6 confirmed infant deaths from kidney damages (Gossner et al., 2009; Dai et al., 2015). A much high concern of melamine food contamination attracted the researcher’s attention after the China incident.
Melamine was detected in milk and dairy products in different countries. Its level ranged from 0.0001 mg/kg (milk powder in India) to 694 mg/kg (milk powder in Turkey) (Jalili, 2017). United States Food and Drug Administration (USFDA) and the European Food Safety Authority (EFSA) determined the Tolerance Daily Intake (TDI) of melamine at 0.63 and 0.5 mg/kg/day consecutively (WHO, https://www.who.int/foodsafety). The maximum allowed level of melamine was set by the Codex Alimentarius Commission of the United Nation Committee for Food Standers at 1 mg/kg and 2.5 mg/kg of infant powder formula and other food and feed consecutively (http://www.fao.org/fao-who-codexalimentarius/en).
Melamine showed reproductive toxicity in mice in the form of sperm deterioration, inhibition of testicular enzyme activity, and reduction in testosterone as well as luteinizing hormone (Khalil et al., 2017). These effects were associated with transcription suppression of steroidogenic related genes and lesions in testes, yet formaldehyde was able to ameliorate melamine reproductive impact (Khalil et al., 2017). In female mice, melamine induced oxidative stress during ovary and follicle development. It increased the level of reactive oxygen species (ROS) and apoptosis of granulosa cells. Its impact on the ovary is exerted through increasing the expression of superoxide dismutase and glutathione peroxidase (Dai et al., 2015). In addition, melamine caused reproductive toxicity in female mice (Momose-Sato et al., 2009) and caused disruption of oocyte maturation through deformation of cytoskeleton and epigenetic changes (Duan et al., 2015).
The impact of melamine alone or with cyanuric acid was tested on humoral immunity in mice. It caused significant decrease in CD138 expressing cells, decrease in blimp-1, sIgA, C3, IL-21, IL-4. In addition, it suppressed production of IL-6, IL-10, and gata-3 suggesting a humoral immunotoxicity of melamine and cyanuric acid in mice (Yin et al., 2016). Besides, melamine decreased the ratio of CD4+/CD8+ in spleen of mice treated with melamine and cyanuric acid simultaneously. This led to early apoptotic and significant increase of late apoptotic/necrotic rates. This was correlated with upregulation of Bax mRNA expression and downregulation of Bcl-2 mRNA expression in mice spleen indicating the melamine toxicity on mammalian immune system (Yin et al., 2014). More recently, melamine showed hematotoxic and immunotoxic effects in Swiss mice at 50 mg/kg dose. It induced elevation of serum immunoglobulin, MCV, PCV%, and reticulocyte levels. On the other hand, it decreased RBCs, Hb, MCHC, WBC, lymphocyte, total IgM level, and serum IgG levels. Melamine effect was exacerbated in the presence of 25 mg/kg formaldehyde (Abd-Elhakim et al., 2016). Moreover, melamine toxicity was associated with associated with several renal function including UACR (urinary albumin-to-creatinine ratio), B2M (β2-microglobulin), and N-acetyl-β-d-glucosaminidase (NAG (Chen et al., 2020; Guo et al., 2020).
The genotoxic effect of melamine and cyanuric acid estimated by Ames test and micronucleus test showed no detected genotoxcicity at the gene expression of Kim-1 gene or chromosomal aberration levels (Liu et al., 2014). Similarly, melamine genotoxicity was assayed using Pig-a mutation/micronucleus, bacterial reverse mutation, and cytokinesis-block micronucleus assay in Chinese hamster ovary (CHO) cells. These results indicated that melamine did not have direct genotoxic effect (Tu et al., 2015). On the contrary, melamine had impact on gene expression which precedes the detection of renal damage. It included the activation of mitogen-activated protein kinases, NFκB, and reactive oxygen species in human renal proximal tubular HK-2 cells. This in turn, increased the expression of interleukin-6, monocyte chemoattractant protein-1, vascular cell adhesion molecule-1, and TGF-β1. Upregulation of TGF-β1 increased fibronectin production and lowered the ratio of antiapoptotic (bcl-2, bcl-xl)/proapoptotic (bad, bax) proteins. It also promoted the activity of caspase-3 and caspase-9, and finally apoptosis of HK-2 cells (Hsieh et al., 2012).
Oral administration of melamine in rats at 700 mg/kg/day for 2 weeks resulted in red urine, lower body weight, and higher urea as well as creatinine in blood serum. Increasing melamine dose to 1400 mg/kg/day resulted in animal death. Upregulation of Kim-1, Clu, Spp1, A2m, Lcn2, Tcfrsf12a, Gpnmb, and CD44 genes was observed at 5 to 550-folds. On the other hand, expression of Tff3 was 5 fold downregulated. In monkeys, melamine caused turbid and whitish urine, crystals in urine, higher alanine aminotransferase concentration in serum, and higher kidney and/or liver weight (Early et al., 2013).
Previous studies on melamine toxicity focused mainly on renal toxicity and kidney dysfunction because the formation of kidney stones is the obvious toxicity sign (Hau et al., 2009; Neerman et al., 2004). Also, several studies reported the difficulty to observe the subchronic renal effects after exposure to high melamine concentration (Hsieh et al., 2012). However, the impact of melamine on the global gene expression during the early stages of kidney injury and the indirect impact on other pathways related to kidney function as well as the expression of novel kidney function markers have not been investigated. The current study focused on the investigation of the multidimensional effects of melamine on the whole transcriptome of the kidneys in rat (Ratus norvegicus) with focus on gene expression changes during the early stages preceding the kidney damage. This will elucidate the subchronic sublethal impact on kidney transcriptome and enhance our understanding of the melamine impact on different biological processes as well as uncover the most affected pathways related to kidney function.
2 Materials and methods
2.1 Animals and sampling
This study was conducted according to the guidelines of Taif University Committee of Animal Care and Use (Permit Number: 1440-61454). Twelve male rats (Rattus norvegicus) weighing 150 g (8 weeks old) were used in this study. They were randomly distributed into three groups. Control group (C, n = 4) was feed on a normal commercial diet. The second (M60, n = 4) and the third groups (M120, n = 4) were feed on the same diet supplemented with 60 mg melamine/kg and 120 mg melamine/kg (Sigma). These sublethal doses were chosen because there was a huge difference between melamine LD50 (3.2–7 mg/kg bw), TDI levels mandated by USFDS (0.63 mg/kg/day), EFSA (0.5 mg/kg/day), and the Codex Alimentarius Commission of the United Nation (CACUN) (2.5 mg/kg food). Therefore, we chose higher doses that correspond to 4–8 folds of the allowed limits set by the CACUN so that it can give a significant transcriptomic impact. Animals continued on this feeding program form 4 weeks. At the end of experiment, animals were decapitated and kidney samples were collected in Qiazol (Qiagen, Hilden, Germany). Taif University Committee for animal care and use has approved all procedures under the authorization number of 1-440-6145.
2.2 RNA isolation
Qiazo reagent was used to isolate the total RNA from kidney samples following the manufacturer's protocol (Qiagen, Hilden, Germany). Only RNA samples with RIN value above 7 were included in cDNA synthesis and library construction. TruSeq Stranded mRNA LT Sample Prep Kit was used to isolate mRNA and construction of cDNA libraries. Poly-T oligo linked to magnatic beads was utilized to isolate poly-A mRNA from total RNA samples. During the last stage of poly-A mRNA isolation, mRNA was cut into short fragments.
2.3 Construction of cDNA libraries
First strand of cDNA was synthesized via reverse transcription of short mRNA fragments and random primers. During synthesis of 1st strand of cDNA, actinomycin D was included for enhancing strand specificity by preventing DNA-dependent synthesis. Single A was added to the 3′ end of the generated cDNA molecules to minimize self-ligation and to facilitate the specific binding of adapters carrying 3′ T overhang. cDNA was amplified with PCR using a cocktail of adapter specific primers. AMPure XP beads were used in the purification of amplified cDNA. The quality of cDNA libraries was checked with DNA Agilent DNA-1000 chip on 2100 Bioanalyzer (Agilent Technologies, California, USA). Fragments in the size range of 200–400 bp (260 bp) were included in the paired-end sequencing. The final cDNA libraries were adjusted to 10 nM, and then pooled with equal volumes.
2.4 Sequencing and assembly
cDNA libraries were clustered and sequenced on the NovaSeq 6000 System NovaSeq 6000 platform programed for paired end sequencing of 100 bp with sequencing output of 60 million reads and sequencing coverage of 6 Gb (Illumina Inc, California, USA). After sequencing, low quality reads, primer DNA sequences, adaptor sequence, and duplicates of PCR were excluded using Trimmomatic program 0.38 (Bolger et al., 2014). Trimmed sequence data were combined in a FASTQ file by FastQC (http://www.bioinformatics.babraham.ac.uk/projects/fastqc). HISAT2 (Kim et al., 2019) was used to map trimmed sequence reads against the rat (Rattus norvegicus) reference genome UCSCrn4 with the help of Bowtie2 2.3.4.1 (https://ccb.jhu.edu/software/hisat2/index.shtml). The mapped sequence reads were assembled into genes (transcripts) by StringTie version 1.3.4d (Pertea et al., 2015; Pertea et al., 2016).
2.5 Transcriptome analysis
Expression level of assembled transcripts was estimated as read count and normalized FPKM value (Fragments PerKilobase of transcript per Million mapped reads). Gene Ontology (GO) enrichment for significant genes against gene ontology (http://geneontology.org) database was carried out using g:Profiler (https://biit.cs.ut.ee/gprofiler) (Raudvere et al., 2019). This summarizes the overrepresented genes in three main groups; biological processes (BP), molecular functions (MF), and cellular components (CC). Differential expressed genes (DEGs) analysis was performed on the Kyoto Encyclopedia of Genes and Genomes (KEGG) pathway homepage (http://www.kegg.jp/kegg/pathway.html). KEGG analysis was conducted to detect the difference in gene expression in a set of genes and build the heat map for their expression level. Gene expression data are expressed as fold change (FC) of obese/control (O/C) for single genes or group comparisons.
2.6 Statistical analysis
Statistical analysis was performed using Fold Change (FC) or exact Test edge R per comparison pair with |FC|>=2. DEGs were detected based on the Benjamini-Hochberg-adjusted p-value which is more restricted to reduce false positive DEGs. GO and KEGG significance was based on conditions of |FC|>=2 and FDR-adjusted p-value < 0.05.
3 Results
3.1 Statistics of data
The total number of read bases ranged from 7.25 (C) to 7.45 (M60) Gbp in raw data compared to 7.17 (C) to 7.37 (M60) Gbp in the trimmed data (Supplementary Table 1). The total reads ranged from 71.77 (C) to 73.74 × 10⁶ (M60) and 71.20 (C) to 73.25 × 10⁶ (M60) in the raw and trimmed data consecutively (Supplementary Table 1). GC% was almost homogenous across samples in both raw and timed data. Q20 and Q30 in the trimmed data is a little higher because the low quality data was excluded during the filtration (Supplementary Table 1). This confirms the homogeneity of raw and trimmed data across samples and there were not any outliers.
3.2 Data quality
Multidimensional data analysis was carried out using normalized gene expression values to present similarity/variation among samples in 2D graphic demonstration depending on the main components of variations among groups. Component 1 of variation caused 68.4% and component 2 caused 31.6% of variations in gene expression among the C, M60, and M120 groups. These two main sources of variations separated the three groups on the 2D plot indicating a significant variation among C and the treated groups M60 and M120 (Supplementary Fig. 1).
Distribution of genes based on their zero counts is another measure of data set quality. Among 17,302 DEGs there were 12,877 genes with no zero counts, 517 genes with 1 zero count, 636 genes with 2 zero counts, and 3272 genes with 3 zero counts. Total of 4425 genes with at least 1 zero count were excluded and the 12,877 genes with no zero counts were used in the analysis (Supplementary Fig. 1).
3.3 Distribution of expression level
The expression level of DEGs was estimated to check the expression level in the M60 and M120 compared to the control group. The expression level distribution in melamine treated samples was associated with the similar expression levels in control group. Gene number in expression showed increased levels and peaked at 4–5 and 5–6, and then it dramatically dropped at 8–9 level with minimum levels at 14–15 level. Generally, gene frequency of higher gene expression levels included low number of genes (Fig. 1a). Similar distribution of expression level was obtained in the M120 compared to the control group (Fig. 1b).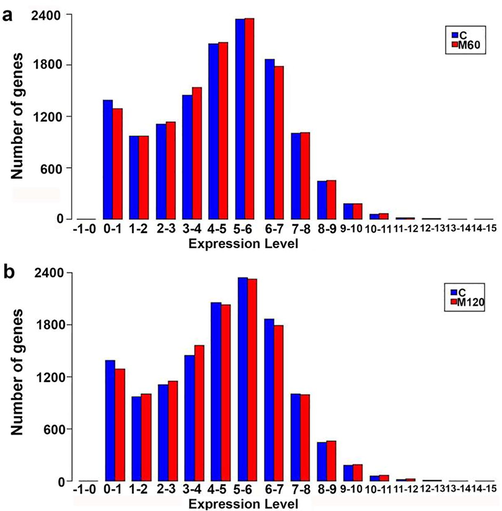
Distribution of gene expression level in melamine treated groups compared to the control group. a: M60 vs C, b: M120 vs C.
3.4 Defferentially expressed genes (DEGs)
Using fold change, 526 and 880 genes were upregulated in M60 and M120 groups compared to the control group consecutively, whereas 265 and 518 genes were down regulated in both groups compared to the control group consecutively. This made up the DEGs to 791 and 1398 DEGs in M60 and M120 respectively (Fig. 2a). Using fold change and p < 0.05 level of significance, 422 and 801 genes were upregulated in M60 and M120 groups compared to the control group respectively, while 187 and 428 genes were downregulated in both groups consecutively (Fig. 2b). As total, 609 and 1229 genes were significantly differentially expressed in M60 and M120 groups compared to the control group (Fig. 2b). Using the more restricted Benjamini-Hochberg (bh)-adjusted p-value method to detect the DEGs, the total number of DEGs was reduced to 546 in M60 (379 upregulated, 167 downregulated) and 1110 in M120 (718 upregulated, 392 downregulated). The detected set of DE genes based on bh-adjusted p-value was used in the further analysis.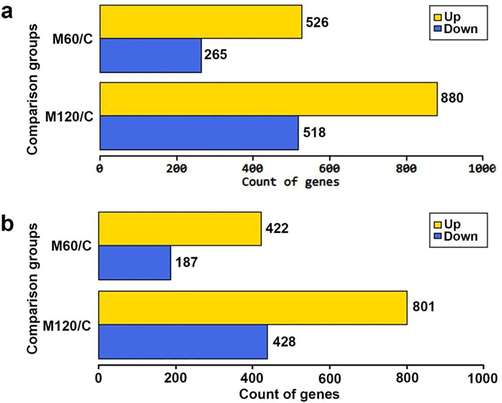
Representation of up- and down-regulated gene count in M60/C and M120/C using |FC|>=2 (a) and |FC|>=2 and p < 0.05 (b).
Smear plot is a two dimensional distribution of DEGs and their expression level of the relationship between log2 |FC|>=2 against the average log count per million (CPM). In the M60 group, using the FC, the 526 upregulated genes are represented above the FC>=2 threshold limit and the 265 downregulated genes are below the FC<=-2 limit (Fig. 3a, light blue dots), whereas using the FC and p < 0.05, the 422 upregulated genes are distributed above the FC>=2 limit and the 187 downregulated genes are distributed below the FC<=-2 limit (Fig. 3a, dark blue dots). In the M120 group, using the FC, the 880 upregulated genes are represented above the FC>=2 threshold limit and the 518 downregulated genes are below the FC<=-2 limit (Fig. 3b, light blue dots), whereas using the FC and p < 0.05, the 801 upregulated genes are distributed above the FC>=2 limit and the 428 downregulated genes are distributed below the FC<=-2 limit (Fig. 3b, dark blue dots). The distribution of DEGs in M60 and M120 group represent a similar pattern of DEGs distribution in the range of log2|FC|=2–5 and average log CPM -5 to 10. Also, it is observed that number of DEGs is decreased with the increase of average log CPM (Fig. 3a,b).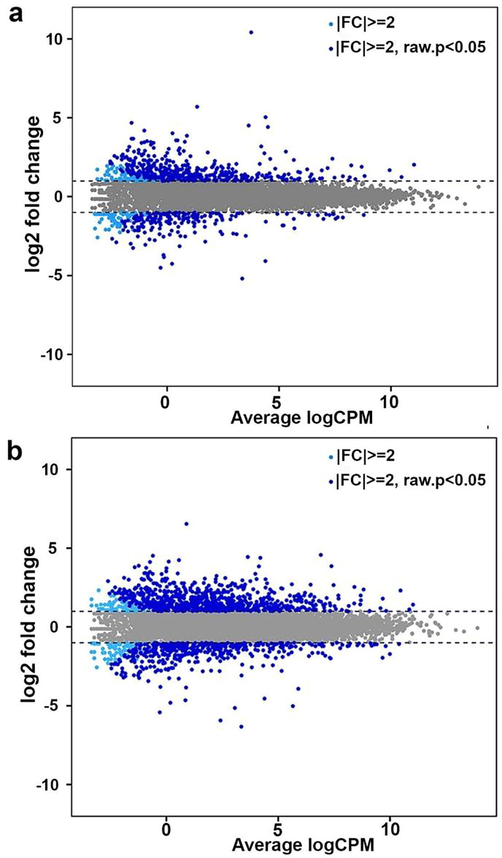
Smear plot of DEGs in M60 (a) and M120 (b) compared to the control group with log2 FC (light blue) or log2 FC and p < 0.05 (dark blue). Y-axis: log2 fold change of gene expression; X-axis: average of lof CPM (counts per million reads mapped).
3.5 GO analysis
Significantly DEGs were used for gene ontology search. A total number of 2329 (FDR-adjusted p value < 0.05) GO terms was enriched. The enriched terms were distributed among the three GO categories as 1890 terms for biological processes (BP), 191 terms for cellular components (CC), and 248 terms for molecular functions (MF).
The top 10 BPs (Fig. 4a) included cellular process, single organism process, single-organism cellular process, and biological regulation which were the most predominant terms with 1122,1114, 1012, 928 detected DEGs consecutively (Fig. 4a). Besides, localization (512DEGs), response to chemical (403 DEGs), response to stress (360 DEGs), organ development (359 DEGs) response to external stimulus (291 DEGs), defense response (201 DEGs), cellular response to chemical stimulus (282 DEGs), regulation of localization (266 DEGs), regulation of gene expression (254 DEGs), inflammatory response (103 DEGs) BP terms were highly enriched in response to melamine treatment. Also, BP terms related to biological adhesion were enriched including biological adhesion (169 DEGs), cell adhesion (167 DEGs), cell–cell adhesion (124 DEGs), single organism cell adhesion (108 DEGs), single organismal cell–cell adhesion (105 DEGs), homotypic cell–cell adhesion (83 DEGs), regulation of cell adhesion (82 DEGs), regulation of cell–cell adhesion (62 DEGs), positive regulation of cell adhesion (55 DEGs), positive regulation of cell–cell adhesion (40 DEGs), cell-matrix adhesion (3 DEGs), cell adhesion mediated by integrin (8 DEGs), and regulation of cell adhesion mediated by integrin (6 DEGs). In addition, melamine led to the enrichment of cell death and stress related BP terms including regulation of cell death (156 DEGs), cellular response to stress (127 DEGs), positive regulation of apoptotic process (55 DEGs), apoptotic signaling pathway (48 DEGs), and epithelial cell apoptotic process (9 DEGs). Moreover, BP related to secretion and transport were enriched, such as secretion (147 DEGs), transport (440 DEGs), single-organism transport (353 DEGs), regulation of transport (209U), organic substance transport (200 DEGs), ion transport (170 DEGs), cation transport (130 DEGs), transmembrane transport (123 DEGs), ion transmembrane transport (100 DEGs), regulation of ion transport (83 DEGs), nitrogen compound transport (79 DEGs), negative regulation of transport (52 DEGs), negative regulation of transmembrane transport (10 DEGs) regulation of sodium ion transmembrane transport (8 DEGs), and water transport (5 DEGs). Furthermore, different cytoskeleton organization BP terms were enriched in response to melamine treatment. These terms included cytoskeleton organization (95 DEGs), microtubule cytoskeleton organization (46 DEGs), actin cytoskeleton organization (46 DEGs), regulation of cytoskeleton organization (37 DEGs), and negative regulation of cytoskeleton organization (14 DEGs). Interestingly, melamine treatment caused the enrichment of kidney development and morphogenesis related BP terms including kidney development (37 DEGs), kidney epithelium development (18 DEGs), regulation of kidney development (10 DEGs), kidney morphogenesis (10 DEGs), positive regulation of kidney development (9 DEGs).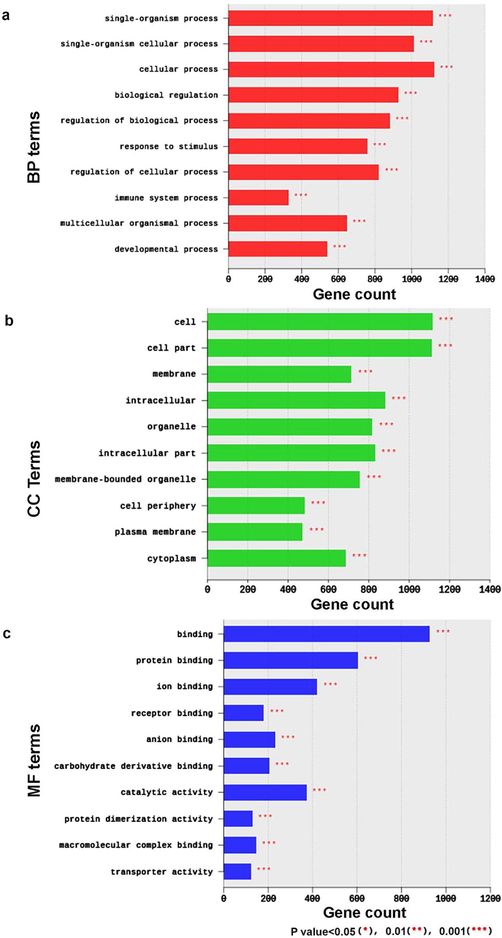
Top 10 terms of Biological Processes (BP) terms (a), Cell Components (CC) (b), Molecular Functions (MF) (c) of the GO functional analysis for combined M60 and M120 dataset.
The top 10 CC terms included cell, cell part, intracellular, intracellular part with 1116, 1112, 881, 832 detected DEGs consecutively (Fig. 5b). Other CC terms related to cell adhesion including cell projection (176 DEGs), cell junction (99 DEGs), cell–cell junction (41 DEGs), protein complex involved in cell adhesion (7 DEGs), gap junction (5 DEGs), neuromuscular junction (9 DEGs), integrin complex (7 DEGs) were enriched. Also, CC terms related to cytoskeleton structure (123DEGs), cytoskeletal part (105 DEGs), microtubule cytoskeleton (71 DEGs), actin cytoskeleton (31 DEGs) were significantly enriched.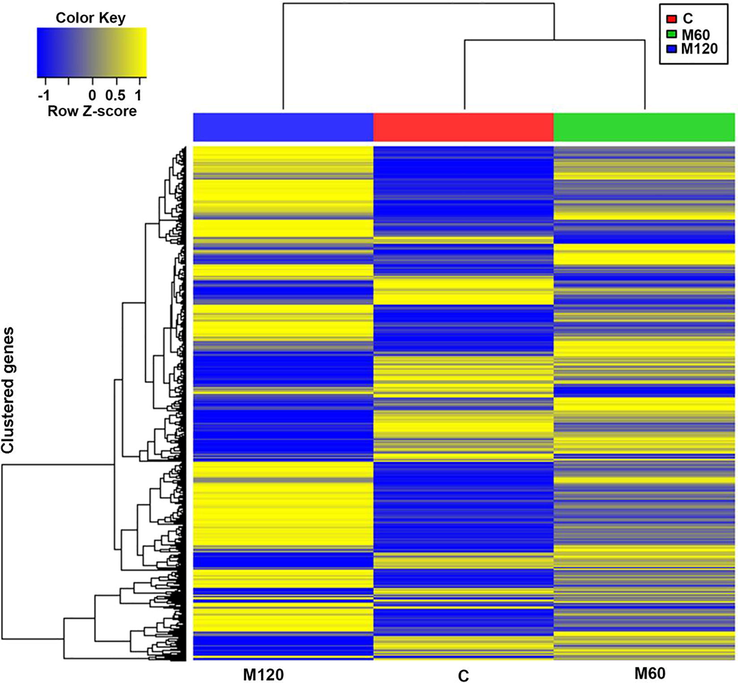
Heat map of one-way hierarchical clustering using Z-score for normalized value (log2 based) (1528 genes with significant change in expression based on |FC| > 2 and FDR-adjusted p < 0.5).
The top 10 terms of the 248 MFs included binding (928DEGs), organic cyclic compound binding (346DEGs), and heterocyclic compound binding (336DEGs) (Fig. 5c). Other significantly enriched MF terms included cell adhesion molecule binding (28DEGs), tubulin binding (22DEGs), and structural constituent of cytoskeleton (7 DEGs). In addition, transport related MF terms were enriched, such as transporter activity (124DEGs), transmembrane transporter activity (102DEGs), ion transmembrane transporter activity (89DEGs), cation transmembrane transporter activity (69DEGs), passive transmembrane transporter activity (61DEGs), inorganic cation transmembrane transporter activity (59DEGs), metal ion transmembrane transporter activity (54DEGs), active transmembrane transporter activity (30DEGs), potassium ion transmembrane transporter activity (27 DEGs), sodium ion transmembrane transporter activity (19 DEGs), calcium ion transmembrane transporter activity (14DEGs), and chloride transmembrane transporter activity (9 DEGs). Moreover, MF terms related to ion channel activity were enriched including channel activity (61DEGs), substrate-specific channel activity (59DEGs), ion channel activity (56DEGs), cation channel activity (44DEGs), gated channel activity (41DEGs), voltage-gated ion channel activity (24DEGs), voltage-gated cation channel activity (22DEGs), potassium channel activity (21DEGs), voltage-gated potassium channel activity (17DEGs), ligand-gated channel activity (16DEGs), calcium channel activity (14DEGs), ion gated channel activity (10DEGs), delayed rectifier potassium channel activity (9DEGs), chloride channel activity (8DEGs), calcium activated cation channel activity (7DEGs), sodium channel regulator activity (7DEGs), and potassium channel regulator activity (7DEGs). Furthermore, tumor related MF terms, such as tumor necrosis factor receptor binding (6DEGs), tumor necrosis factor receptor superfamily binding (6DEGs), and tumor necrosis factor-activated receptor activity (3DEGs) were enriched. Interestingly, olfaction related terms, such as, olfactory receptor activity (7DEGs) were enriched.
3.6 Analysis of gene expression
3.6.1 Hierarchical clustering
Heatmap is the hierarchical clustering analysis using Euclidean method and complete linkage that clusters the similarity of genes and samples by the normalized values of expression level of the significant DEGs. The heat map of the 1128 significant DEGs among control, M60, and M120 is shown in Fig. 5. It is well observed that gradual change in gene expression from the control group to the M60 to the M120 group. Colors in the heat map indicate that the control group and the M120 represent completely the opposite level of gene expression in all heat map sectors, while M60 represent the intermediate state of gene expression level (Fig. 5).
3.6.2 KEGG heat map
KEGG database has different types of data including genome sequence, structure, metabolic pathways, signal transduction, molecular interaction, and gene co-expression data. Total of 212 pathway terms were significantly enriched (p < 0.05). They were distributed as 31 metabolism, 26 environmental information processing, 15 cellular processes, 70 organismal systems, and 70 in human diseases pathway terms. Using the FDR-adjusted p-value (p < 0.05), 198 pathway terms were significantly enriched. Fig. 6 show the heat map of KEGG selected enriched pathway terms. Among the predominant metabolic pathway terms are the metabolism of xenobiotics by cytochrome P450 (p < 0.001) and drug metabolism-cytochrome P450 (p < 0.001) (Fig. 6). One of the highly significant enriched environmental information processing pathway term was the cell adhesion molecules (CAMs) (p < 0.001). The top represented cellular processes were regulation of cytoskeleton (p < 0.001), cellular senescence (p < 0.001), cell cycle, apoptosis, focal adhesion, tight junction, endocytosis. Among the top enriched organismal systems secretion of cortisol, insulin, renin, aldosterone, aldosterone regulated sodium reabsorption, olfactory transduction and taste transduction (Fig. 6). Various types of human diseases were also enriched including chemical carcinogenesis, transcriptional misregulation in cancer, microRNA in cancer, proteoglycans in cancer, and viral carcinogenesis (Fig. 6).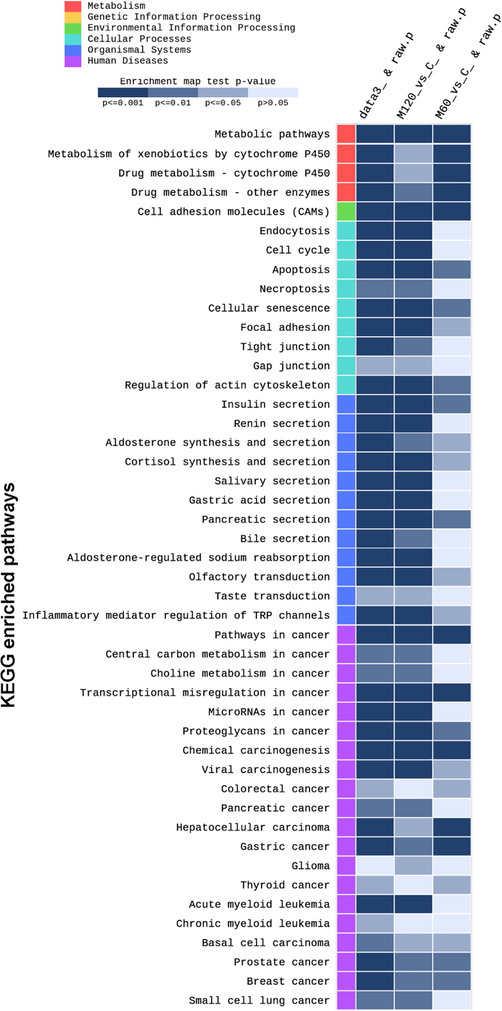
Partial heat map of selected KEGG enriched pathways in response to melamine treatment. Data3_&raw.p: combined dataset Vs C. The raw p-value lower than 0.05 means that the pathway has been significantly enriched. The gradient legend shows the level of enrichment and the raw p-value.
3.6.3 Expression and function of DEGs
The top 26 DEGs are summarized in Table 1.They included genes related to cell adhesion, response to stress, transport, and regulation of gene expression (Table 1). Some genes of this group had reversed gene expression trend; the expression of the gene is negatively correlated with the melamine concentration meaning their M120/C value was less than M60/C value. The full list of the 19 genes (4 downregulated and 15 upregulated) with their expression pattern is summarized in Supplementary Table2. This group included mostly genes related to cell adhesion, including Claudin 14 (11.96 in M60/C, 4.78 in M120), polycystic kidney and hepatic disease1 like1 (−19.13 in M60/C, −2.44 in M120) (Supplementary Table2). In addition, 15cell adhesion genes were differentially expressed; 2 genes were downregulated and 4 were upregulated in both M60 and M120. Out of this group, 9 genes were upregulated in the M60 at higher folds than their level in the M120 group. Also, five genes related to cytoskeleton organization were upregulated in response to melamine treatment (Table 2). This group included various cell adhesion molecules claudin 14, neurofascin, cadherin 22, protocadherin gamma subfamily B, and 8, protocadherin 7 (Table 2). Also, genes involved in cytoskeleton organization were significantly upregulated including collapsin response mediator protein 1, profilin member 4, tubulin gamma 2 (Table 2). Similarly, the expression of 20 stress responsive genes (4 downregulated, 16 upregulated) was changed in response to melamine. Four genes of this group had reversed gene expression trend (Table 2). Among this group were 3 cytochrome P450 members involved in metabolism of xenobiotics, chemical carcinogenesis, aromatase activity, and steroid biosynthesis (Table 2). Interestingly, this group included drastic change in the expression of several kidney function markers. For example, serine/threonine kinase 32C was highly upregulated, whereas protein disulfide isomerase-like, testis expressed was drastically downregulated (Table 2). Full list of differentially expressed kidney function marker genes is summarized in Table 3. In addition, several programmed cell death (apoptosis) and cytolysis related genes were also upregulated including granzyme B, granzyme M, modulator of apoptosis 1, perforin 1 (Table 2). Moreover, DEGs included 16 genes related to secretion and transport (1 downregulated, 15 upregulated) and 4 reversed gene expression trend genes (Table 2). These included 4 potassium voltage-gated channel members from subfamily A (3) and subfamily J (1). Also, 2 chloride channel involved in renin secretion were upregulated (Table 2). Five transmembrane solute carriers were significantly upregulated in response to melamine treatment (Table 2). Finally and more interesting, receptor genes of olfactory transduction of smell (2 genes) as well as the perception of bitter taste (1 gene) were upregulated in both treated groups (Table 2).
No
Gene ID
Transcript ID
Gene Symbol
Description
Function
Fold Change (FC)
M60/C
M120/C
1
365381
NM_001108922
Stk32c
serine/threonine kinase 32C
Kidney function marker, bladder cancer marker, protein serine/threonine kinase activity
22.76
21.75
2
690161
NM_001191101
Hfm1
HFM1, ATP-dependent DNA helicase homolog
cell cycle, meiotic nuclear division
18.28
4.41
3
171028
NM_001301664, NM_133517
Atp12a
ATPase H+/K + transporting non-gastric alpha2 subunit
Oxidative phosphorylation, regulation of pH
14.56
4.57
4
304073
NM_001013429
Cldn14
claudin 14
Cell adhesion molecules (CAMs), tight junction
11.96
4.78
5
155812
NM_130420
Trim9
tripartite motif-containing 9
Regulation of neurotransmitter levels, exocytosis, negative regulation of secretion and transport
11.50
13.54
6
116547
NM_053822
S100a8
S100 calcium binding protein A8
Acute inflammatory response, cell adhesion
11.19
3.51
7
494196
NM_001009488
Ly49s6
Ly49 stimulatory receptor 6
NA
11.07
17.45
8
100910202
NM_053797
Crnkl1
crooked neck pre-mRNA splicing factor 1
Response to stress
10.69
10.38
9
24296
NM_012540
Cyp1a1
cytochrome P450, family 1, subfamily a, polypeptide 1
Metabolism of xenobiotics, steroid hormone biosynthesis
9.14
21.10
10
302822
NM_175763
Igsf1
immunoglobulin superfamily, member 1
Regulation of transcription
8.95
3.97
11
24235
NM_012516
C4bpa
complement component 4 binding protein, alpha
Acute inflammatory response, response to stress and wounding, immune response, fertility and fertilization
8.53
23.11
12
303812
NM_001134535
Vwa5b2
von Willebrand factor A domain containing 5B2
NA
8.38
3.97
13
117505
NM_057144
Csrp3
cysteine and glycine rich protein 3
Regulation of transcription, cytoskeleton organization, response to abiotic stimulus
7.81
4.47
14
59105
NM_021585
Milr1
mast cell immunoglobulin-like receptor 1
Mast cell mediated immunity, transport
7.52
8.02
15
297894
NM_001006979
Matn1
matrilin 1, cartilage matrix protein
Cartilage development
7.24
2.42
16
362052
NM_001013202
Clca2
chloride channel calcium activated 2
Renin secretion, anion channel activity
7.23
2.99
17
64350
NM_031691
Itgad
integrin subunit alpha D
Cell-cell adhesion
6.86
13.35
18
29191
NM_019162
Tac3
tachykinin 3
Cell communication and signal trasduction, response to ammonium ion, response to nitrogen compound
6.79
2.27
19
25415
NM_012932
Crmp1
collapsin response mediator protein 1
Cytoskeleton organization, response to external stimulus, neurogenesis
6.62
19.00
20
367074
NM_001108998
Tmprss4
transmembrane protease, serine 4
Endopeptidase activity, receptor-mediated endocytosis
−6.33
−6.17
21
361945
NM_001108550
Postn
periostin
Kidney function marker, response to stress, tissue regeneration and healing
−8.79
−9.69
22
685890
NM_001277394
Srrm3
serine/arginine repetitive matrix 3
NA
−14.19
−4.95
23
289264
NM_001105974
Grem2
gremlin 2, DAN family BMP antagonist
Kidney function marker, regulation of transcription
−16.88
−23.25
24
314917
NM_001034931
Pkhd1l1
polycystic kidney and hepatic disease 1-like 1
Cell projection
−19.13
−2.44
25
365224
NM_001271339
Zfp74
zinc finger protein 74
Transcription factor
−22.68
−42.83
26
293544
NM_001013902
Pdilt
protein disulfide isomerase-like, testis expressed
Kidney function marker, spermatogenesis, response to stress
−36.50
−80.15
No
Gene ID
Transcript ID
Gene Symbol
Description
Function
FC
M60/C
M120/C
Cell Adhesion and cytoskeleton organization
1
304073
NM_001013429
Cldn14
claudin 14
Cell adhesion molecules (CAMs), tight junction
11.96
4.78
2
116547
NM_053822
S100a8
S100 calcium binding protein A8
Acute inflammatory response,cell adhesion
11.19
3.51
3
64350
NM_031691
Itgad
integrin subunit alpha D
Cell-cell adhesion
6.86
13.35
4
25415
NM_012932
Crmp1
collapsin response mediator protein 1
Cytoskeleton organization, response to external stimulus, neurogenesis
6.62
19.00
5
116690
NM_001160313, NM_053909
Nfasc
neurofascin
Cell adhesion molecules (CAMs), generation of neurons
4.93
3.00
6
60391
NM_021767
Nrxn1
neurexin 1
Cell adhesion molecules (CAMs), angiogenesis
3.90
−2.63
7
171394
NM_134377
Clstn2
calsyntenin 2
Cell-cell adhesion, regulation of cell communication,
3.88
2.51
8
24584
NM_012605
Mylpf
myosin light chain, phosphorylatable, fast skeletal muscle
Focal adhesion, regulation of actin cytoskeleton
3.32
2.50
9
313785
NM_001172079
Icam5
intercellular adhesion molecule 5
Cell-cell adhesion, transport
3.29
4.25
10
494222
NM_001009503
Pfn4
profilin family, member 4
Regulation of actin cytoskeleton organization
3.08
3.61
11
29182
NM_019161
Cdh22
cadherin 22
cell–cell adhesion
2.74
2.18
12
364845
NM_001037159
Pcdhgb8
protocadherin gamma subfamily B, 8
cell–cell adhesion
2.61
2.25
13
314721
NM_001271371
Anks1b
ankyrin repeat and sterile alpha motif domain containing 1B
Cell junction, neuron projection
2.56
3.31
14
25713
NM_013171
Itgb7
integrin subunit beta 7
Cell adhesion molecules (CAMs), focal adhesion
2.55
4.55
15
25245
NM_001270713,NM_173100
Bdkrb2
bradykinin receptor B2
Regulation of actin cytoskeleton, acute inflammatory response
2.40
2.17
16
289257
NM_001011908
Spta1
spectrin, alpha, erythrocytic 1
Apoptosis, cell–cell adhesion
2.21
−8.44
17
680991
NM_001191075
Tubg2
tubulin, gamma 2
Microtubule cytoskeleton organization
2.07
2.10
18
362800
NM_001108726
Itgb8
integrin subunit beta 8
Focal adhesion, cell-matrix adhesion
2.02
2.50
19
310683
NM_001107699
Itga10
integrin subunit alpha 10
Focal adhesion, cell-matrix adhesion, regulation of cytoskeleton
−2.05
−2.58
20
360942
NM_001004087
Pcdh7
protocadherin 7
cell–cell adhesion,
−2.14
−2.81
Response to stress
1
365381
NM_001108922
Stk32c
serine/threonine kinase 32C
Kidney function marker, bladder cancer marker, protein serine/threonine kinase activity
22.76
21.75
2
100910202
NM_053797
Crnkl1
crooked neck pre-mRNA splicing factor 1
Response to stress
10.69
10.38
3
24296
NM_012540
Cyp1a1
cytochrome P450, family 1, subfamily a, polypeptide 1
Metabolism of xenobiotics, steroid hormone biosynthesis
9.14
21.10
4
24235
NM_012516
C4bpa
complement component 4 binding protein, alpha
Acute inflammatory response, response to stress and wounding, immune response, fertility and fertilization
8.53
23.11
5
308099
NM_001038615
Fndc1
fibronectin type III domain containing 1
Response to stress and hypoxia, positive regulation of programmed cell death,
4.23
14.45
6
299261
NM_001013101
Moap1
modulator of apoptosis 1
Response to stress, regulation of programmed cell death, release of cytochrome c from mitochondria
4.23
4.47
7
171528
NM_138517
Gzmb
granzyme B
Apoptosis, transcriptional misregulation in cance, cytolysis
4.09
3.66
8
303530
NM_001008752
Krt16
keratin 16
Response to stress, inflammatory response, deffense response
3.55
4.16
9
50669
NM_017330
Prf1
perforin 1
Apoptosis, cytotoxicity, defense response to tumor cell, response to stress, cytolysis
3.21
3.77
10
117033
NM_053963
Mmp12
matrix metallopeptidase 12
Regulation of cell proliferation, response to wounding, proteolysis
2.96
4.83
11
641519
NM_001037368
Defb29
defensin beta 29
Stress response
2.88
4.15
12
114700
NM_053763
Cyp27b1
cytochrome P450, family 27, subfamily b, polypeptide 1
Steroid biosynthesis, detoxification, body fluid secretion
2.47
2.66
13
25352
NM_012880
Sod3
superoxide dismutase 3, extracellular
Kidney function marker, response to oxidative stress, detoxification,
2.47
2.14
14
171091
NM_133564
Zbp1
Z-DNA binding protein 1
Necroptosis, response to stress, regulation of cell communication
2.44
6.22
15
24273
NM_001289737,NM_012534
Cryaa
crystallin, alpha A
Response to reactive oxygen species, response to hypoxia, visual perception, response to stresses, regulation of programmed cell death
2.43
4.50
16
29252
NM_057183
Gzmm
granzyme M
Cytolysis, response to stress, programmed cell death
2.27
4.68
17
689388
NM_001109536
Ptx3
pentraxin 3
Response to stress
−2.03
−4.68
18
29277
NM_019184
Cyp2c11
cytochrome P450, subfamily 2, polypeptide 11
Chemical carcinogenesis, aromatase activity, Retinol metabolism, , response to xenobiotic stimulus,
−2.65
−32.47
19
24186
NM_134326
Alb
albumin
Response to stress, cytolysis, regulation of circadian rhythm
−5.04
6.85
20
293544
NM_001013902
Pdilt
protein disulfide isomerase-like, testis expressed
Kidney function marker, spermatogenesis, response to stress
−36.50
−80.15
Secretion and Transport
1
362052
NM_001013202
Clca2
chloride channel calcium activated 2
Renin secretion, anion channel activity,
7.23
2.99
2
171028
NM_001301664,NM_133517
Atp12a
ATPase H+/K + transporting non-gastric alpha2 subunit
Oxidative phosphorylation, regulation of pH
14.56
4.57
3
155812
NM_130420
Trim9
tripartite motif-containing 9
Regulation of neurotransmitter levels, exocytosis, cell–cell signaling, negative regulation of secretion and transport
11.50
13.54
4
316062
NM_001126285
Slc22a13
solute carrier family 22 member 13
Transmembrane transporter activity
5.33
14.54
5
317170
NM_001108242
Slc9a7
solute carrier family 9 member A7
Ion transmembrane transporter activity
3.95
2.44
6
80900
NM_030838
Slco1a5
solute carrier organic anion transporter family, member 1a5
Sodium-independent organic anion transport, nitrogen compound transport,
3.87
5.28
7
25469
NM_012971
Kcna4
potassium voltage-gated channel subfamily A member 4
Cortisol synthesis and secretion, regulation of ion transport,
3.40
−6.60
8
679135
NM_001127602
Slc25a53
solute carrier family 25, member 53
NA
3.20
4.77
9
25703
NM_013162
Rbp4
retinol binding protein 4
Regulation of peptide transport, renal system development, regulation of transport
3.18
23.86
10
29738
NM_017304
Kcnab2
potassium voltage-gated channel subfamily A regulatory beta subunit 2
Voltage-gated potassium channel activity, regulation of metal ion transport
2.73
3.81
11
308015
NM_001107449
Clca1
chloride channel accessory 1
Renin secretion, response to hypoxia
2.63
4.18
12
294075
NM_001047088
Ffar4
free fatty acid receptor 4
Negative regulation of secretion and transport, response to stress
2.60
13.97
13
29731
NM_019270
Kcna3
potassium voltage-gated channel subfamily A member 3
Voltage-gated potassium channel activity, inorganic ion transmembrane transport
2.21
3.39
14
85262
NM_053500
Slc25a27
solute carrier family 25, member 27
Organic substance transport
2.02
2.47
15
83535
NM_031358
Kcnj11
potassium voltage-gated channel subfamily J member 11
Insulin secretion, regulation of cell communication
−2.93
−4.62
16
191595
NM_138835
Syt12
synaptotagmin 12
Neurotransmitter secretion and transport
−3.81
2.23
Sense perception
1
300626
NM_001000474
Olr1326
olfactory receptor 1326
Olfactory transduction and perception of smell
3.29
4.64
2
289247
NM_001000081
Olr1584
olfactory receptor 1584
Olfactory transduction and perception of smell
3.32
7.52
3
360733
NM_001108321
Rtp4
receptor (chemosensory) transporter protein 4
Sensory perception of bitter taste, olfactory receptor binding, sensory perception
2.37
5.23
No
Gene ID
Transcript ID
Gene Symbol
Description
Function
FC
M60/C
M120/C
1
365381
NM_001108922
Stk32c
serine/threonine kinase 32C
Kidney function marker, bladder cancer marker, protein serine/threonine kinase activity
22.76
21.75
2
25352
NM_012880
Sod3
superoxide dismutase 3, extracellular
Kidney function marker, response to oxidative stress, detoxification,
2.47
2.14
3
361945
NM_001108550
Postn
Periostin
Kidney function marker, response to stress, tissue regeneration and healing
−8.79
−9.69
4
289264
NM_001105974
Grem2
gremlin 2, DAN family BMP antagonist
Kidney function marker, regulation of transcription
−16.88
−23.25
5
293544
NM_001013902
Pdilt
protein disulfide isomerase-like, testis expressed
Kidney function marker, spermatogenesis, response to stress
−36.50
−80.15
4 Discussion
Nephron function depends on the balance between permeability and barrier features of fluid and solutes which is mainly depends on the architecture of epithelial cells and their attachment to their surrounding extracellular matrix (Prozialeck and Edwards, 2007). The unique architecture of nephrons is achieved by various types of cell–cell and cell-matrix junctions including adheren junctions, tight junctions, gap junctions, and focal adhesion. Elements of these junctions are attached to cytoskeleton components and components of the extracellular matrix (Prozialeck and Edwards, 2007). The early stages of kidney injury as a result of exposure to toxic compounds are presented in the weakening of cell–cell adhesion leading to shedding off the injured cells to the tubular lumen. Cell detachment induces inflammatory molecules including cytokines as well as the repair process (Prozialeck and Edwards, 2007).
Melamine treatment had a significant impact on gene expression in kidney. This was indicated by the upregulation of 422 and 801 genes in the low dose (M60/C) group and the high dose (M120/C) group consecutively and downregualtion of 187 and 438 in the low dose (M60/C) group and the high dose (M120/C) group respectively. In addition, melamine treatment significantly enriched 212 KEGG pathways related to various organism biological processes. The administered levels of melamine in the current study is much lower than the doses used in previous studies (Gossner et al., 2009; Hsieh et al., 2012; Early et al., 2013; Dai et al., 2015) and lower than the detected levels of melamine in food products (Jalili, 2017).
Claudin14 is a member of claudin family that forms the tight junctions (Wilcox et al., 2001). Claudins have a substantial role in physiology and development of renal epithelial cells. For example, claudin-2 has vital role in paracellular salt reabsorption, whereas claudin-14 along with claudin-16 and claudin-19 control paracellular reabsorption Ca + 2 and Mg + 2. Some genetic variants of claudin-14 were linked to nephrolithiasis. Interestingly, claudin-14 gene expression was modulated by levels of extracellular calcium (Gong and Hou, 2017). Our data go in line with previous reports since Claudin14 was highly expressed at 11.96 folds in the M60 group (Table 2) suggesting a misregulation of kidney function by melamine and kidney cells are producing more Claudins to overcome this dysregulation. This also is in line with the enrichment of various cell adhesion KEGG pathways including focal adhesion, tight junction, and gap junctions.
The progenitor renin cells in the kidney produce renin which maintain the kidney architecture and play an indispensible role in renal repair and regeneration (Gomez, 2017). Renin senses the changes in renal perfusion pressure in response to low sodium in the distal tubule. It activates the renin-angiotensin-aldosterone system in which renin activates angiotensin II which activates aldosterone. Aldosterone is a potent regulator of Claudin and the paracellular chloride permeability (Gong and Hou, 2017). It regulates the homeostasis of potassium and sodium and contributes to the inflammation, high blood pressure, fibrosis, and glomerular injury of the kidney (Brown, 2013). The KEGG pathway of aldosterone synthesis and secretion was significantly enriched in both M60 and M120 groups. Similarly, renin secretion pathway was significantly enriched in response to melamine treatment indicating that melamine caused an early renal injury.
In our study, many adhesion molecules were increased in the M60 and M120 groups. On the other hand, albumin level was decreased in the M60 group and was increased in the M120 group. This trend was observed and in line with results from previous studies (Vaccaro et al., 2007). Observed high levels of soluble adhesion molecules did not positively correlate with albumin and cholesterol levels, but on the other hand, correlated positively with the disease stage and the C-reactive protein (CRP) level (Vaccaro et al., 2007). Neurexin 1, a cell adhesion gene was upregulated 3.9 folds in the M60 group and downregulated −2.63 folds in the M120 group. Neurexin showed similar pattern of expression after 10 days of PAN nephropathy rats. Immunostaining of neurexins was markedly reduced in PAN nephropathy. This suggested that neurexin could serve as an early sensitive marker for kidney injury specially slit diaphragm injury (Saito et al., 2011). This notion is also supported by the enrichment of the cell adhesion molecules (CAMs) KEGG pathway.
Fibrosis is one major characteristic of chronic kidney injury that results of the high deposition of components of the extracellular matrix to replace the injured tissue (Pozzi and Zent, 2013). Intergins play important role in cell-matrix interaction and the development of renal fibrosis (Pozzi and Zent, 2013). Integrin beta 7 and integrin beta 8 were significantly expressed at more than 2 folds. Higher expression of cell adhesion molecules, especially integrins caused changes in the extracellular matrix and formation of epithelial cell cyst in the kidney (Joly et al., 2003). Also, it is well established that changes in the expression of adhesion molecules by chemicals would lead to chemical carcinogenesis (Prozialeck and Edwards, 2007). Several related KEGG pathways were highly enriched in the current study including apoptosis, necroptosis, cell senescence indicating the invoking of the early predisposing stages of kidney injury and fibrosis. In addition, several cancer pathways were enriched including chemical carcinogenesis, colorectal cancer, hepatocellular carcinoma, thyroid cancer, and prostate cancer.
A number of cytoskeleton organization genes were upregulated in the current study. This included integrin alpha D and bradykinin receptor B. These genes are related to cytoskeleton organization in response to stress and inflammation. Upregulation of various cell–cell adhesion, cell-matrix adhesion, and cytoskeleton organization genes indicate that melamine was able to induce the early stages of kidney injury and fibrosis which predispose for major kidney injury.
In the current study, higher M60/C compared to M120/C was observed in many genes. The reason for this is not known, but can be speculated in two ways. First, when kidney cells are exposed to lower melamine level (M60) they take longer time to respond to melamine contamination by establishing the adhesion network required for kidney injury and fibrosis. Accordingly, those genes were still in the upregulation phase. Whereas, when cells were exposed to higher levels (M120) the response for kidney injury and fibrosis was faster and gene expression have passed the stage of adhesion network for injury and fibrosis and started the downregulation phase. Therefore, the establishment of cell adhesion network required for injury and fibrosis occurs in the early stage of exposure to higher doses of the stress molecule and that may have occurred earlier in the M120 group. Second, at low melamine concentration in M60 cells were expressing more adhesion molecules to counteract the melamine cell detaching effect. On the other hand, the higher level of melamine in the M120 group was able to overpass the function of adhesion molecules and induced the cell detachment; therefore cell would have passed the need for more adhesion molecules and consequently decreased their gene expression levels. Both of these scenarios require more research for their validation.
In response to melamine stress, a number of 20 stress responsive genes had change in their expression. They included 3 cytochrome P450 (CYPs), 1A1, 27B1, 2-11, 2 granzymes (Gzmb, GzmM), perforin1, and other stress responsive genes. In the current study, Gzmb was upregulated more than 4 folds compared to the control group. Granzymes are proteases that induce apoptosis in damaged cells (Greenberg, 1996). Gzmb is a candidate marker for kidney function and was elevated in the damaged kidney of patients with systemic lupus erythematosus (SLE) (Kok et al., 2017). Apoptosis, necroptosis, and cellular senescence pathways were highly enriched in the current study correlating with the individual gene expression levels.
CYPsare group of enzymes that are expressed and work in liver and are involved in detoxification of numerous xenobiotics (Anzenbacher and Anzenbacherova, 2001). CYP1A1 is expressed in other tissues than liver and is induced by the polycyclic aromatic compounds (Tomankova et al., 2017; Momper and Nigam, 2018). It was upregulated more than 9 and 21 folds in the M60 and M120 groups consecutively. In the same line, metabolism of xenobiotics by CYPs, drug metabolism-CYPs pathways were enriched indicating a positive correlation with the CYPs expression level.
The intermediate filaments, keratins, are component of the cytoskeleton of epithelial cells. Expression of keratins is upregulated and they are phosphorylated during the stress of kidney disease development. Using immunohistochemistry and quantitative PCR, the expression of four keratins, K7, K8, K18, K19 was upregulated from 20 to 40 folds in five various renal tubular injuries. These changes were detected upon tubular injury and they did not depend on the type of injury (Djudjaj et al., 2016). We obtained similar results of Keratin 16 that was upregulated in this study more than 3.5 folds.
Several reports confirmed that olfactory and other sense receptors are widely expressed in various organs, other than sense organs, and tissues including kidneys (Shepard and Pluznick, 2016). Renal tubules are directly exposed to components of urine, therefore the expression of olfactory receptors changes in response to urine components (Kalbe et al., 2016). Although yet their function in kidney under stress is unknown, three sense perception receptors were upregulated in response to melamine. Olfactory transduction and taste transduction pathways were significantly enriched in response to melamine.
The expression of several kidney injury marker genes was significantly changed in this study. These included serine/therionine kinase 32C (Stk32c), periostin (Postn), gremlin 2 (Grem2), protein disulfide isomerase-like, testis expressed (Pdilt), superoxide dismutase 3 (Sod3). STK32C was highly expressed in response to melamine treatment by 22.76 folds compared to the control group. It was shown that STK32C was overexpressed in bladder cancer and several human tumors which were correlated with short relapse-free survival (RFS) in bladder cancer patients (Sun et al., 2019). Periostin protein is usually expressed during development of embryos, yet it is not normally detected in adult kidneys. Recently, it was proved that it is a tissue repair protein with an unknown role after acute kidney injury (Wallace, 2019; Prakoura and Chatziantoniou, 2017). Gremlin is a developmental gene that was overexpressed in response to renal damage and other chronic kidney dysfunctions (Mezzano et al., 2018). Its expression level also was correlated with fibrosis of tubulointerstitial and serum creatinine levels. It was suggested that gremlin is involved in fibrosis and it could serve as urinary biomarker in ANCA + renal vasculitis (Droguett et al., 2019). Protein disulfide isomerase (PDI) is responsible for the regulation of renal AT1 receptor function and blood pressure in rats. It regulates the redox balance, renal AT1 receptor function, as well as blood pressure in rats (Wang and Asghar, 2017). Due to its role in the protection from renal injury (Schneider et al., 2010), SOD3 is upregulated in renal tissues to protect them from peroxynitrite renal ischemia/reperfusion (I/R) injury. Melamine induced upregulation of SOD3 expression to protect kidney from harmful effects. The expression of 5 kidney injury markers confirm that melamine had an impact on the kidney function and gene expression is an effective approach to early discover kidney injury by chemicals. The upregulation of various kidney injury markers is associated with the enrichment of different pathways involved in cancer, fibrosis, and regulation of blood pressure.
Albumin has wide range of functions including response to stress and cytolysis (Jensen et al., 2015). Liver is the main source of albumin, yet albumin was expressed in the kidney renal cortex and other several tissues indicating that albumin mRNA was expressed in both epithelial and non-epithelial tissues (Jensen et al., 2015). Albumin function in these tissues has not been identified, but it could be related to stress (Jensen et al., 2015).
Altogether, induction of several groups of genes related to cell adhesion and cytoskeleton organization, stress response, kidney function markers, and olfactory transduction and smell perception confirm that the subchronic sublethal doses used in this study were able to invoke the early stages of kidney function dysregulation, kidney injury, and kidney fibrosis. This conclusion was supported by the enrichment of parallel pathways involved in cell adhesion, stress, apoptosis, various types of cancer, and olfactory transduction.
5 Conclusion
Results obtained in the current study conclude that melamine caused differential gene expression of various groups of genes related to biological functions and pathways involved in the functions of kidneys. Also, melamine caused the enrichment of various pathways including cell adhesion, response to stress, and olfactory perception. The majority of DEGs genes and the enriched pathways are related to kidney function and kidney damage progression. Results will help in the development of markers for detection of the early stages of kidney injury and kidney fibrosis.
Funding
This work was funded by Taif University Researchers Supporting Project number (TURSP-2020/75), Taif University, Taif, Saudi Arabia.
Data availability
The data used to support the findings of this study are included within the article and supplementary materials.
Conflict of interest
Authors declare no conflict of interest.
References
- Hemato-immunologic impact of subchronic exposure tomelamine and/or formaldehyde in mice. J. Immunotoxicol.. 2016;13(5):713-722.
- [Google Scholar]
- Cytochromes P450 and metabolism of xenobiotics. Cell. Mol. Life Sci.. 2001;58(5):737-747.
- [Google Scholar]
- Trimmomatic: a flexible trimmer for Illumina sequence data. Bioinformatics. 2014;30(15):2114-2120.
- [Google Scholar]
- Contribution of aldosterone to cardiovascular and renal inflammation and fibrosis. Nat. Rev. Nephrol.. 2013;9(8):459-469.
- [Google Scholar]
- Renal function and the exposure to melamine and phthalates in Shanghai adults. Chemosphere. 2020;246:125820.
- [Google Scholar]
- Analysis of melamine resins bycapillary zone electrophoresiswith electrospray ionization-mass spectrometric detection. Electrophoresis. 2005;26:1576-1583.
- [Google Scholar]
- Keratins are novel markers of renal epithelialcell injury. Kidney Int.. 2016;89(4):792-808.
- [Google Scholar]
- Gremlin, a potential urinary biomarker of anca-associated crescentic glomerulonephritis. Sci. Rep.. 2019;9(1):6867.
- [Google Scholar]
- Melamine negatively affects oocyte architecture, oocyte development and fertility in miceoocyte development and fertility in mice. Hum Reprod.. 2015;30:1643-1652.
- [Google Scholar]
- Repeat oral dose toxicity studies of melamine in rats and monkeys. ArchToxicol.. 2013;87(3):517-527.
- [Google Scholar]
- Fate of renin cells during development and disease. Hypertension. 2017;69(3):387-395.
- [Google Scholar]
- Claudins in barrier and transport function-the kidney. Pflugers Arch.. 2017;469(1):105-113.
- [Google Scholar]
- The melamine incident: implications for international food and feed safety. Environ. Health Perspect.. 2009;117(12):1803-1808.
- [Google Scholar]
- Granzyme B-induced apoptosis. In: Gupta S., Cohen J.J., eds. Mechanisms of Lymphocyte Activation and Immune Regulation VI. Boston, MA: Springer; 1996.
- [Google Scholar]
- Associations of melamine and cyanuric acid exposure with markers of kidney function in adults: Results from NHANES 2003–2004. Environ. Int.. 2020;141:105815.
- [CrossRef] [Google Scholar]
- The induction of bladder stones by terephthalic acid, dimethyl terephthalate, and melamine (2,4,6-triamino-s-triazine) and its relevance to risk assessment. Regul. Toxicol. Pharm.. 1985;5:294-313.
- [Google Scholar]
- Melamine induces human renal proximal tubular cell injury via transforming growth factor-β and oxidative stress. Toxicol. Sci.. 2012;130(1):17-32.
- [Google Scholar]
- Review paper on melamine in milk and dairy products. Dairy Vet Sci J.. 2017;1(4):1-3.
- [Google Scholar]
- Renal type A intercalated cells contain albumin in organelles with aldosterone-regulated abundance. PLoS ONE. 2015;10(4):e0124902.
- [Google Scholar]
- Beta4 integrin and laminin 5 are aberrantly expressed in polycystic kidney disease: in increased cell adhesion and migration. Am. J. Pathol.. 2003;163(5):1791-1800.
- [Google Scholar]
- Olfactory signaling components and olfactory receptors are expressed in tubule cells of the human kidney. Arch. Biochem. Biophys.. 2016;15(610):8-15.
- [Google Scholar]
- Melamine and/or formaldehyde exposures affect steroidogenesis via alteration of StAR protein and testosterone synthetic enzyme expression in male mice. Environ. Toxicol. Pharmacol.. 2017;50:136-144.
- [Google Scholar]
- Graph-based genome alignment and genotyping with HISAT2 and HISAT-genotype. Nat. Biotechnol.. 2019;37(8):907-915.
- [Google Scholar]
- Systemic and local granzyme B levels are associated with disease activity, kidney damage and interferon signature in systemic lupus erythematosus. Rheumatology. 2017;56(12):2129-2134.
- [Google Scholar]
- An evaluation of genotoxicity and cytotoxicity of melamine in combination with cyanuric acid at three mass ratios. Biomed. Environ. Sci.. 2014;27(8):641-645.
- [Google Scholar]
- Gremlin and renal diseases: ready to jump the fence to clinical utility? Nephrol. Dial. Transplant.. 2018;33(5):735-741.
- [Google Scholar]
- Origin of the earliest correlated neuronal activity in the chick embryo revealed by optical imaging with voltage-sensitive dyes. Eur. J. Neurosci.. 2009;29:1-13.
- [Google Scholar]
- Developmental regulation of kidney and liver solute carrier and ATP-binding cassette drug transporters and drug metabolizing enzymes: the role of remote organ communication. Expert Opin. Drug Metab. Toxicol.. 2018;14(6):561-570.
- [Google Scholar]
- NTP carcinogenesis bioassay of melamine (CAS No. 108–78-1) in F344/N rats and B6C3F1 mice (feed study) Natl. Toxicol. Program Tech. Rep. Ser.. 1983;245:1-171.
- [Google Scholar]
- In vitro and in vivo evaluation of a melamine dendrimer as a vehicle for drug delivery. Int. J. Pharm.. 2004;281(1-2):129-132.
- [Google Scholar]
- Pertea, M., Kim, D., Pertea, G.M., Leek, J.T., Salzberg, S.L., 20016. Transcript-level expression analysis of RNA-seq experiments with HISAT, StringTie and Ballgown. Nat Protoc. 11(9):1650-1667.
- StringTie enables improved reconstruction of a transcriptome from RNA-seq reads. Nat. Biotechnol.. 2015;33(3):290-295.
- [Google Scholar]
- Cell adhesion molecules in chemically-induced renal injury. Pharmacol. Ther.. 2007;114(1):74-93.
- [Google Scholar]
- Raudvere, U., Kolberg, L., Kuzmin, I., et al. 2019. g:Profiler: a web server for functional enrichment analysis and conversions of gene lists (2019 update). Nucl. Acids Res. 47(W1):W191-W198.
- Neurexin-1, a presynaptic adhesion molecule, localizes at the slit diaphragm of the glomerular podocytes in kidneys. Am. J. Physiol. Regul. Integr. Comp. Physiol.. 2011;300(2):R340-R348.
- [Google Scholar]
- Schneider, M.P., Sullivan, J.C., Wach, P.F., Boesen, E.I., Yamamoto, T., Fukai, T., Harrison, D.G., Pollock, D.M., Pollock, J.S., Protective role of extracellular superoxide dismutase in renal ischemia/reperfusion injury. Kidney Int. 78(4):374-81.
- How does your kidney smell? Emerging roles for olfactory receptors in renal function. Pediatr. Nephrol.. 2016;31(5):715-723.
- [Google Scholar]
- Serine/threonine kinase 32C is overexpressed in bladder cancer and contributes to tumor progression. Cancer Biol. Ther.. 2019;20(3):307-320.
- [Google Scholar]
- Effects of obesity on liver cytochromes P450 in various animal models. Biomed. Pap. Med. FacUnivPalacky Olomouc Czech Repub.. 2017;161(2):144-151.
- [Google Scholar]
- Genotoxicity assessment of melamine in the in vivo Pig-a mutation assay and in a standard battery of assays. Mutat. Res. Genet. Toxicol. Environ. Mutagen.. 2015;1(777):62-67.
- [Google Scholar]
- Circulating levels of adhesion molecules in chronic kidney disease correlate with the stage of renal disease and with C-reactive protein. Arch. Med. Res.. 2007;38(5):534-538.
- [Google Scholar]
- Wallace, D.P., 2019. Periostin in the Kidney. In: Kudo A. (eds) Periostin. Advances in Experimental Medicine and Biology. 1132.
- Protein disulfide isomerase regulates renal AT1 receptor function and blood pressure in rats. Am. J. Physiol. Renal Physiol.. 2017;313(2):F461-F466.
- [Google Scholar]
- Mutations in the gene encoding tight junction claudin-14 cause autosomal recessive deafness DFNB29. Cell. 2001;104(1):165-172.
- [Google Scholar]
- Plasma harmacokinetics of melamine and ablend of melamine and cyanuric acid in rainbow trout (Oncorhynchusmykiss) Regul. Toxicol. Pharmacol.. 2011;l61:93-97.
- [Google Scholar]
- The effects of melamine on humoral immunity with or without cyanuric acid in mice. Res Vet.. 2016;105:65-73.
- [Google Scholar]
- The toxic effects of melamine on spleen lymphocytes with or without cyanuric acid in mice. Res. Vet.. 2014;97(3):505-513.
- [Google Scholar]
Appendix A
Supplementary data
Supplementary data to this article can be found online at https://doi.org/10.1016/j.jksus.2021.101727.
Appendix A
Supplementary data
The following are the Supplementary data to this article:
Supplementary Fig. 1
Supplementary Fig. 1
Data quality of significant DEGs dataset. a: multidimentional data scaling (MDS), b: distribution of differentially expressed genes with various numbers of zero counts.
Supplementary Table 1
Supplementary Table 1
Statistics of raw and trimmed data.
Supplementary Table 2
Supplementary Table 2
DEGs with reversed gene expression trend in M60 and M120 (|FC|>=2, ,bh-adjusted p-value<0.05).


