

Translate this page into:
Investigations on the non-covalent interactions, drug-likeness, molecular docking and chemical properties of 1,1,4,7,7- pentamethyldiethylenetriammonium trinitrate by density-functional theory
⁎Corresponding author. issaoui_noureddine@yahoo.fr (Noureddine Issaoui)
-
Received: ,
Accepted: ,
This article was originally published by Elsevier and was migrated to Scientific Scholar after the change of Publisher.
Peer review under responsibility of King Saud University.
Abstract
Abstract
An advanced organic–inorganic hybrid compound 1,1,4,7,7-pentamethyldiethylenetriammonium trinitrate (PMDT) has been synthesized and characterized by X-ray diffractometry. The title molecule is abbreviated as PMDT has been investigated using experimental and computational techniques. The quantum chemical study was carried out using DFT calculation with B3LYP/6–31++G(d, p) basis set. Different methods have been performed to quantify the non covalent interactions within the title molecule. Atoms In Molecules (AIM) approach at bond critical points BCP's of the hydrogen bonds (C–H…O and N–H…O) in PMDT have been applied. Electron localization Function (ELF) and Local Orbital Locator (LOL) methods were studied in order to detect the electron density at bonding and anti-bonding sites of the title compound. The Hirshfeld surface analysis exposes important information on the inter and intramolecular interactions present in the crystal structure. Further characterization of the non covalent interactions has been shown by reduced Density of Gradient (RDG) and Independent Gradient Model (IGM). In addition, to map and analyze the weak-interaction regions, the interaction region indicators (IRI) have been used. The effect of polar solvents for the electrophilic and nucleophilic sites has been investigated. The ChELPG and Mulliken population analyses have been carried out. Frontier molecular orbital's (HOMO-LUMO) was discussed to afford the information about the reactivity of the PMDT molecule in gas, water and DMSO solvation. The temperature behavior and conductivity of the title molecule have been analyzed. Finally, in order to estimate the antibacterial mechanism of the PMDT compound action, molecular docking calculations were carried out on the active sites of various proteins.
Keywords
DFT calculation
AIM analysis
IGM
Frontier molecular orbitals
Antibacterial activity

1 Introduction
Molecular modeling is a theoretical technique used to visualize molecules, calculate their conformations and simulate their behavior statically or dynamically. This tool is a new status for molecular biology in order to determine their geometry and physicochemical proprieties. Indeed, thanks to this method, it is then possible to study the different types of interactions such as the non-covalent interactions. These interactions play an essential role in various fields, including chemical biology, medicinal chemistry, and chemical industry (Medimagh et al., 2021). Several types of the non covalent interactions (NCI), specifically, the van der Waals (vdW), hydrophobic, and ionic interactions and hydrogen bonds have been intensively investigated to deeper understand structures of organic and inorganic compounds (Ahmed et al., 2021). In this context, the aim of this work is to investigate the hydrogen bonding interactions in the hybrid compound PMDT. The PMDT consists of an organic group (1), 1,4,7,7-pentamethyldiethylenetriammonium, (C9H26N33+) and an inorganic group (nitrate (NO3–)). Owing to its antimicrobial activity, pentamethyldiethylenetriamine was previously used mainly in pharmaceutics (Patel et al., 2004). In this paper, we focus on the examination of antibacterial agents with the structure of the new PMDT molecule. We carry out the theoretical study using the DFT (B3LYP)/6–31++G (d, p) method in its ground state. The experimental results are confirmed by the theoretical calculation involving the optimization of the molecular geometry and parameters. The role of NCI in the molecule under study is elucidated by AIM, ELF and LOL methods. The intermolecular interactions in the crystal structure are explored using the Hirshfeld surface analysis. The RDG and IGM analyses were performed to clarify the hydrogen bonding interactions. The IRI approach is used to study and visualize weak interactions in the investigated molecule. The charge transfer and bonding interactions in the PMDT compound are explored using NBO analysis. The MEPS theory is applied to predict the most reactive (nucleophilic and electrophilic) sites in the title compound. Furthermore, the ChELPG and Mulliken population methods are used to establish the atomic charge distribution in PMDT. The frontier molecular orbitals (FMOs) as the prime determinants of the chemical activity and kinetic stability of the molecule were calculated in the framework of the time-dependent density functional theory (TD-DFT). In order to interpret the effect of solvation on the PMDT molecule, all the above electronic studies are determined using IEFPCM solvent effect model (water and DMSO).The temperature behavior was explored by the differential thermal analysis and thermogravimetry analysis (DTA/TGA). The electrical properties of PMDT were discussed. Finally, the new PMDT molecule was tested using the molecular docking calculation to disclose the modes of binding with target proteins. The results obtained show that the investigated compound acts as a potential antibacterial agent.
2 Experimental and computational methods
2.1 Materials and measurements
The 1,1,4,7,7-pentamethyldiethylenetriammonium trinitrate (PMDT) single crystal 0.4 × 0.35 × 0.3 mm in size with a molecular weight of 362.36 g ∙ mol−1 was investigated (Fig. 1a). The sample with the chemical formula C9H26N6O9 for the X-ray diffraction analysis had the form of a prism. The single-crystal X-ray analysis data on the PMDT compound were obtained on a CAD-4 EXPRESS diffractometer (Burkhardt et al., 1994) with a graphite monochromator (Ag Kα radiation, λ = 0.56083 Å) at 293 K. The structure was solved and refined in the SHELXS97 (Sheldrick, 2008) and SHELXL97 (Farrugia, 2012) software. The PMDT compound crystallizes in the triclinic centrosymmetric P
sp. gr. with lattice parameters of a = 5.964(2) Å, b = 7.018(1) Å, c = 21.688(2) Å, α = 91.90(2)°, β = 90.60(2)°, and γ = 102.45(3)°. The structure was plotted in the ORTEP (Ishizawa et al., 2013) and DIAMOND (Kamoun et al., 1991) software.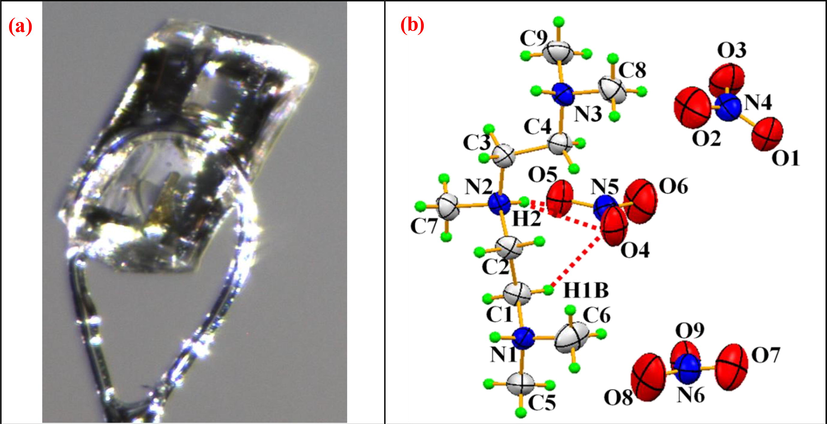
Photograph of a single crystal (a) and ORTEP representation of the geometric configuration of the constituent of C29H26N3(NO3)3 (b).
2.2 Synthesis of 1, 1, 4, 7, 7-pentamethyldiethylenetriammonium trinitrate
The PMDT compound was synthesized by mixing a solution of 3 mmol of HNO3 in 10 ml of water and a solution of 1 mmol of 1,1,4,7,7-pentamethylethylenetriamine in 10 ml of water. The mixture was stirred for 15 min and then kept at room temperature. After several days, a colorless PMDT single crystal was obtained.
2.3 Computational methods
In this study, the PMDT structure was optimized at the DFT/B3LYP/6–31++G(d, p) level of theory using the Gaussian package (Frisch et al., 2009) with the Chemcraft visualization software (Zhurko and Zhurko, 2005). The non covalent interactions were investigated using the topological analysis in the AIMALL package (AIMAll (Version 19.10.12), 2019). To further confirm the bonding property, the ELF and LOL methods based on the Multiwfn 3.8 wave function analysis program were used (Lu and Chen, 2012,33). In addition, to deeper understand the non covalent interactions in the crystal, we carried out the Hirshfeld surface analysis in the Crystal Explorer program (Wolff et al., 2012). The RDG, IGM, and IRI approaches were implemented with the Visual Molecular Dynamics (VMD) program (Karaca et al., 2015) and the Multiwfn software. Then, NBO analysis in the Gaussian package at the same level of theory was performed. The MEPS has been computed at the B3LYP/6–31++G(d, p) level of theory to estimate electrophilic and nucleophilic sites. In addition, the ChELPG and Mulliken atomic charges were calculated by the DFT(B3LYP)/6–31++G(d, p) method. To investigate the reactive sites, the electrical behavior, and types of reactions in molecular systems, the FOMs were estimated by the TD-DFT method. To investigate the reactive sites, the electrical and types of reactions of molecular systems, FOMs was evaluated by using the TD-DFT method in gas, and some polar liquids (water and DMSO). The density of states (DOS) was plotted in the GaussSum program (Boyle and Vos, 2005). The thermal analysis and investigations of the electrical behavior of C9H26N3(NO3)3 were also carried out. Finally, to predict the biological activity of the PMDT compound with the main antibacterial target proteins, the molecular docking was carried out using the iGEMDOCK software (Yang and Chen, 2004) and Discovery Studio Visualizer (Visualizer, 2005).
3 Results and discussion
3.1 X-ray diffractometry
X-ray diffraction analysis was the main technique used by us to obtain crystallographic data and perform crystal refinement of the compound. The results are given in Table S1. In Fig. 1.b, one can see an ORTEP representation of the C9H26N3(NO3)3 structure, which contains three independent nitrate groups NO3– and a 1,1,4,7,7-pentamethyldiethylenetriammonium (C9H26N33+) organic cation. The projection of this structure on to the PMDT
and
axes is shown in Figure S1. It can be seen in Figure S1.a that the organic cation and nitrate anions are linked by N—H…O and C—H…O hydrogen bonds, there by forming layers parallel to the (
,
) plane located at z = ¼ and z = ¾. The projection of the investigated crystal structure on to the
axis (FigureS1.b) shows that the inorganic anion developed in the (
,
) plane are grafted to the organic cation centered at × = ½. These two units (NO3– and C9H26N33+) are linked by N—H…O and C—H…O hydrogen bonds. The hydrogen bond interactions in 1,1,4,7,7-pentamethyldiethylenetriammonium trinitrate are summarized in Table 1. The hydrogen bond motif in the PMDT molecule is presented in Figure S2. The cohesion in the PMDT structure is ensured by two weak C—H…O and N—H…O hydrogen bonds. Three hydrogen bonds connect the organic group to oxygen atoms of the nitrate unit with donor acceptor distances ranging between 2.750(3) and 3.132(2) Å. We note that each hydrogen (H1, H2, and H3) has two acceptor atoms and one donor atom generating the R12(4) motif. Thus, the crystal structure under study is established to nitrate anions by three centers or bifurcated hydrogen bonds. The donor–acceptor distance averaged over nine C—H…O hydrogen bonds is 3.31 Å.Furthermore, according to the Brown's criterion (Brown and Wu, 1976), hydrogen bonds are considered weak at d (D…A) > 2.73 Å (at d (D…A) > 2.73 Å, a hydrogen bond is considered strong). Symmetry codes: (i) ×, y-1, z; (ii) x + 1, y-1, z; (iii) x-1, y, z; (iv) x + 1, y, z; (v) x-1, y-1, z.
D—H···A
D—H (Å)
H···A (Å)
D···A (Å)
D—H···A(°)
N1—H1···O7i
0.90(3)
2.14(3)
2.937(4)
147(2)
N1—H1···O9i
0.90(3)
2.04(3)
2.868(4)
153(2)
N2—H2···O4
0.87(3)
2.42(3)
3.134(4)
139(2)
N2—H2···O5
0.87(3)
1.90(3)
2.749(3)
162(3)
N3—H3···O1i
0.87(3)
2.00(3)
2.789(4)
149(3)
N3—H3···O3i
0.87(3)
2.28(3)
3.073(4)
152(3)
C1—H1A···O7ii
0.97
2.38
3.293(4)
156
C1—H1B···O4
0.97
2.45
3.232(4)
137
C2—H2B···O5iii
0.97
2.52
3.386(4)
149
C3—H3B···O1ii
0.97
2.44
3.308(4)
148
C4—H4A···O5iii
0.97
2.40
3.301(4)
155
C5—H5C···O8iv
0.96
2.40
3.305(5)
156
C7—H7A···O6v
0.96
2.42
3.295(4)
152
C8—H8A···O2iv
0.96
2.50
3.355(5)
149
C9—H9A···O2iv
0.96
2.53
3.377(5)
148
3.2 Vibrational study
The title compound was characterized in the solid state by using the FTIR spectrum. The experimental IR spectrum was measured between 500 and 4000 cm−1. Of the 12 theoretically planned modes, only 6 modes are active in IR. The IR absorption spectrum (Figure S3) of PMDT molecule shows 10 vibration bands in the frequency domain 1500–660 cm-1. We note for the vibrations of valence and deformation the presence of a band in addition to the expected number. An additional symmetric band observed in the vibration domain (υsNO3-) is due to the stretching vibrations δ(C—N). The additional anti-symmetric band observed in the domain (υasNO3-) corresponds to the deformation vibrations δ(CH3) in the symmetrical plane. The additional band noticed in the domain (δNO3-)can be attributed to the elongation vibrations ʋ(C—C) (Carbon skeleton, linear chain) and that in the domain (δNO3-)is due to the deformation vibrations in the δ(CH2) plane (swaying or roking). Also, the broadening of the spectrum (FigureS3.a) and the intense IR band (Figure S3.b) between 2696 and 2500 are assigned to C—H…O stretching mode.
3.3 Molecular geometry
The method and basis used in this study were selected using the calculated total energy. Therefore, the most stable structure with the minimum absolute value of the energy (E = -1363.84 a.u.) of 1,1,4,7,7-pentamethyldiethylenetriammonium trinitrate was obtained using the Gaussian software. To determine the ultimate structural parameters (bond length and bond angle) of the compound, we used the DFT(B3LYP)/6–31++G (d, p) hybrid method. The results obtained are given in Table S2 in comparison with the experimental data and presented graphically with numbering of atoms in Figure S4. It can be seen from the table that the theoretical values are very similar to the X-ray diffraction data. There are twenty-one C—H, nine N—C, nine N—O, four O—H, and three N—H bond lengths and one C—C bond length in the investigated molecule. The C—H bond lengths in the 1,1,4,7,7-pentamethylethylenetriammonium cation range within 0.959–1.515 Å. The N-C bonds lie between 1.491 and 1.504 Å (theory) and 1.476(5) −1.499 Å(experiment). The DFT-computed length of nine N-O bonds was found to be 1.223–1.319 Å, which agrees well with the XRD data (1.203–1.250 Å) for this bond. The observed O—H bond distances were 1.513 Å for H37-O45, 4.229 Å for H29-O42, 2.687 Å for H22-O50, and 4.268 Å for H21-O50. The DFT and XRD N1-H36, N2-H37, and N3-H38 bond lengths were found to be 1.132, 1.099, 1.122 Å and 0.90(3), 0.87(3), 0.87(3) Å, respectively. The maximum bond angle was observed for O40-N39-O42 (123.4, 117.7(3)°) and the minimum bond angle, for C20-H21-O50 (23.6°). Each organic entity is bound to nitrate anions through N—H…O and C—H…O hydrogen bonds. The calculated C—H…O and N—H—O bond angles range between [107.9–171.6]° and [114.8–31.7]°, respectively. These results show that the hydrogen bonding in the compound under study is weak. In Table S2, one can see the difference between several experimental and calculated parameters, which can be attributed to the fact that the theoretical computation was performed for the isolated molecule in the gas phase, which causes the deviation of the theoretical values from the XRD data obtained on the single crystal. In addition, we calculated the root-mean-square deviation (RMSD) to compare the theoretical geometric parameters with the experimental ones. A small RMSD value is generally preferred as it is indicative of a good fit to the data. Our results show that the computed parameters are in good agreement with the experiment.
3.4 Atoms-in-Molecule theory
At this stage of our study, we use the Bader’s AIM quantum theory to investigate the NCI in the PMDT compound. This approach based on the analysis of the topological properties of the charge density and its quality depends on a chosen computational level. To understand the interaction of hydrogen bonds, the topological parameters at bond critical points (BCPs) were determined in the AIMall calculation package. The electron density ρ(r) and its Laplacian ∇2ρ(r) play a vital role in verifying the strength and nature of chemical bonding (Harzallah et al., 2022). In addition, the kinetic energy density G(r), the total energy density H(r) [H(r) = G(r) + V(r)], the potential electron density V(r), the ellipticity ε, and the interaction energy Einteraction (Einteraction = V/2 (Noureddine et al., 2020) were used to elucidate the nature of hydrogen bonds (see Table 2). The parameter VBCP describes the ability of a system to concentrate electrons at the BCPs, the GBCP represents the tendency of electrons to spread out in space, and the parameter HBCP stands for the electron density and bonding types (Noureddine et al., 2020). Firstly, of all, to check the validity of the data on the bond characteristics, we considered the BCPs obtained at the hydrogen bonds in the PMDT molecule. The PMDT molecular graph consists of various spheres colored differently in Figure S5.Green and red spheres correspond to the BCPs and ring critical points (RCPs), respectively. It can see from Figure S5 and Table 2 that the compound under study contains hydrogen bonds of two types: C—H…O and N—H…O. The results obtained suggest that the C—H…O and N—H…O interactions are low-energy. The weakness of these bonds is confirmed by the positive Laplacian ∇2ρ(r) and the total energy density H(r) values. On the other hand, the positive ∇2ρ(r) values include the weak vdW interaction and hydrogen bond interactions. In addition, to describe rigorously the nature and strength of the hydrogen bond interactions in the PMDT molecule, we calculated the binding energy (BE).It was determined for the electron density ρBCP at the BCPs of hydrogen bonds using the following equation with a mean absolute percentage error (MAPE) of 14.7% (Emamian et al., 2019):
Interactions types
∇2ρ(r) (a.u)
ρ (r)
(a.u)
G(r) (a.u)
V(r)
(a.u)
H(r) (a.u)
ε
Einteractions kJ/mol
Binding energy (BE)
Monomer
N3-H38…O41
0.1302
0.0929
0.0641
−0.0956
−0.0315
0.0492
−29.99
−19.98
N2-H37…O45
0.1531
0.0782
0.0555
−0.0724
−0.0169
0.0500
–22.72
−16.70
N1-H36…O49
0.0174
0.0043
0.0035
−0.0026
0.0009
0.6915
−0.82
−0.22
C32-H35…O45
0.0200
0.0055
0.0014
−0.0032
−0.0018
0.0770
−1.05
−0.49
C4-H6…O44
0.0409
0.0119
0.0002
−0.0082
−0.008
0.2437
−2.57
−1.91
C24-H26…O49
0.0174
0.0043
0.0035
−0.0026
0.0009
0.6915
−0.82
−0.22
C7-H8…O49
0.0360
0.0095
0.0078
−0.0067
0.0011
0.4477
−2.10
−1.38
C10-H11…O42
0.0338
0.0090
0.0072
−0.0059
0.0013
0.6539
−1.85
−1.27
C13-H14…O42
0.1302
0.0929
0.0641
−0.0956
−0.0315
0.0492
−29.99
−19.98
C28-H30…O42
0.0267
0.0070
0.0056
−0.0045
0.0011
1.4705
−1.41
−0.82
C16-H18…O50
0.0277
0.0073
0.0056
−0.0046
0.001
0.9694
−1.44
−0.89
The hydrogen bond interaction types can be classified and characterized according to different aspects (Emamian et al., 2019). The BE values calculated for the interactions of different types are given in Table 2. In this study, all the bonds formed between N—H…O and C—H…O are classified as weak-medium. In the studied compound, the BE is higher than 2.5 kcal/mol but it is lower than 14 kcal/mol, that is why we can said that the H-bonds, in this compound, is an electrostatic interactions type (Medimagh et al., 2021; Agwupuye et al., 2021). Therefore, the AIM analysis clearly showed how the cation and anion layers are interconnect through weak N—H…O and C—H…O hydrogen bonds.
3.5 Electron localized function and Local orbital Locator analysis
To explore the NCI, we carried out the ELF and LOL topological analyses. These tools are widely used to establish the atomic shell structure and classify chemical bonding on molecular surfaces (Noureddine et al., 2020). The ELF and LOL pictures were created using the Multiwfn wave analyzer package. These methods are based mainly on the localization of electrons in the Lewis structure. The ELF and LOL images for the investigated molecule are presented in the form of color shade maps and contour maps in Fig. 2. The blue-to-red color scale reflects the values from 0 to 1 for the ELF image, while the LOL scale ranges from 0 to 0.8. The red color around hydrogen atoms H11, H5, H17, and H38 in Fig. 2.a with the high ELF value shows the presence of bonding and nonbonding electrons. The blue color around few carbon and nitrogen atoms shows the area where the electron is expected to be delocalized. It can be seen in Fig. 2.b that the central region of a hydrogen atom is white; i.e., the electron density exceeds the color scale upper limit (0.8). The red area near hydrogen atoms H11, H17, and H5 indicates that the maximum LOL value is related to the covalent bonds between the atoms. In addition, the large blue values between the atoms of organic and inorganic groups highlight the presence of weak C—H…O and N—H…O hydrogen bonds. Thus, the ELF and LOL data are consistent with the results of the XRD and AIM study.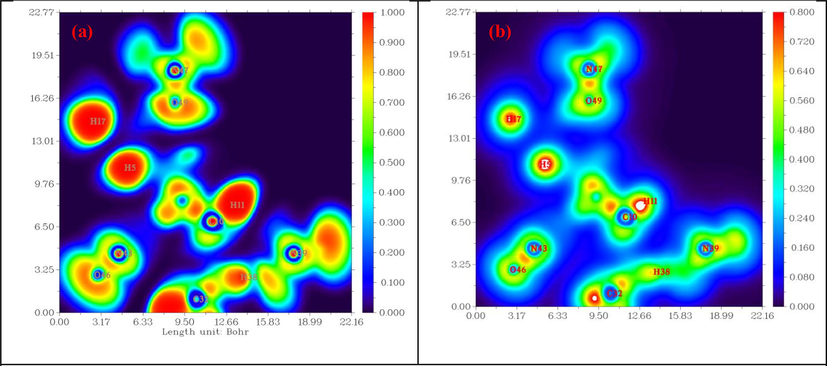
Plotting maps of: (a) ELF and (b) LOL of the PMDT.
3.6 Hirshfeld surface analysis
The Hirshfeld surface analysis is a graphical method, which was used by us to study and visualize inter- and intramolecular interactions within the crystal packing of the PMDT compound. In this study, we attempted to obtain more information about the NCI in the crystal structure using the Crystal Explorer program. Figure S6 illustrates the asymmetric unit (Figure S6.a), mapped molecular Hirshfeld area at dnorm from −0.560 to 1.192 (Figure S6.b), and full 2D plot of C9H26N3(NO3)3 (Figure S6.c). Different data on hydrogen bonds discussed in the X-ray Diffractometry Section are efficiently summarized in the dnorm mapping. Several dark-red circular spots in this map are related to the dominant contribution of the O…H/H…O contacts in the Hirshfeld surface plots; these spots correspond to the N-H…O and C—H…O hydrogen bonds. Other (blue and white) spots in this map are related to the H…H contacts. The dnorm mapping shown in Figure S7 gives a general overview of some hydrogen bonds involved in the maintenance and stability of the investigated crystal structure. In addition, we calculated the electrostatic potentials using the Tonto and mapped it on the Hirsheld surface using the STO-3G base fixed at the Hartree-Fock theory level over a range of ± 0.27 a.u. (Figure S8). Indeed, the donor atoms of hydrogen bonds are presented by the positive electrostatic potential (blue regions), while the acceptor atoms are presented by the negative electrostatic potential (red regions). Figure S9 illustrates the 2D fingerprint plot distribution for the C9H26N3(NO3)3 compound. The distribution shows that the O…H/H…O intermolecular contacts occupy 70.4% of the entire Hirschfeld surface and appear as two symmetrical wings with a large, long point of the sum de + di ∼ 1.8 Å smaller than the sum of the vdW radii of hydrogen (1.09 Å) and oxygen (1.52 Å) atoms. The H…H contacts occupy almost ¼ (23.7%) of the entire Hirschfeld surface; they can be seen in the fingerprint plot as a distinct tip with di = de = 1.2 Å, which is greater than the vdW radius of the hydrogen atom (1.09 Å). Indeed, the organic part has a large number of hydrogen atoms (SH = 60.4%) on its molecular surface, while carbon atoms are rarely met on it (SC = 0%), because they conventionally form four bonds with other atoms. The rest N…H/H…N, O…O, and N…O/O…N contacts occupy 3%, 1.9%, and 1% of the Hirschfeld surface, respectively. The intermolecular interactions in the investigated crystal were evaluated using the ratio of enrichment (RE), a new descriptor based on the Hirschfeld surface analysis. The REs of intermolecular contacts involved in the C9H26N3(NO3)3asymmetric unit are given in Table S3.
3.7 Reduced density gradient analysis
To obtain more information about the bond interactions, we applied the RDG analysis, a well-known computational tool for exploring non covalent interactions in molecular systems (Medimagh et al., 2021). The RDG is a color scaling of interactions: the surfaces are colored in blue (hydrogen bonding), green (vdW interaction), and red (steric effect).These interactions are based on the electron density property. The RDG and sign (λ2)ρ plots for the molecule under consideration were built using the Multiwfn and VMD software. In our case, different interactions were disclosed in the PMDT monomer form (Fig. 3). The analysis of the plots revealed three sites of interactions. The light-blue isosurfaces are identified between the organic and inorganic units and characteristic of weak (C—H…O and N—H…O) interactions. The blue contour in the RDG scatter plot around −0.020 a.u. indicates the strong attraction between the C—H…O and N—H…O hydrogen bonding interactions. In addition, one can see the mixed red-green color near the nitrate anion and 1,1,4,7,7-pentamethylethylenetriammonium cation. In the RDG scatter spectra, the mixed red-green spikes between 0 and 0.015 are indicative of the hydrogen bonding and C—H…π interaction. The results of the RDG analysis confirm the hydrogen bonding interactions in the PMDT molecular structure.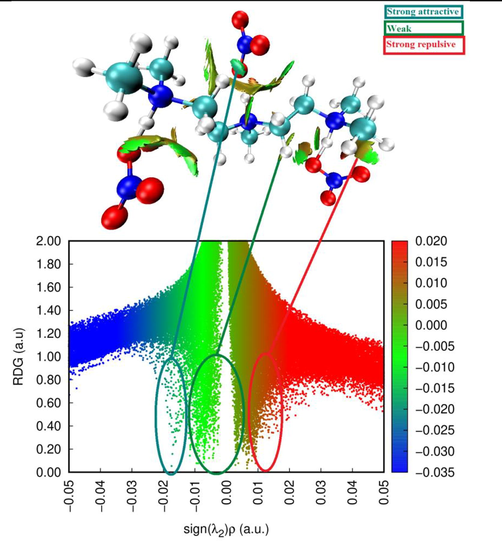
RDG images of C9H26N3 (NO3)3.
3.8 Independent gradient model
At this stage, we used the IGM to analyze the weak intra- and intermolecular interactions. The IGM analysis is a clearly comprehensible and physically meaningful approach for visualizing the hydrogen bonding and vdW interactions (Medimagh et al., 2021). Fig. 4.a presents the 2D colored map of the sign(λ2)ρ function on the δg isosurface plotted in the Multiwfn and VMD packages. The δg versus sign(λ2)ρ scatter plot was used to reveal and distinguish the attractive, repulsive, and vdW interactions. The blue, red, and green areas in the scatter maps correspond to the strong interaction, weak interaction, and repulsion, respectively. There are three peaks (peak 1, peak 2, and peak 3) in the sign (λ2)ρ rangefrom-0.05 to 0.05. Peak 1 is a fuzzy greenish-blue peak located at sign(λ2)ρ ≈-0.02 and pointing out the presence of a weak hydrogen bond. Around the sign(λ2)ρ values of-0.01 and 0.015, green peaks 2 and 3 are observed. Since these sign(λ2)ρ values are close to zero, the peaks are indicative of the vdW interaction. Thoroughly analyze the intra- and intermolecular interactions, we explored strong and weak interactions in the investigated molecule by the IGM method using a wave function scheme presented in Fig. 4.b. This scheme allowed us to detect and calculate the total electron density gradient attenuation caused by the inter atomic interaction. As can be seen in Fig. 4.b, all the chemically bound regions have the larger δg (above 0.2) values (white areas). The red area around hydrogen and nitrogen atoms reflects the high electron density.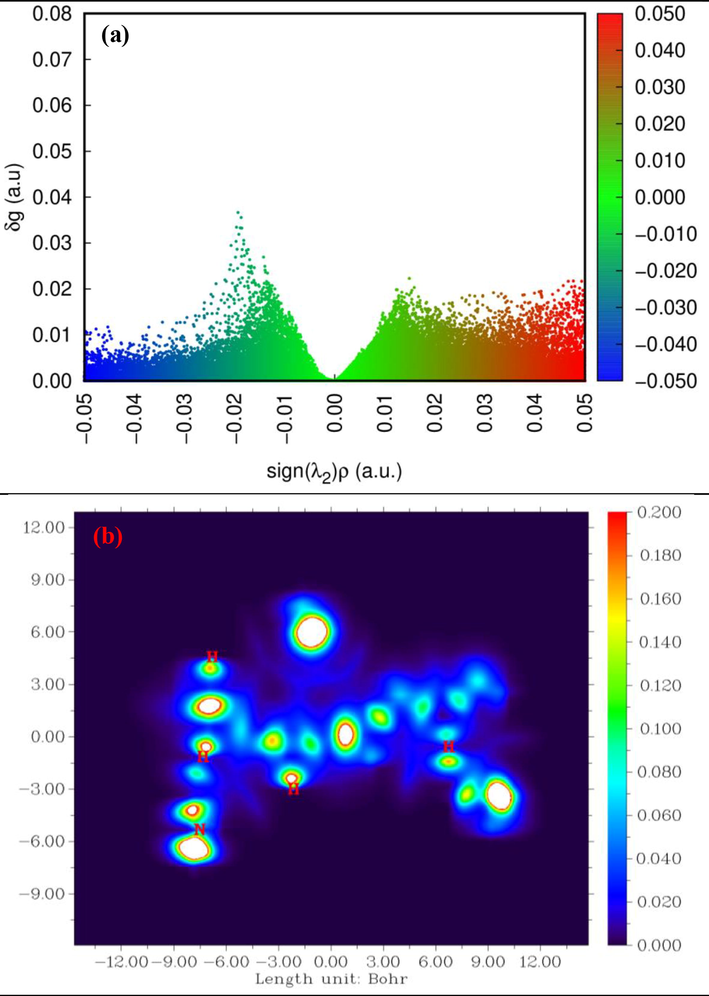
(a) isosuface scatter plot of δg vs sign (λ2)ρ and (b) plotting plane map of PMDT.
3.9 Interaction region indicator analysis
In this study, we used the IRI method to map and analyze weak-interaction regions in the investigated molecule. The IRI is a new real-space function, which can identify all kinds of interactions in chemical systems simultaneously (Sagaama et al., 2021).The IRI differs from the RDG by a constant factor (an adjustable parameter), which plays a vital role in balancing between the covalent and NCI. The IRI equation is
This is a very simple function, which only depends on the electron density and its gradient. Similar to the RDG and IGM methods, the sign(λ2)ρ function on an IRI isosurface is plotted to distinguish the attractive (hydrogen bond), repulsion (steric effect), and vdW interactions. In Fig. 5, the IRI isosurface map and the scatter map between the IRI and sign (λ2)ρ function of the PMDT compound are presented. In Fig. 5.a, we can see several green spots between the organic and inorganic compounds, which correspond to the vdW interaction. In addition, the light-blue color reflect the presence of hydrogen bond interaction between the C–H group of the (C9H26N3)3+ cation and the oxygen atom of the (NO3–) anion. IRI isosurfaces indicate that the carbon–carbon covalent bond were established and characterized by blue color. The scatter map between the IRI and sign (λ2)ρ in Fig. 5.b makes it possible to establish the IRI distribution character. Four spikes in the scatter map correspond to the IRI minimum. The spikes at sign (λ2)ρ = -0.258, 0.250, and −0.100 a.u. correspond to │
│=0 and │
│=0. This verifies the correlation between the IRI map and AIM analysis data (Lu and Chen, 2021). On the other hand, the spike around sign (λ2)ρ = 0 corresponds to│
│≠ 0 and │∇IRI│=0, i.e., to weak intermolecular interactions.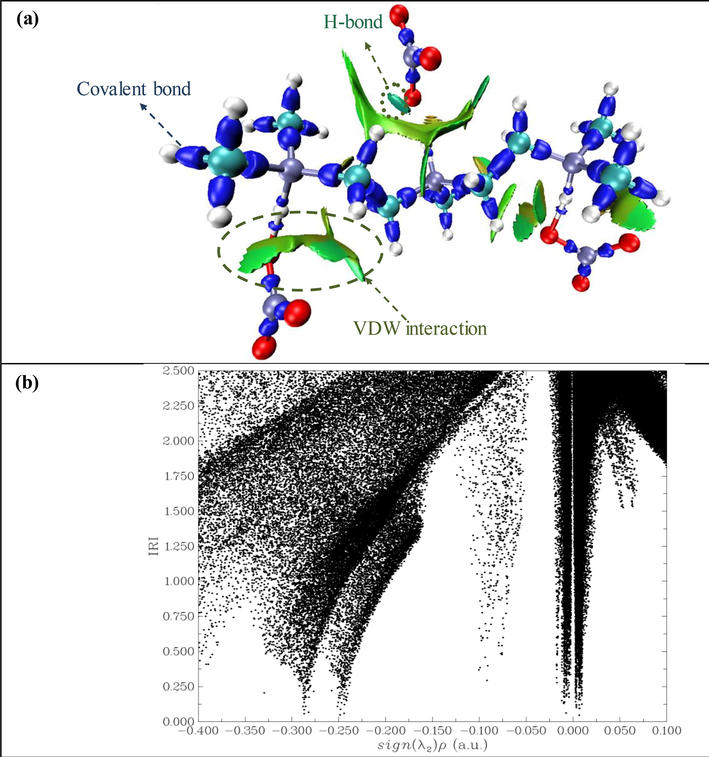
Same maps of PMDT: (a) isosurface map of IRI,(b) scatter map between IRI and sign(λ2)ρ.
3.10 Natural bond orbital analysis
The NBO analysis known as an efficient tool for studying intra and intermolecular interactions between bonds. It provides a convenient basis for exploring charge transfer within a molecule (Kazachenko et al., 2021). This later was used to disclose possible bonding interactions between donor and acceptor atoms in the PMDT compound. We carried out the NBO analysis of the investigated compound at the DFT(B3LYP)/6–31++G(d, p) level of theory. The data on the second-order energy E(2) for weak interactions in the PMDT molecule are given in Table S4. Hydrogen bonds are believed to be caused by charge transfer from the lone-pair (LP) orbital’s to antibonding σ*(X-H) ones. In addition, the interaction energy significantly affects the strength of a hydrogen bond. The most significant energy interactions between the donor and acceptor NBOs were found forLP2 (O41) → σ*(N3-H38), LP2 (O45) → σ*(N2-H37), and LP2 (O49) → σ*(N1-H36), which results in the enormous stabilization of energies of 81.76, 66.58, and 89.58 kcal/mol, respectively. This means that the N–H…O interaction makes a considerable impact on the crystal packing in the investigated compound. Similarly, the weak NBO interactions LP3 (O44) → σ*(C13-H15) and LP2 (O44) → σ*(C13-H15) suggest the existence of C–H…O hydrogen bonds, which have a higher stabilization of energies of 3.02 and 1.63 kcal/mol, respectively. In addition, it was demonstrated that N–H…O and C–H…O hydrogen bonds contribute to the stabilization of the 1,1,4,7,7-pentamethyldiethylenetriammonium trinitrate compound.
3.11 Molecular electrostatic potential surface analysis
In this section, we have effected a molecular electrostatic potential analysis to predict the chemical reactivity of our molecule. This method is related to the electron density and is a very useful descriptor for understanding the electrophilic and nucleophlic sites as well as hydrogen bonding interactions (Issa et al., 2020). The MEPS was mapped to a different range of colors varied from red (negative potential region) to blue (positive potential regions) as shown in Figure S10. The MEPS plot is generated using the same level of theory DFT with B3LYP/6–31++G(d, p) basis set in the gas phase and with various solvation (water and DMSO). The color code of the compound lies in the range of 6.734e-2 to −6.734e-2 a.u. The examination of all MEPS: in gas, in water and in DMSO solvent, shows that the most negative potential region (red color) are localized over around the oxygen atoms of the trinitrate units (inorganic group).It can be seen that the most negative potential region (red) is localized around oxygen atoms of the trinitrate units (the inorganic group). This region should contain the sites favorable for the possible electrophilic reactivity and point to the electron rich region. Similarly, the most positive sites (blue) are localized mainly around C9H26N3+(i.e., around hydrogen atoms), which point to electron deficient sites and the sites more reactive for the nucleophilic attack. According to the electrostatic potential surface analysis results reported in (Harzallah et al., 2022), the hydrogen bond identified as a donor–acceptor interaction. It proves the fact that the electrostatic potential of the donor becomes less negative as the acceptor becomes more negative. It can see in Figure S10 that hydrogen atoms act as acceptors and oxygen and nitrogen atoms, as donors. Thus, the MEPS analysis confirmed the existence of C—H…O and N—H…O hydrogen bonds in the structure of the investigated molecule.
3.12 ChELPG electrostatic population and Mulliken atomic charges
Atomic charges of molecular systems calculated by several available methods, including the Mulliken population analysis and the ChELPG scheme. These methods were used to describe the electron charge distribution in a molecule. The analysis of a partial atomic charge helps one to identify donor and acceptor sites of molecular systems (Sagaama and Issaoui, 2020). The Mulliken population analysis describes the electron charge distribution in a molecule, while the ChELPG method is based on fitting of the molecular electrostatic potential (MEP) (Sarala et al., 2021). The results of the computations in the Multiwfn package (Patel et al., 2004) are given in Table S5. It is noteworthy that the Mulliken atomic charge and ChELPG data are very similar, except for some cases, which evidences for the efficiency of the method used. Both methods showed that all hydrogen atoms in the PMDT molecule are positively charged. This was obvious from the discussion of the MEPS data (see Section 3.10), which pointed out the electron deficient sites (the blue region) on hydrogen atoms. The charges in the ChELPG scheme are negative for all carbon atoms, except for C7 (-0.375 a.u.) and C10 (-0.232 a.u.), which interact with the positively charged atoms (H8, H10). Meanwhile, the Mulliken population analysis showed that the charges of carbon atoms have negative values. Furthermore, the charges of all oxygen atoms are negative, except for O44 (0.066 a.u.) and O45 (0.050 a.u.), which are charged positively in the Mulliken charge analysis and negatively according to the ChELPG scheme. The highest negative charge on oxygen, nitrogen, and carbon atoms is indicative of the formation of intermolecular interactions with hydrogen atoms (the formation of hydrogen bonds).
3.13 HOMO-LUMO calculation
The frontier molecular orbital (FMOs) analysis play a vital role in exploring the kinetic stability, conductivity, electrical proprieties and chemical reactivity of molecular structure (Medimagh et al., 2021). The band gap defined as the difference between HOMO and LUMO that explains the stability of the molecule. The HOMO is noted as a nucleophile that donates electrons, whereas LUMO act as an electrophile that accepts electrons. In this light, we performed a calculated quantum chemical descriptors of PMDT compound at DFT/B3LYP/6–31++G(d, p) level of theory in gas, water and DMSO solvation (Table S6). The distribution and the energy gap of these orbital's was illustrated in Figure S11. It is clear from this figure; the red color indicates the positive phase, while the green color indicates the negative phase. As shown also that the HOMO and LUMO are entirely localized on the nitrates groups with a small contribution of a few carbon and nitrogen atoms of organic unit. The gap energy is critical parameters to determine the stability and the chemical reactivity of the studied molecule. A hard molecule is characterized by a large HOMO-LUMO gap while a soft with a small gap (Kazachenko et al., 2021). In addition, the ΔEHOMO-LUMO measures the excitability of the molecule, the weaker the energy, more easily it can be excited and inversely. Not only, has a large/small gap indicated high/low stability and low/high chemical reactivity (Medimagh et al., 2021), respectively. As shown in Table S6, other parameters such as chemical potential (μ), global electrophilicity index (W), global hardness (η) and softness (S) can also describe the stability and reactivity of a compound. In the present case, the energy gap (ΔE) value is equal to 5.40 eV (in gas), 5.79 eV (in DMSO) and 5.82 eV (in water). We noted that there is not a big difference between the energy gap values in water, DMSO and in gas. This will demonstrate the intra molecular charge transfer and molecule stability also during solvation. Furthermore, the electrophilicity (w) is greater than two in gas and various liquids. This explains that our molecule is strong electrophile and contributes easily in polar process. The maximal amount of electronic charge Qmax is calculated in water (1.56 eV), DMSO (1.59 eV) and gas (1.60 eV). This parameter is used to describe the propensity of the system to acquire additional electronic charge from the environment. We remark from Table S6, that Qmax (gas) > Qmax (DMSO) > Qmax (water). This result indicates that PMDT compound in gas phase is more prone to receive extra electronic charge that under the effect of solvation.
-
Density of States Spectrum Analysis
The DOS spectrum was obtained in the GaussSum program to calculate contributions of the groups to the HOMO and LUMO. The DOS spectrum analysis provides information important for predicting the nature of interactions between different groups (Fradi et al., 2021; Medimagh et al., 2021). The positive DOS value is related to the bonding interactions, while the negative and zero values correspond to the antibonding and nonbonding ones, respectively. The pictorial illustration of DOS for the PMDT compound in various solvation (water and DMSO) and in the gas phase, shown in Figure S12. From the DOS picture, the green and red color lines explain HOMO (EH) and LUMO (EL) levels, respectively. In addition, the DOS indicates the energy gap ΔE of the title compound PMDT at the same level of theory. We noted form this figure that the values of the HOMO, LUMO and the energy gap │ΔEHOMO-LUMO│are comparable with the values obtained by the DFT calculation. In DOS picture, we note that the values of the energy gap are close in gas and under the effect of solvation. Further, the values of the energy gap are large (>3 eV) implies a high kinetic and thermodynamic stability of our compound PMDT (Zhang et al., 2010).
3.14 Temperature behavior of the C9H26N3(NO3)3Compound
3.14.1 Differential thermal and thermogravimetric analysis of the C9H26N3(NO3)3 compound
The DTA/TGA curves for 1,1,4,7,7-pentamethylethylentriammonium trinitrate were built for the sample with a weight of m = 29.13 mg in the argon atmosphere upon heating from room temperature to 773 K at a rate of 10 K ∙ min-1 (Figure S13). The DTA curve shows that the material under study decomposes in the two similar stages:
(i)The first exothermic peak appears in the TGA curve around 415 K and corresponds to a significant weight loss. This peak reflects the first decomposition stage. At this stage, proton transfer between the cationic and anionic parts occurs at high temperatures, which causes an internal redox reaction between the amine and nitric acid (Scheme 1). The proton transfer to NO3- anions is related to the weakness of N–H bonds in the condensed phase at high temperatures (Gatfaoui et al., 2019).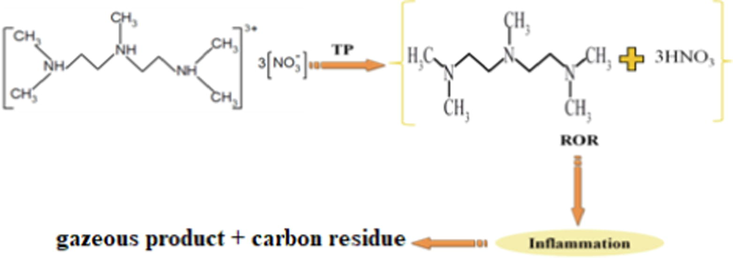
Decomposition of PMDT. TP: Proton transfer, MMR: Redox reaction.
(ii) The second exothermic peak centered at 544 K corresponds to the rest part of the decomposition process:
3.14.2 Differential scanning calorimetry analysis of the C9H26N3(NO3) 3 compound
The differential scanning calorimetry (DSC) study was carried out on the compound heated from 298 to 575 K at a rate of 5 K ∙ min-1 in the argon atmosphere (see the DSC curve in Figure S14). One can see the same number of peaks corresponding to the phenomena observed above by the DTA/TGA methods.
3.15 Study of the ionic conductivity of the C9H26N3(NO3)3 compound
The imaginary part Z’’ of the complex impedance as a function of its real part Z’ was explored at temperatures from 298 to 373 K. In Fig. 6.a, the experimental points form arcs of a circle passing in the proximity of the origin of coordinates and centered below the real axis. The values of resistance R at different temperatures are determined by the intersection of the Nyquist diagram and the × axis. An increase in temperature is accompanied by a gradual decrease in the resistance. Figure S15 shows the conductivity evolution upon temperature variation. The conductivity values for the compound obtained at different temperatures are given in Table S7. Figure S15 shows the Ln(σT) = f(103/T) plot, which is a straight without breaks consistent with the Arrhenius law with an activation energy of Ea = 0.26 eV. The conductivity data were confirmed by the thermal investigations, which revealed no thermal accidents in this temperature range. Fig. 6.b and 6.c illustrate the changes in the Z’ and Z’’ values upon frequency variation at different temperatures. It can be seen in Fig. 6.b that, at low frequencies, the Z’ values are almost invariable. Starting with a certain frequency, Z’ slowly decreases and tends asymptotically to zero at high frequencies. Similarly, Z’ decreases with increasing temperature. Fig. 6.c shows that, in the spectrum Z’’= f (logf), the peaks (ωmax, Z’’max) appear, the intensity of which decreases with increasing temperature. These peaks reflect the electrical relaxation phenomenon. They shift toward higher frequencies as the temperature increases; i.e., the relaxation phenomenon depends on temperature (Ouerghi, 2018; Wacharine et al., 2007). Figures S16.a and S16.b show the real and imaginary parts ε’ and ε’’ of the permittivity as functions of temperature and frequency. It is noteworthy that the ε’and ε’’values decrease with frequency at different temperatures. This results show that strong permittivity dispersion are observed with increasing temperature. In addition, as the frequency increases, these two dielectric characteristics decrease, this can be explained by the fact that dipoles existing in the system cannot quickly reorient to follow the frequency of the electric field at which the polarization orientation stops (Wang et al., 2021; Gatfaoui et al., 2017). On the other hand, the high ε’and ε’’values at low frequencies point out the existence of the electron polarization (Elwej et al., 2015; Hajlaoui et al., 2015).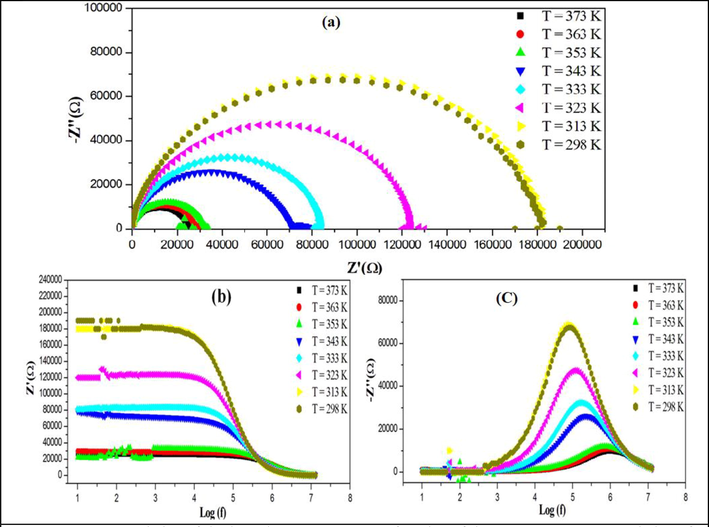
(a) Evolution of the impedance spectra as a function of the temperature, (b) Variation of the real part Z’ and (b) the imaginary part Z’’ depending on the frequency at different temperatures.
4 Molecular docking
The molecular docking approach is intended to examine possible binding orientations and elucidate molecular mechanisms for ligands at the active sites of target proteins. At this investigation stage, we established the biological activity of the investigated compound. As was reported in the literature (Patel et al., 2007), the PMDT molecule plays an important role in the antimicrobial treatment. The molecule under study was docked with different bacterial species to establish the mode of their inhibition. Five target proteins used were two Gram-positive bacteria S. aureus (PDB ID: 4GXO) and E. faecalis (PDB ID: 6QXS) and three Gram-negative bacteria E. coli (PDB ID: 1AJ0), P. aeruginosa (PDB ID: 1U1Z), and K. pneumoniae (7BYE).The X-ray crystal structure of the bacteria proteins was retrieved from the RCSB protein data Bank [45].The docking calculation made to predict the binding interactions of the PMDT molecule chosen as a ligand with the antibacterial protein. The docking data for the PMDT compound with the active sites of different antibacterial proteins are listed in Table 3. The best docked poses for each protein–ligand complex related to the minimum energies are presented in Fig. 7.According to the data given in Table 3, the vdW interaction prevails. In addition, the results of the docking calculation showed that the PMDT-1U1Z complex has the highest total energy: Etot = -99.42 kcal/mol. The inhibition value for this protein is even better than the values of the other proteins. 1AJ0 has the highest vdW value (-59.71 kcal/mol), but the lower value for the hydrogen bond (EH-B = -34.76 kcal/mol).The binding interaction of the PMDT ligand with the 4GXO receptor has the lowest total energy score (-89.83 kcal/mol) among all the complexes. In addition, it has the smallest values of the vdW (-46.02 kcal/mol) and electronic binding interaction (0.88 kcal/mol).At the same time, 7BYE has a total energy of-92.87 kcal/mol and forms the strongest hydrogen bonding and electronic binding interaction (-49.64 and 3.56 kcal/mol, respectively). The same is valid for 6QXS, which total energy is −97.78 kcal/mol.
-
Ligand binding analysis
| Ligand | Proteins | Total energy | VDW | H-bond | Electronic |
|---|---|---|---|---|---|
| Bacterial proteins | |||||
| PMDT | 4GXO | −89.83 | −46.02 | −44.70 | 0.88 |
| 6QXS | −97.78 | −52.19 | −47.47 | 1.88 | |
| 1AJ0 | −94.92 | −59.71 | −34.76 | −0.45 | |
| 1U1Z | −99.42 | −54.79 | −47.39 | 2.75 | |
| 7BYE | −92.87 | −46.79 | −49.64 | 3.56 | |
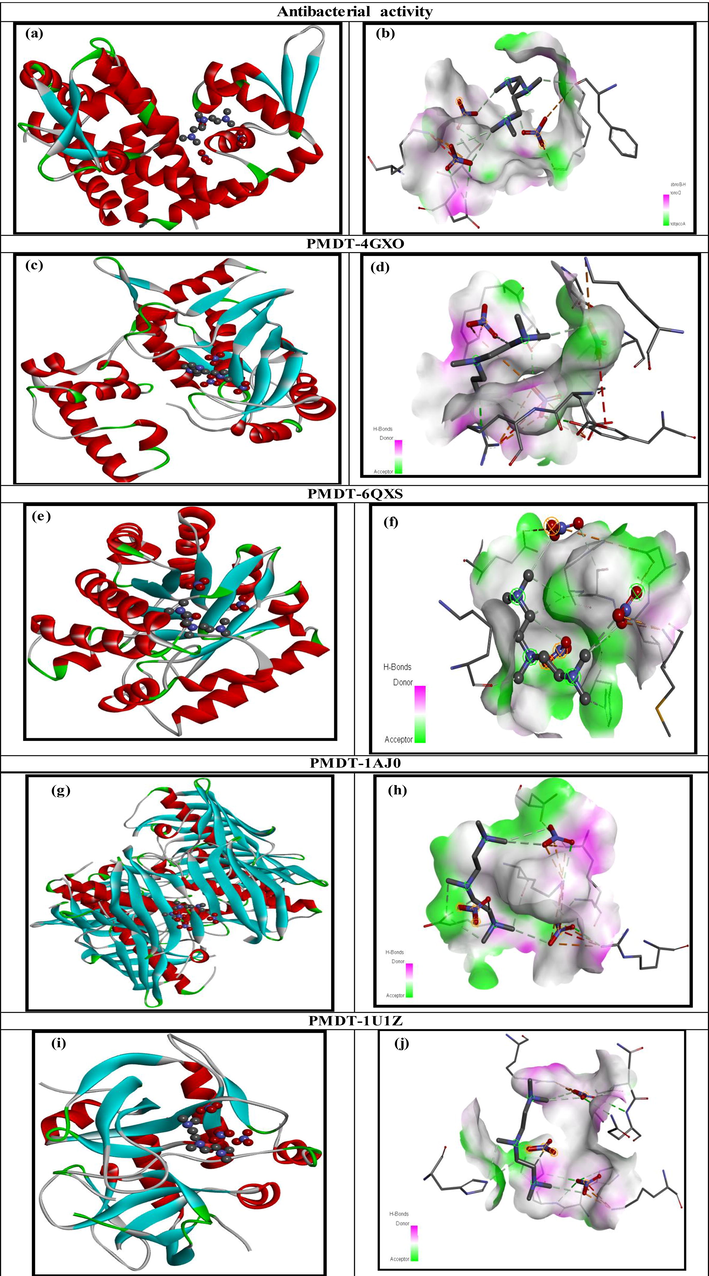
- Best docked post (left) and H-Bond interactions (right) of ligand PMDT with various bacterial proteins.
To further explore the mode of binding between different proteins and the PMDT ligand, we built the 2D diagrams (Fig. 7).The data on the docking interactions are summarized in Table S8.The binding interaction mode of the PMDT-4GXOcomplex owing to two attractive charge interactions with A:LYS21 and A:LYS32 with bond lengths of 5.37 and 4.17 Å, respectively. Two conventional hydrogen bonds linked with A:THR28 (2.87 Å) and A:ASN29 (2.68 Å) and one hydrogen bond were involved with the Z:PRE999 (3.28 Å) residues. Several interactions with the PMDT-6QXS complex were revealed(see Table S8 and Fig. 7.d), among which are the four attractive charge interactions between the NZ, NH2, NH1, N4, and N6 atoms of the D:LYS19, D:ARG22, D:ARG217 and Z:PRE999 binding residues. In addition, three carbon-hydrogen bond interactions are linked with A:ARG22, D: SER218, and D: TYR260withbond lengths of 2.79, 2.60, and 2.59 Å, respectively. The two other hydrophobic interactions were Pi-cation and Pi-anion. Concerning the 1AJ0 protein, the amino acid residues A: MET1, Z:PRE999, A:HIS14, and Z:PRE999 were found to be involved in the formation of the attractive charge and carbon hydrogen bond with distances of 3.07, 5.01, 3.50, and 3.36 Å, respectively. For the 1U1Z and 7BYE proteins, the same ligand-residues interactions and amino acids were involved. Thus, the results obtained are promising for further discovery of drugs. We can draw a conclusion that the PMDT compound can serve as a good inhibitor of the microbial activity.
5 Conclusions
In this study, it was found that the PMDT molecule has the most stable structure by using DFT(B3LYP)/6–31++G(d, p) method. The calculated parameters (bond length and angles) are in good agreement with the experiment. In fact, the DFT associated to the 6–31++G(d, p) basis set is most affordable method of obtaining reasonably reliable and useful precision on our molecule. In addition, we explore in more detail the NCIs existed within our PMDT compound by using the topological analysis such as AIM, ELF, and LOL. The AIM analysis at the BCPs of hydrogen bonds showed that the organic and inorganic group is interconnected through weak N—H…O and C—H…O interactions. The ELF, LOL, Hirshfeld surface, RDG, IGM, and IRI data confirmed the existence of the hydrogen bonding interactions. The NBO analysis showed that N—H…O and C—H…O hydrogen bonds contribute to the stabilization of 1,1,4,7,7-pentamethyldiethylenetriammonium trinitrate. Using the MEPS and HOMO-LUMO energy levels, different PMDT reactive sites were distinguished. The temperature and electrical behavior of the C9H26N3(NO3)3 was explored in the present work. Finally, the molecular docking method showed that the PMDT compound exhibits a significant antibacterial activity.
Acknowledgements
This work were supported by the Tunisian National Ministry of Higher Education and Scientific Research and Researchers Supporting Project number (RSP2023R61), King Saud University, Riyadh, Saudi Arabia.
Declaration of Competing Interest
The authors declare that they have no known competing financial interests or personal relationships that could have appeared to influence the work reported in this paper.
References
- Electronic structure investigation of the stability, reactivity, NBO analysis, thermodynamics, and the nature of the interactions in methyl-substituted imidazolium-based ionic liquids. J. Mol. Liq.. 2021;337:116458
- [CrossRef] [Google Scholar]
- A New Insight into Non-covalent Interactions in 1, 4-Disubstituted 1H–1, 2, 3-Triazole: Synthesis, X-ray structure, DFT calculations, in vitro Lipoxygenase Inhibition (LOX) and in silico Studies. J. Mol. Struct.. 2021;1236:130283
- [CrossRef] [Google Scholar]
- AIMAll (Version 19.10.12), Todd A. Keith, TK Gristmill Software, Overland Park KS, USA, 2019 (aim.tkgristmill.com).
- GaussSum. Version. 2005;1.0. 5
- Empirical parameters for calculating cation–oxygen bond valences. Acta Crystallogr. Sect. B: Struct. Crystallogr. Cryst. Chem.. 1976;32(7):1957-1959.
- [CrossRef] [Google Scholar]
- Structure refinement of the iron–aluminium phase with the approximate composition Fe2Al5. Acta Crystallogr. B. 1994;50(3):313-316.
- [CrossRef] [Google Scholar]
- Temperature- and frequencydependent dielectric properties of organic-inorganic hybrid compound: (C6H9N2)2(Hg0.75Cd0.25)Cl4. Mater. Res. Bull.. 2015;62:42e51.
- [CrossRef] [Google Scholar]
- Exploring nature and predicting strength of hydrogen bonds: a correlation analysis between atoms-in-molecules descriptors, binding energies, and energy components of symmetry-adapted perturbation theory. J. Comput. Chem.. 2019;40(32):2868-2881.
- [CrossRef] [Google Scholar]
- WinGX and ORTEP for Windows: an update. J. Appl. Cryst.. 2012;45(4):849-854.
- [CrossRef] [Google Scholar]
- New DMAP meso-arylporphyrin Magnesium (II) complex. Spectroscopic, Cyclic voltammetry and X-ray molecular structure characterization. DFT, DOS and MEP calculations and Antioxidant and Antifungal activities. J. Mol. Struct.. 2021;1236:130299
- [CrossRef] [Google Scholar]
- Gaussian 09, Revision C.01. Wallingford CT: Gaussian, Inc.; 2009.
- Synthesis, structural and spectroscopic features, and investigation of bioactive nature of a novel organic-inorganic hybrid material 1H–1, 2, 4-triazole-4-ium trioxonitrate. J. Mol. Struct.. 2017;1150:242-257.
- [CrossRef] [Google Scholar]
- A proton transfer compound template phenylethylamine: synthesis, a collective experimental and theoretical investigations. Journalof Molecular Structure. 2019;1191:183-196.
- [CrossRef] [Google Scholar]
- Electrical transport properties and modulus behavior of the organiceinorganic [N(C3H7)4]2SnCl6 compound. Phys. B.. 2015;474:90e96.
- [CrossRef] [Google Scholar]
- Synthesis, X-ray crystal structure, Hirshfeld surface analysis, DFT, AIM, ELF, RDG and molecular docking studies of bis [4-(dimethylamino) pyridinium] di-µ-chlorido-bis [dichloridomercurate (II)] J. Coord. Chem.. 2022;74(17–20):2927-2946.
- [CrossRef] [Google Scholar]
- Redetermination of Nd2Ti2O7: a non-centrosymmetric structure with perovskite-type slabs. Acta Crystallogr. Sect. E: Struct. Rep. Online. 2013;69(4):i19-i.
- [CrossRef] [Google Scholar]
- Computational study of 3-thiophene acetic acid: Molecular docking, electronic and intermolecular interactions investigations. Comput. Biol. Chem.. 2020;86:107268
- [CrossRef] [Google Scholar]
- Structure du propanediammonium-1, 3 monohydrogénomonophosphate monohydrate. Acta Crystallogr. C. 1991;47(1):117-119.
- [CrossRef] [Google Scholar]
- Conformational analysis, spectroscopic study (FT-IR, FT-Raman, UV, 1H and 13C NMR), molecular orbital energy and NLO properties of 5-iodosalicylic acid. Spectrochim. Acta A Mol. Biomol. Spectrosc.. 2015;136:295-305.
- [CrossRef] [Google Scholar]
- Sulfation of Diethylaminoethyl-Cellulose: QTAIM Topological Analysis and Experimental and DFT Studies of the Properties. ACS Omega. 2021;6(35):22603-22615.
- [CrossRef] [Google Scholar]
- Multiwfn: a multifunctional Wavefunction analyzer. J. Comptu. Chem. 2012,33,:580e592.
- [CrossRef] [Google Scholar]
- Interaction Region Indicator: A Simple Real Space Function Clearly Revealing Both Chemical Bonds and Weak Interactions. Chemistry-Methods. 2021;1(5):231-239.
- [CrossRef] [Google Scholar]
- Molecular modeling and biological activity analysis of new organic-inorganic hybrid: 2-(3, 4-dihydroxyphenyl) ethanaminium nitrate. Journalof King Saud University-Science. 2021;33(8):101616
- [CrossRef] [Google Scholar]
- Impact of non-covalent interactions on FT-IR spectrum and properties of 4-methylbenzylammonium nitrate. A DFT and Molecular docking study. Heliyon. 2021;7(10):e08204.
- [Google Scholar]
- Experimental and DFT studies on the molecular structure, spectroscopic properties, and molecular docking of 4-phenylpiperazine-1-ium dihydrogen phosphate. J. Mol. Struct.. 2020;1207:127762
- [CrossRef] [Google Scholar]
- Structural, docking and spectroscopic studies of a new piperazine derivative, 1-Phenylpiperazine-1, 4-diium bis (hydrogen sulfate) J. Mol. Struct.. 2020;1202:127351
- [CrossRef] [Google Scholar]
- J. Mol. Struct.. 2018;1173:439e447.
- [CrossRef]
- X-ray, spectral and biological (antimicrobial and superoxide dismutase) studies of oxalato bridged CuII–NiII and CuII–ZnII complexes with pentamethyldiethylenetriamine as capping ligand. J. Inorg. Biochem.. 2004;98(2):231-237.
- [CrossRef] [Google Scholar]
- Copper (II) complexes of tridentate N, N, N′, N ″, N ″-pentamethyldiethylenetriamine: Superoxide dismutase and inhibitory activity against bacteria and fungi. Spectrochim. Acta A Mol. Biomol. Spectrosc.. 2007;66(3):726-731.
- [CrossRef] [Google Scholar]
- Design, molecular docking analysis of an anti-inflammatory drug, computational analysis and intermolecular interactions energy studies of 1-benzothiophene-2-carboxylic acid. Comput. Biol. Chem.. 2020;88:107348
- [CrossRef] [Google Scholar]
- Non-covalent interactions and molecular docking studies on morphine compound. J. King Saud Univ.-Sci.. 2021;33(8):101606
- [CrossRef] [Google Scholar]
- Probing solvent effect and strong and weak interactions in 2-Nitrophenyl-hydrazine using independent gradient model and Hirshfeld from wave function calculation. J. Mol. Liq.. 2021;341:117345
- [CrossRef] [Google Scholar]
- Accelrys software inc. Discovery Studio Visualizer. 2005;2
- Effects of Eu3+/Ta5+ nonstoichiometric ratio on dielectric properties of (EuxTa1-x)0.08Ti0.92O2 ceramics with colossal permittivity: experiments and first-principle calculations. Céramique Int.. 2021;47(17):24868-24876.
- [CrossRef] [Google Scholar]
- Crystal Explorer (Version 3.1). UWA; 2012.
- GEMDOCK: a generic evolutionary method for molecular docking Proteins. Struct. Funct. Bioinforma.. 2004;55:288-304.
- [CrossRef] [Google Scholar]
- Spectrochim. Acta A.. 2010;75:1115-1124.
- [CrossRef]
- Chemcraft-graphical program for visualization of quantum chemistry computations. trial version 2005
- [Google Scholar]
Appendix A
Supplementary material
Supplementary data to this article can be found online at https://doi.org/10.1016/j.jksus.2023.102645.
Appendix A
Supplementary material
The following are the Supplementary data to this article:


