

Translate this page into:
Industrial textile removal using date pit assisted CuO-MgO nanocomposite: Molecular dynamics and biosynthesis analysis
⁎Corresponding author at: Nanoscience African Network (NANOAFNET) iThemba LABS-National Research Foundation Old Faure Road Somerset West 7129 South Africa. Tel: 0788866609. sackey@ilabs.nrf.ac.za (J. Sackey)
-
Received: ,
Accepted: ,
This article was originally published by Elsevier and was migrated to Scientific Scholar after the change of Publisher.
Peer review under responsibility of King Saud University.
Abstract
This is the first report describing the Molecular Dynamics (MD) simulation and complete green nanochemistry approach to investigate the interaction of CuO-MgO nanocomposite against methylene blue (MB) dye. The CuO-MgO nanocomposite was synthesized using African natural extract derived from agro-waste, date pits, and subsequently characterized via various characterization techniques.
Quantitative analysis of XRD data via MAUD software revealed monoclinic and cubic structures with particle sizes of 26.7 and 21.4 nm for CuO and MgO nanoparticles, respectively. While HRTEM analysis presents cubic shaped morphology, SAED images revealed lattice fringes with d- spacing 0.243 nm, 0.176 nm, 0.126 nm, and 0.102 nm corresponding respectively to (1 1 1), (1 1 2), (3 1 1), and (4 0 0) reflection of the CuO-MgO.
The MD analysis revealed that MB dye shows a significant hydrophobic nature with a high affinity to interact with the CuO-MgO nanocomposite and consequently absorb on the surface. Subsequently, experimental studies confirmed that bio-engineered CuO-MgO nanocomposite exhibited an excellent photocatalytic ability against methylene blue.
Computational modeling coupled with the green nanochemistry of nanomaterials can assist with bioengineering nanoparticles that may find unique applications in the treatment of dye contaminated water.
Keywords
Contaminated water
Date pits
Green nanochemistry
Methylene blue
Molecular dynamics
Photocatalysis

1 Introduction
Safe and readily available water necessary for drinking, domestic use, agriculture, or recreation is of fundamental importance and effectively contributes to social-economic development. Water resources hold great economic potential for the irrigation, transport, and tourism industry. Unlike other renewable resources, water use cannot be easily replaced immediately or in the future. As part of the SDG-6, everybody has the right to safe and affordable drinking water when needed (WHO, 2022). Yet technological advancement, unbalanced human settlement dynamics, and developments in industrial and agriculture sectors related to the fast-growing populations globally have resulted in the contamination of freshwater (Sharma and Bhattacharya, 2017; Yeleliere et al., 2018). W.H.O reports that at least two billion people worldwide drink contaminated water and are thus dangerously exposed to water-related diseases that cause millions of deaths globally (WHO, 2022). Water contamination is a severe problem globally and, if not managed, could lead to half of the world’s population living in water-stressed sites by 2025.
Water contamination emanating from effluent streams containing organic dyes such as methylene blue block the penetration of light through water and obstructs the photosynthesis process, thus affecting the entire aquatic biota. Organic textiles dyes discharged into wastewater are non-reusable because they become non-reactive and will remain in the environment for a long time (Aquino et al., 2014). They can end up in the food chain and subsequently lead to mutagenic and carcinogenic problems due to their degradation inefficiencies and toxicity levels. Therefore, it is highly important and extremely necessary that such organic textile dyes be removed from wastewater before disposing to water bodies.
Yet, due to their high solubility in water, organic textiles dyes are not easily removed by conventional methods, including biological treatment, which is economical but unproductive as microorganisms cannot mineralize synthetic dyes (Pandey et al., 2007). More so, the use of advanced oxidation is not very desirable due to the strong chemicals involved (Blanco et al., 2014). Other reported techniques such as ozonation (Venkatesh et al., 2017), coagulation (Verma et al., 2012) reversed and forwarded osmosis (Qiu and He, 2019; Lee et al., 2009) have also proven over the years to be ineffective, require long processes, and most importantly, are not cost-effective.
A potentially cost-effective, reliable and eco-friendly technology currently intensely researched is green nanochemistry that uses agro-waste products as effective chelating agents (Sackey et al., 2021; Sackey et al., 2020; Sackey et al., 2021). Several UV–Visible radiations of active photocatalyst stable oxides such as doped TiO2, Fe2O3, WO3, BiVO4 are synthesized via this technology (Sackey et al., 2020).
To the best of the authors' knowledge, this is the first time a comprehensive study combining computational simulation and green nanochemistry approach has been reported towards bio-engineered CuO-MgO nanocomposites for photocatalytic ability against methylene blue. The lack of a computation simulation in existing green nanochemistry models makes it difficult to accurately study the parameters effective for photocatalytic application. Hence, this approach will establish a new model that will overcome the existing limitations in current research. In view of minimizing the photo-generated electron and holes pair recombination while photoactivated by UV–Vis radiations, CuO-MgO nanocomposites are considered in this study. The specificity of this research is the synthesis of this family of CuO-MgO nanocomposites via pure green nanochemistry using extracts from date pits as effective chelating agents. It has been established that date pits which are the by-products of Phoenix dactylifera are rich sources of 4-Hydroxybenzoic acid, Gallic acid, L-glutamic, Sinapic acid, anthocyanin, and carotenoids (Al-Farsi and Lee, 2008; Morad et al., 2021).
For a plausible mechanism of nanocomposites formation, it is proposed that the Gallic, L-glutamic, and Sinapic acids contained in the extracts act as chelating agents and singlet oxygen scavengers. The acids chemically react with the cupric and magnesium acetate, thus causing a reduction from the metal salts to the CuO-MgO nanocomposites.
This contribution will scientifically characterize and test the biosynthesis of such photoactive nanocomposites. Given the Molecular Dynamics (MD) results, the architectural doping of such a CuO-MgO nanocomposite is pivotal in ensuring a high photocatalytic activity against methylene blue dye.
2 Computational and experimental method
2.1 Methylene blue dye interactions with CuO-MgO nanocomposite: molecular dynamics simulation
Molecular dynamics simulation is a technique for exploring conformational space using various sized molecules, including proteins, active compounds, and nanoparticles (Akbari et al., 2020; Hirel, 2015). The energy surface is studied in molecular dynamics by solving Newton's laws of motion for the system. In this contribution, a molecular dynamics simulation is used to investigate the interactions of methylene blue (MB) dye with the CuO-MgO nanocomposite and water as the universal solvent.
To run the molecular dynamics simulations, the nanocomposite of CuO-MgO containing two CuO and MgO nanoparticles in cubic shapes with a long side of 15 A˚ for each, created by Atomsk (Abraham et al., 2019) (see Fig. 1). The nanocomposite placed in the centre of a simulation cubic box and 20 molecules of MB dye were put into the box at random positions with a minimum distance of 1 nm from the simulation box's edge sides (Fig. 1). The simulation box was then filled with 7000 water molecules. GROMACS 2019 software (Huang and MacKerell, 2013) was used to perform all MD simulations under periodic boundary conditions (PBCs), with the CHARMM36 force field (Jorgensen et al., 1983) and SPC water model (Adcock and McCammon, 2006). TIP3P water molecules dissolved the whole complex. The energy of the system was minimized using the steepest descent minimization algorithm for all atoms (Hess et al., 1997).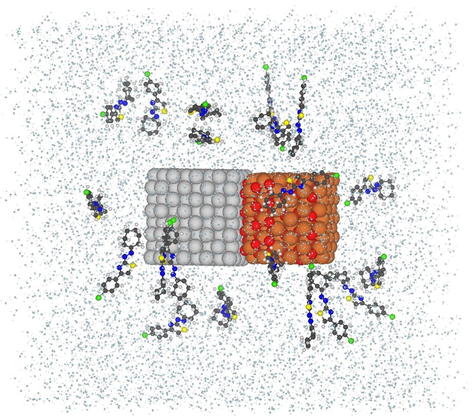
Schematic view of CuO-MgO nanocomposite surrounded with 20 MB dye molecule and water molecules in a simulation box.
The system was equilibrated in the NVT ensemble (constant number of particles (N), volume (V), and temperature (T)) coupled to the V-rescale thermal bath at 300 K over 100 ps, as well as the NPT ensemble (constant number of particles (N), pressure (P), and temperature (T)) coupled to the Berendsen pressure bath at 1 atm over 200 ps. The system was then exposed to a 100 ns molecular dynamics (MD) simulation with a time step of 2 fs under constant circumstances of 1 atm, and 300 K. The LINCS algorithm (Essmann et al., 1995) was used to constrain H-bond lengths. The particle mesh Ewald (PME) (Humphrey et al., 1996) was used to apply long-range electrostatics. GROMACS tools were used to analyze the trajectory data, and VMD 1.9.3 was used for molecular graphics and visualization (Vanommeslaeghe and MacKerell, 2012). The force field parameters of MB dye were acquired using CHARMM CGenFF (Zhao et al., 2007), and the Lennard Jones parameters for CuO and MgO nanoparticles were obtained from previously published data (Zhao et al., 2018; Frisch and Trucks, 2009). The electronic structure calculations, including charge distribution and electrostatic potential maps of MB dye, were performed using the Gaussian program, version 09 (Bakayoko et al., 2020). The geometry of MB dye was optimized at the B3LYP/6-311++g(d,p) level of theory.
2.2 Photochemical interactions with CuO-MgO nanocomposite: Bio-synthesis process
Date pits, Magnesium acetate tetrahydrate (Mg(CH3COO)2·4H2O), and cupric acetate (C4H8CuO5) of analytical grade are purchased from ‘cash n carry’ shop (strand, South Africa), Sigma-Aldrich, and BDH Chemicals Ltd (UK, England) respectively. Extraction of the bioactive compounds in the agro-waste products was done following the method described in Jorgensen and Duffy (2002). Briefly, in a typical experimental set-up, 30.0 g of dried clean date pits were brought to boil in 150 ml of distilled water under constant magnetic stirring at temperature 70 °C for two hours. The obtained yellowish aqueous extracts with a pH of 4 were filtrated twice under 55 mm Whatman filter paper once cooled. The extracts were kept at ambient temperature, ready to be used for biosynthesis.
Green nanochemistry bio-synthesis of CuO-MgO nanocomposites is achieved by dissolving 5.0 g of each precursor into 10 ml distilled water. Subsequently, both solutions were immersed simultaneously in 100 ml agro-waste aqueous extracts. A noticeable deep green color was observed, and a pH of 6 was recorded. The mixture was allowed to stir for 2 h under ambient temperature and later left in the oven to dry. Following this step, the dried precipitates were thermally oxidized under air in a laboratory furnace for 2 h. The annealed samples are characterized instantly for structural, optical, functional, and catalytic properties.
2.3 Photocatalysis activity of CuO-MgO nanocomposites
The photocatalysis activity of date pit mediated CuO-MgO nanocomposite was studied with methylene blue (MB) under visible light irradiation. Initial 0.0027 g of methylene blue dye was added to 500 ml of distilled water and stirred in the dark to attain a uniform solution. Two sets of experiments were performed, one with MB only under visible irradiation and the other with the addition of catalysis to MB under visible light irradiation. A volume of 100 ml of MB was used for each set of experiments. UV–Vis absorbance measurements in wavelength ranging from 200 to 800 nm are recorded every 15 min.
The first experiment is conducted with 100 ml of MB solution exposed to visible light irradiation. A 4 ml of the solution was taken after every 15 min for 180 min, and UV–Vis absorbance data was recorded.
The second set of experiments describes the photocatalysis degradation of CuO-MgO nanocomposite with methyl blue under visible light irradiation. A volume of 100 ml of MB solution was added to a mass of 0.01 g of CuO-MgO nanocomposite. The mixture was allowed to stir at 120 rpm in the dark for 30 min to build adsorption–desorption equilibrium. Before the mixture is exposed to visible light irradiation, at t = 0, UV–Vis absorbance measurement was recorded. Subsequently, mixture aliquots (∼4 ml) in contact with visible light irradiation were taken every 15 min for 150 min.
3 Characterization techniques
The crystallinity of the samples was determined via an x-ray diffractometer (Bruker AXS diffractometer D8 Advances). Subsequently, the diffuse Reflectance and UV–Vis absorbance of the samples were analyzed using the Cary 5000UV–VisNIR spectrophotometer equipped with an integrating sphere. Morphological characterization was carried out on High-Resolution Transmission Electron Microscopy, HRTEM (Tecnai 720), and SEM images were captured using a Tescan MIRA3 SEM. Sample purity and elemental composition were determined with EDX performed using a Nova NanoSEM at 20 kV (6 mm working distance) equipped with an Oxford X-Max detector (20 mm2) and Oxford INCA software.
The photocatalysis experiment is performed using a 160 W solar Glo UV lamp with an optical efficiency of 11.7 Lm/W and thermal efficiency of 85%.
4 Results and discussion
4.1 Computational analysis: root mean square displacements (RMSD)
Fig. 2 shows the root mean square displacements (RMSD) of active compounds during simulations indicating whenever the analyzed systems have achieved their equilibrium states. The spectra demonstrate that in simulations with significantly reduced RMSD fluctuations, all systems attain their equilibrium state before 22 ns. As a result, the MD trajectories extracted after 22 ns are used for further analysis.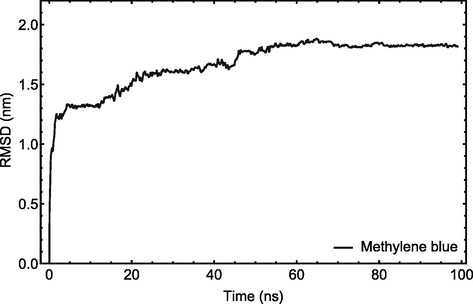
RMSD plot of MB dye with respect to CuO-MgO nanocomposite. The MD trajectories after 22 ns have been taken for further analysis.
4.2 Computational analysis: charge distribution map
The charge distribution and electrostatic potential map of MB dye in Fig. 3 illustrate the active sites of this molecule to interact with the nanocomposite. The Hirshfeld point charges and electrostatic potential map for the optimized structure were produced using DFT calculations with water as the solvent. The results indicate that the most reddened region (vicinity of the atom N1) in the charge distribution map corresponds to the active sites of molecules interacting with the nanoparticles.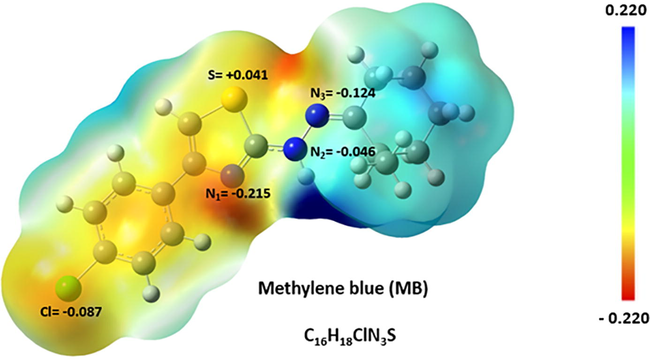
Charge distribution (Hirshfeld point charges) of MB dye and its electrostatic potential map. The geometry optimization of MB dye was carried out at the B3LYP/6-311++g(d,p) level of theory.
4.3 Computational analysis: Radial Distribution Function (RDF)
The left structure in Fig. 4(a) represents the initial structure of the system before simulation, whereas the right structure represents the structure of the system following a 100 ns molecular dynamics simulation. As shown in the figure, MB dye molecules are absorbed primarily by the surface of the CuO nanoparticle.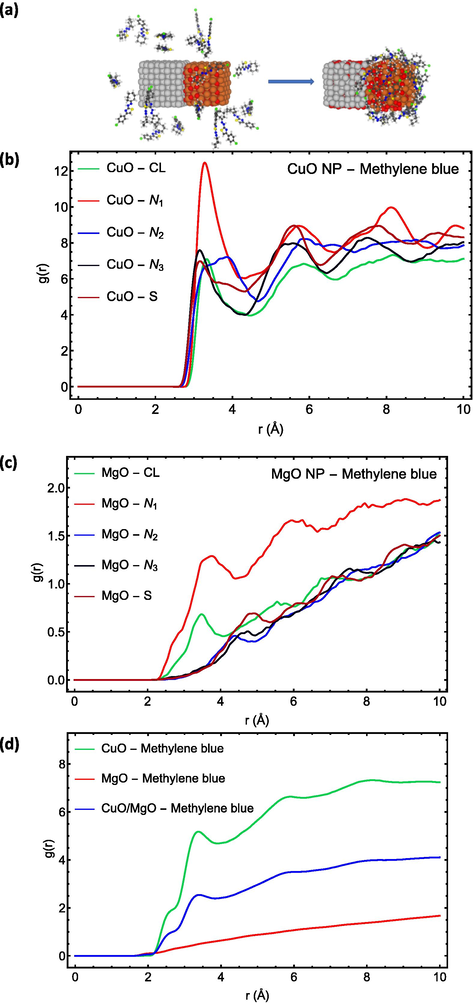
MD simulation showing (a) the structure of the system before and after simulation, (b–d) RDF plots of MB dye.
The Radial Distribution Function (RDF), g(r), for the active sites of MB dye molecules with respect to the surface of the CuO nanoparticle is shown in Fig. 4(b), whereas the RDF for the active sites of molecules with respect to the surface of the MgO nanoparticle is shown in Fig. 4(c). As illustrated in Fig. 4(b,c), the g(r) has a maximum peak for atom N1 at MB dye molecule, indicating that this atom has the highest affinity to interact with the surface of nanocomposite in comparison to other nitrogen atoms, which agrees with DFT calculations (Fig. 3).
The RDF of MB dye with respect to the surface of each nanoparticle and, in general, CuO-MgO nanocomposite is depicted in Fig. 4(d). These results demonstrated that MB dye has a substantially great affinity to CuO nanoparticles than MgO nanoparticles. In addition, the RDF plot of MB dye in relation to the surface of the nanocomposite shows the highest peak for g(r) in the vicinity of the nanocomposite's surface at around 2.5 Å, indicating the absorbs in of all MB dye molecules on the surface of the nanocomposite.
LogS is directly proportional to an active compound's water solubility and is defined as a common solubility unit corresponding to the 10-based logarithm of a molecule's solubility in mol/L. It is suggested that logS values lower than −5 indicate a low polar molecule, implying stronger hydrophobicity and a lower tendency to interact with water (Delmondes and Stefani, 2017). According to empirical evidence, molecules with logS values between −1 and −5 exhibit hydrophilicity, lipophilicity, and water solubility, enabling them to interact with hydrophobic surfaces (Tetko et al., 2005).
The logS value for the water solubility of MB dye was calculated to be −5.02 in this study using the ALOPGPS 2.1 software (Åsbrink and Norrby, 1970), indicating that the molecule is more hydrophobic and has a higher affinity for interacting with the nanocomposite than water.
The interaction energies (Van der Waals + electrostatic potential energies) shown in Table 1 indicate that the interaction energy between the MB dye and the nanocomposite is much higher than the interaction energy between the MB dye and water. The obtained interaction energies (Table 1), final structures after MD simulations in Fig. 4, all corroborate the discussion on log S values, which indicate that MB dye is significantly showing hydrophobic nature and consequently has a high affinity to interact with the nanocomposite and absorb on the surface than interacting with water molecules.
Interaction Energies (Van der Waals + Electrostatic potential energies)
(kJ/mol)
MB dye
CuO/MgO–MB dye
−2290.28 ± 36
CuO/MgO-Water
−344.43 ± 15
MB dye - Water
−1038.03.10 ± 8
4.4 Experimental analysis: XRD
Fig. 5 shows experimental and calculated XRD spectra for date pit mediated CuO-MgO nanocomposites. Weight percentages calculated using the MAUD software recorded values of 42.53 % and 57.46 % for CuO and MgO, respectively. A cubic structure belonging to the Fm-3m space group proposed by Hazen R M (33) is used to fit the MgO portion of the nanocomposite. The corresponding reflections are presented in Table 2(a). Meanwhile, a monoclinic structure of CuO in the space group of c2/c:b1 proposed by Asbrink S (Sackey et al., 2021) is used to fit well the CuO portion of the date pits mediated CuO-MgO nanocomposite. Characteristic reflection from crystal plane with respective d-spacing is given in Table 2(b). From the MAUD analysis, it can be observed that such proposed structures of both MgO and CuO fit fairly well with the experimental XRD data. Some interesting parameters such as atomic positions, lattice parameters, crystallite size, and micro-strain are extracted from the refined Rietveld analysis using MAUD software. These parameters are presented in Tables 3 -4(a,b). MgO CuO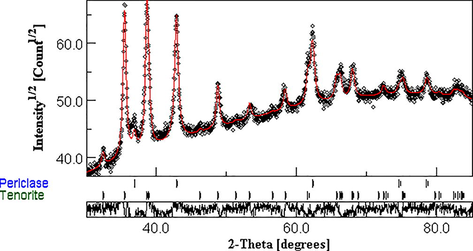
Observed and calculated XRD spectra for CuO-MgO nanocomposite. Redlines represent (--) the calculated peaks using MAUD software, while black diamond (**) illustrate experimental data.
Miller index (hkl)
d-spacing
(1 1 1)
2.434
(2 0 0)
2.108
(2 2 0)
1.490
(3 1 1)
1.271
(2 2 2)
1.217
(4 0 0)
1.054
Miller index (hkl)
d-spacing
(1 1 1)
2.759
(−1 1 1)
2.528
(0 0 2)
2.525
(1 1 1)
2.326
(2 0 0)
2.312
(−1 1 2)
1.962
(−2 0 2)
1.867
(1 1 2)
1.778
(0 2 0)
1.719
(0 2 1)
1.627
(2 0 2)
1.579
(−1 1 3)
1.505
Atom
a(Å)
b(Å)
c(Å)
Size (Å)
Micro-strain ɛ (*1e−5)
CuO
4.689(3)
3.437(3)
5.122(3)
267.59(1)
1.8100(3)
MgO
4.2158(4)
–
–
214.38(1)
10.369(3)
Atom
Atomic position
Biso
X
Y
x
Cu
0.2500
0.25
0
0
O
0
0.41942453
0.25
0
(b)
Atom
Atomic position
Biso
X
Y
x
Mg
0
0
0
0
O
0.5
0.5
0.5
0
4.5 Experimental analysis: optical properties
Fig. 6 (a) shows the diffuse reflectance spectrum of CuO-MgO recorded in a 200–2500 nm wavelength. The spectrum displays low reflectance below 8% in the UV–Vis region, designated by R1. A gradual rise in reflectance is observed in a wavelength range from 900 to 1400 nm (see R2). In the NIR region designated by R3, date pits mediated CuO-MgO nanocomposite display a steady-state reflectance of ∼25%. Such reflectance behaviour exhibited by CuO-MgO nanocomposite is identical to a solar absorber material.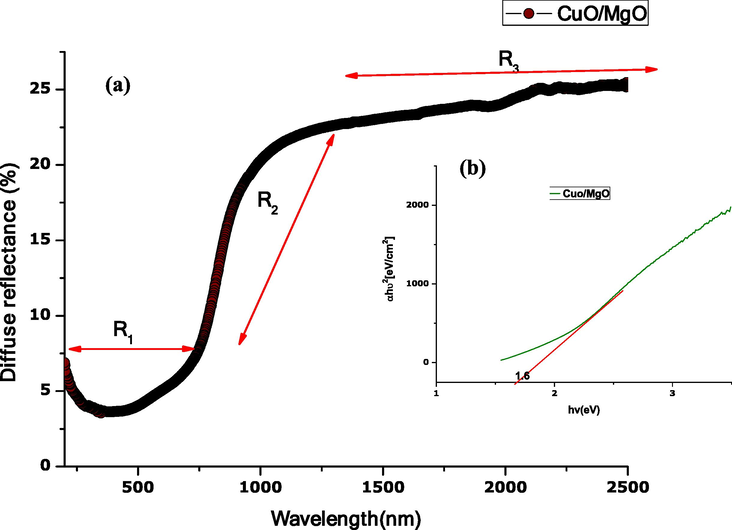
Optical property of CuO-MgO nanocomposite showing (a) Diffuse reflectance spectrum, (b) energy band gap.
Fig. 6(b) shows the corresponding energy bandgap estimated following the Kubelka-Munk equation expressed in Widiarti et al. (2017). A plot of verses gives a bandgap which is a drawn tangent line to touch the x-axis. The estimated bandgap 1.6 eV consistent with literature is caused by combined transition from O2(2p) to Mg2+(2p6) and Cu2+(3d9) [37–39].
The UV–Vis absorbance spectra for aqueous date pit extracts and CuO–MgO nanocomposite are shown in Fig. 7. Aqueous date pits extracts show two strong absorbance peaks centred at 280 and 330 nm. Such peaks originate from phytochemicals contained in the date pits, which generally have absorbance peaks at 240–280 nm and 300–380 nm attributed to B-ring cinnamoyl and A-ring benzoyl systems, respectively. Therefore, observation of such prominent peaks confirms that the mechanism of the reaction between phytochemical in date pits extracts with CuO-MgO precursor is feasible, which would result in nanoparticle formation. To further validate that, UV–Vis absorbance was measured for CuO-MgO in date pit extracts. The result shows an absorbance peak at 700 nm.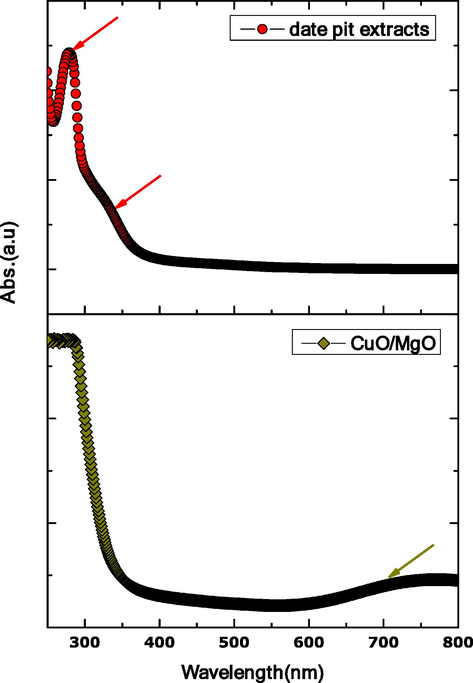
UV–Vis absorbance spectra for date pit extracts and CuO-MgO nanocomposite.
4.6 Experimental analysis: morphological and particle size analysis
Fig. 8 shows the High-Resolution Transmission Electron Microscope (HRTEM) images of the synthesized CuO-MgO nanocomposites. It is clear from the images shown in Fig. 8(a) that both bigger and smaller cubic-shaped nanoparticles are strongly agglomerated, which is evident in the presence of CuO-MgO nanocomposite. The average grain size was estimated via image j software and recorded a value of 12.1 nm. A histogram of the particle size distribution is shown in Fig. 8(b).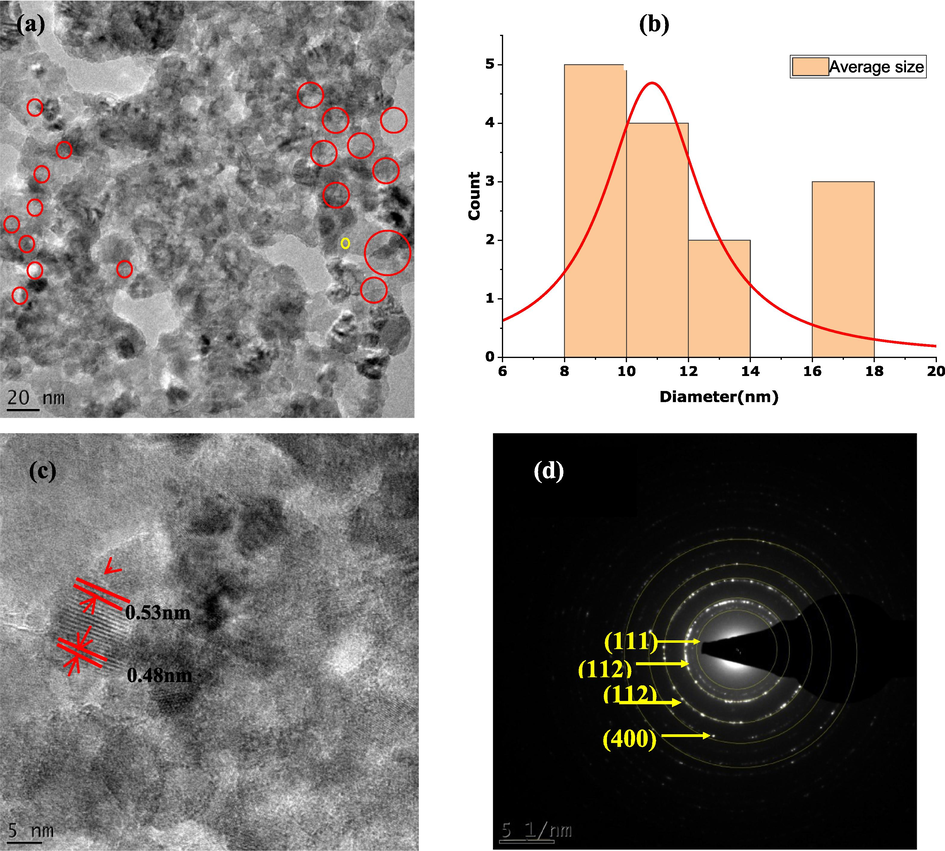
HTEM images showing (a) cubic shaped CuO-MgO nanocomposites, (b) histogram of particle size distribution, (c) singular nanogram with appropriatedhkldistances, (d) SAED images.
A singular nanogram is shown in Fig. 8(c) reveal a series of distinguishable planes with appropriate dhkl distances of 0.53 and 0.48 nm
The selected area electron diffraction (SAED) image displayed in Fig. 8(d)reveals bight diffraction spots with each spot arising from Bragg reflection from CuO-MgO nanocomposite. Precisely, the SAED images exhibit multiple rings, which confirms the polycrystalline nature of the CuO-MgO nanocomposite. The lattice fringes with d-spacing of 0.243 nm, 0.176 nm, 0.126 nm, and 0.102 nm correspond respectively to (1 1 1), (1 1 2), (3 1 1), and (4 0 0) reflection of the CuO-MgO.
SEM images of the date pit assisted CuO-MgO nanocomposite is shown in Fig. 9(a). The images reveal cubic agglomerated CuO nanoparticles decorated on the flake and sheet-shaped morphology of MgO.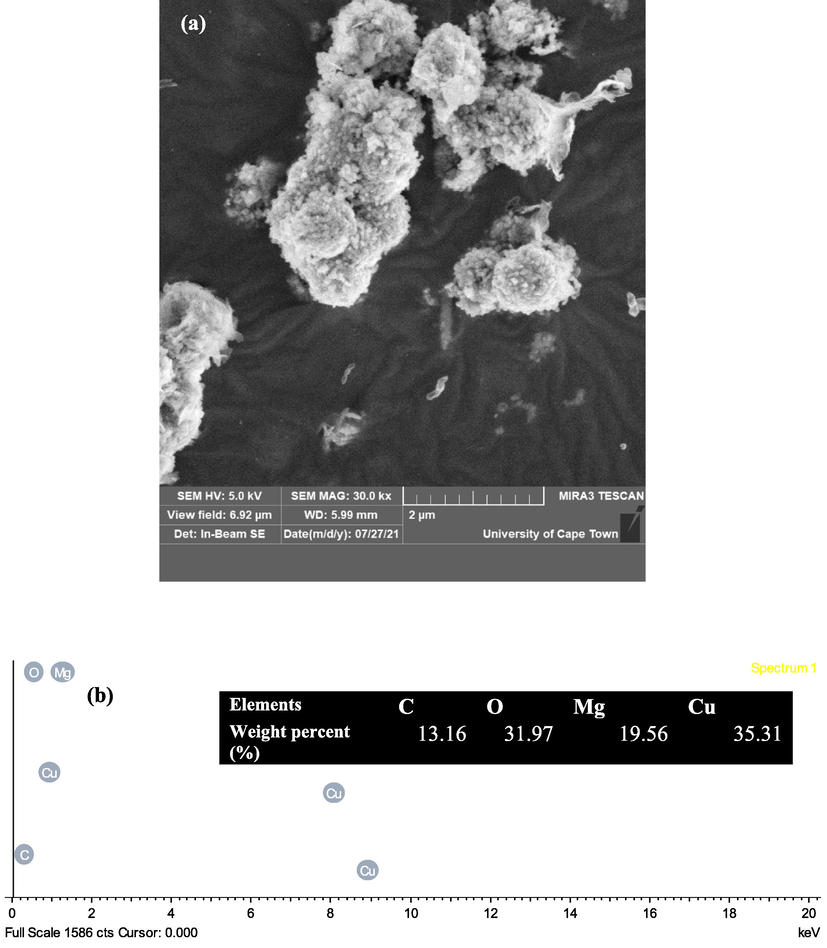
showing (a) SEM images of CuO-MgO nanocomposite, (b) the EDS spectrum of CuO-MgO nanocomposite showing clearly the chemical elements. Inset is a table of the weight percentage of the chemical elements present in the sample.
EDS analysis is performed to confirm the synthesis of pure CuO-MgO nanocomposite, and the result is shown in Fig. 9(b). The presence of Cis due to carbon coating samples before SEM analysis. Identified chemical elements are Cu, Mg, and O. This confirms the synthesis of pure CuO-MgO nanocomposite devoid of any impurities.
4.7 Experimental analysis: photocatalysis analysis
Fig. 10 shows the photocatalysis degradation of methyl blue (MB) under visible light irradiation. Before contact with visible light irradiation, samples were taken at the initial time (t = 0), and UV–Vis absorbance data was recorded. By visual observation (see insert), MB did not show any colour change from the beginning to the end of the experiment. In addition, the intensity of the UV–Vis absorbance spectra shown in Fig. 10 is contact throughout the experiment. This confirms the inability of photocatalysis degradation of MB in the presence of visible light only. As shown, peak levels from t = 0 to t = 180 min remains almost the same.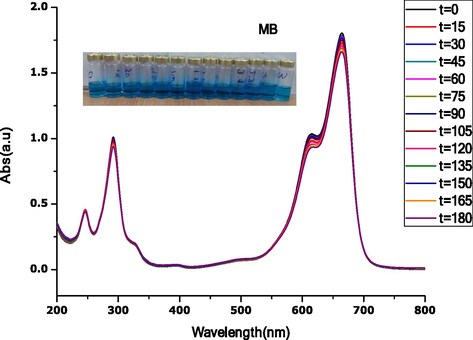
Photocatalysis activity of methylene blue under UV-light irradiation for 180 min, insert is an image showing no color change.
Fig. 11 shows the photocatalysis degradation performance of synthesized CuO-MgO nanocomposite with methylene blue under visible light irradiation. The dye degradation is monitored by the colour changes from blue to transparent, as seen in the insert. In addition, the spectra show a reduction of the intensity of peaks w.r.t increase contact time of illumination. Furthermore, it is also observed that the shape of peak intensity changes with increased contact time. Initial sharp peaks gradually reduce to become broad at higher contact times, signifying complete dye degradation.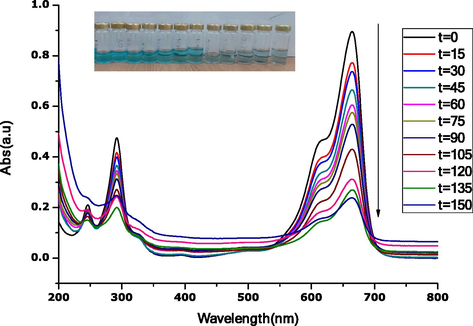
UV–Vis spectra for photocatalysis degradation of methylene blue under UV-light in contact time with CuO-MgO nanocomposites, insert is an image of the color change.
4.8 Experimental analysis: photocatalysis degradation analysis
The Photocatalysis degradation efficiency is calculated using the equation given as
Fig. 12 shows the photocatalysis degradation rate of methylene blue and in contact with CuO-MgO nanocomposite in the presence of visible light irradiation. The degradation rate of MB in the presence of visible light is 10% which implies that MB in the presence of visible light does not show any significant degradation ability. Yet when in contact with CuO-MgO nanocomposite in the presence of visible light, the degradation rate increased to 77%.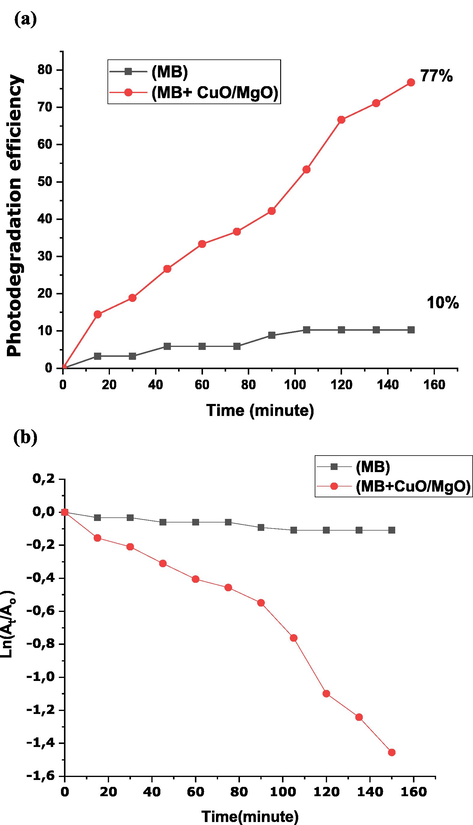
Photocatalysis degradation (a) rate of methylene blue only and in contact with CuO-MgO in the presence of visible light irradiation, (b) reaction rate for MB and MB + CuO-MgO.
4.9 Experimental analysis: removal kinetic of methylene blue
The photocatalysis degradation obeys the pseudo-first-order kinetics (see Fig. 12(a)), which follows the equation written as where is the absorbance at time t = t (sampling time), is the absorbance at t = 0 min, is the reaction rate constant, and is irradiation time. The reaction rate constant ( ) was calculated from the slope of versus irradiation time. From Fig. 12(b), the reaction rate constant values for MB and MB + CuO-MgO nanocomposite respectively are found as −0.000728 ± 7.5 min−1 (R2 = 0.9117) and −0.00929 ± 7.7 min−1 (R2 = 0.9405). The smaller value obtained for MB only in the presence of visible light compared to the higher value for MB + CuO-MgO nanocomposite in the presence of visible light further confirms the higher degradation ability of date pit mediated CuO-MgO nanocomposite. The higher photocatalytic degradation activity of CuO-MgO nanocomposite is caused by the smaller bandgap that favours the stepping of electrons from the valence band to the conduction band and thus enhancing the radical species.
5 Conclusion
This study analyzes the behaviour and nature of interactions between Methylene Blue (MB) dye on CuO-MgO nanocomposites via the Molecular Dynamics (MD) simulation and nanochemistry approach. The green nanochemistry approach confirmed the mechanism and synthesis of CuO-MgO nanocomposites with the date pit extracts. The polycrystalline nature and purity of the CuO-MgO nanocomposites were confirmed via SAED and EDS analysis, respectively.
The results of the Radial Distribution Function (RDF) analysis revealed that MB dye has a high affinity for interacting with CuO-MgO nanocomposites. As a direct application, date pit mediated CuO-MgO nanocomposites exhibited a high photodegradation ability against methylene blue dye under visible light irradiation. This makes our biogenic engineered CuO-MgO nanocomposites a promising candidate for dye removal in wastewater.
Acknowledgement
The authors are grateful to Unisa-Unesco Africa Chair in Nanoscience and Nanotechnology (U2ACN2) Postdoctoral fellowship grant (90390490) for the financial contribution towards the project. The authors thank the iThemba LABS National Research Foundation of South Africa for providing research facilities. The authors also acknowledge the Centre for High-Performance Computing (CHPC), South Africa, for providing computational resources and facilities for this research project.
Declaration of Competing Interest
The authors declare that they have no known competing financial interests or personal relationships that could have appeared to influence the work reported in this paper.
References
- Abraham, M., Van der Spoel, J.D., Lindahl, E., Hess, B., 2019. GROMACS development team, GROMACS User Manual version 2019, 2019.
- Adcock, S., McCammon, A., 2006. Molecular dynamics: Survey of methods for simulating the activity of proteins, 106 (5).
- First principle study of silver nanoparticle interactions with antimalarial drugs extracted from Artemisia annua plant. J. Nanopart. Res.. 2020;22(11)
- [CrossRef] [Google Scholar]
- Nutritional and functional properties of dates: a review. Crit. Rev. Food Sci. Nutr.. 2008;48(10):877-887.
- [Google Scholar]
- Electrochemical degradation of a real textile wastewater using β-PbO2 and DSA® anodes. Chem. Eng. J.. 2014;251:138-145.
- [Google Scholar]
- Åsbrink, S., Norrby, L.J., 1970. A refinement of the crystal structure of copper (II) oxide with a discussion of some exceptional esd's, 26(1).
- Synthesis and characterization of zinc oxide nanoparticles (ZnO NPs) in powder and in thin film using corn husk extract via green chemistry. MRS Adv.. 2020;5(21-22):1083-1093.
- [Google Scholar]
- Photo-Fenton and sequencing batch reactor coupled to photo-Fenton processes for textile wastewater reclamation: feasibility of reuse in dyeing processes. Chem. Eng. J.. 2014;240:469-475.
- [Google Scholar]
- Computational Study of Natural Phenolic Acid Solubility and Their Interactions with. Chitosan 2017
- [Google Scholar]
- M. Frisch, G. Trucks, H. Schlege and et al., Gaussian 09, Revision A.02, Gaussian, Inc., Wallingford, CT, USA, 2009.
- LINCS: A linear constraint solver for molecular simulations. LINCS: a linear constraint solver for molecular simulations.“. 1997;18(12):1463-1472.
- [Google Scholar]
- Atomsk: A tool for manipulating and converting atomic data files. Comput. Phys. Commun.. 2015;197:212-219.
- [Google Scholar]
- CHARMM36 all-atom additive protein force field: Validation based on comparison to NMR data. J. Comput. Chem.. 2013;34(25):2135-2145.
- [Google Scholar]
- Prediction of drug solubility from structure. Adv. Drug Deliv. Rev.. 2002;54(3):355-366.
- [Google Scholar]
- Comparison of simple potential functions for simulating liquid water. J. Chem. Phys.. 1983;79(2):926-935.
- [Google Scholar]
- Ozone-biological activated carbon as a pretreatment process for reverse osmosis brine treatment and recovery. Water Res.. 2009;43(16):3948-3955.
- [Google Scholar]
- First principle simulation of coated hydroxychloroquine on Ag, Au and Pt nanoparticles. Sci. Rep.. 2021;11(1)
- [CrossRef] [Google Scholar]
- Bacterial decolorization and degradation of azo dyes. Int. Biodeterior. Biodegrad.. 2007;59(2):73-84.
- [Google Scholar]
- Efficient removal of heavy metal ions by forward osmosis membrane with a polydopamine modified zeolitic imidazolate framework incorporated selective layer. J. Hazard. Mater.. 2019;367:339-347.
- [Google Scholar]
- Date pits extracts assisted synthesis of magnesium oxides nanoparticles and its application towards the photocatalytic degradation of methylene blue. J. King Saud Univ. – Sci.. 2020;32(6):2767-2776.
- [Google Scholar]
- J. Sackey, A. Nwanya, A. K. H. Bashir, N. Matinise, J. B. Ngilirabanga, A. E. Ameh and M. Maaza, “Electrochemical properties of Euphorbia pulcherrima mediated copper oxide nanoparticles,” vol. 244, no. 122714, 2020.
- J. Sackey, L. C. Razanamahandry, S. K. O. Ntwampe, N. Mlungisi, A. Fall, C. Kaonga and Z. Y. Nuru, “Biosynthesis of CuO nanoparticles using Mimosa hamata extracts.,” vol. 36, 2021.
- J. Sackey, M. Akbari, R. Morad, A. K. H. Bashir, N. M. Ndiaye, N. Matinise and M. Maaza, “Molecular dynamics and bio-synthesis of phoenix dactylifera mediated Mn3O4 nanoparticles: Electrochemical application,” vol. 854, no. 156987, 2021.
- Bio-synthesised black α-Cr2O3 nanoparticles; experimental analysis and density function theory calculations. 2021;850(156671):2021.
- Drinking water contamination and treatment techniques. Appl. Water Sci.. 2017;7(3):1043-1067.
- [Google Scholar]
- Virtual Computational Chemistry Laboratory – Design and Description. J. Comput. Aided Mol. Des.. 2005;19(6):453-463.
- [Google Scholar]
- Automation of the CHARMM General Force Field (CGenFF) I: Bond Perception and Atom Typing. J. Chem. Inf. Model.. 2012;52(12):3144-3154.
- [Google Scholar]
- Dye decomposition by combined ozonation and anaerobic treatment: Cost effective technology. J. Appl. Res. Technol.. 2017;15(4):340-345.
- [Google Scholar]
- A review on chemical coagulation/flocculation technologies for removal of colour from textile wastewaters. J. Environ. Manage.. 2012;93(1):154-168.
- [Google Scholar]
- WHO, https://www.who.int/news-room/fact-sheets/detail/drinking-water..
- N. Widiarti, J. K. Sae and S. Wahyuni, “Synthesis CuO-ZnO nanocomposite and its application as an antibacterial agent. In IOP Conference Series: Materials Science and Engineering,” IOP Publishing, p. 012036, 2017, February.
- Review of Ghana’s water resources: the quality and management with particular focus on freshwater resources. Appl Water Sci. 2018;8(3)
- [CrossRef] [Google Scholar]
- Molecular dynamics simulation of the microscopic sintering process of CuO nanograins inside an oxygen carrier particle. J. Phys. Chem. C. 2018;122(44):25595-25605.
- [Google Scholar]
- Semi-ionic model for metal oxides and their interfaces with organic molecules. J. Phys. Chem. C. 2007;111(28):10610-10617.
- [Google Scholar]


