

Translate this page into:
Improvement of a diet-induced model of hyperlipidemia in Wistar rats: Assessment of biochemical parameters, the thickness of the abdominal aorta and liver histology
⁎Corresponding author at: Department of Pharmacology and Clinical Pharmacy, Faculty of Pharmacy, University of Sarajevo, Zmaja od Bosne 8, 71000 Sarajevo, Bosnia and Herzegovina. belma.pehlivanovic@ffsa.unsa.ba (Belma Pehlivanović Kelle),
-
Received: ,
Accepted: ,
This article was originally published by Elsevier and was migrated to Scientific Scholar after the change of Publisher.
Abstract
Objectives
This study aimed to develop an improved and more reliable atherogenic diet-induced model of hyperlipidemia in Wistar rats for a better insight into pathophysiological changes and their effects on relevant biochemical and histological markers as well as on the thickness of the abdominal aorta.
Methods
The study was conducted on a total number of 24 Wistar rats, three-month-old, weighing 180–230g that were divided into two groups: the standard rodent diet (SD) group (n = 12; 6 males and 6 females) in which rats were fed with commercially available standard rodent diet (SRD), and the atherogenic rodent diet (AD) group (n = 12; 6 males and 6 females) in which rats were fed with our mixture of atherogenic rodent diet (ARD) throughout the study period of 28 days. The body weight of rats was recorded weekly. The blood samples were collected by cardiac puncture and values of total cholesterol (TC) and triglycerides (TG) were determined at baseline, after the 14 days, and on the last day of the study, while other parameters high-density lipoprotein (HDL) cholesterol, lowdensity lipoprotein (LDL) cholesterol, non-HDL cholesterol, total protein (TP), glucose (GC), alanine transaminase (ALT), and aspartate transaminase (AST) were determined only on the last day of the study. The liver and abdominal aorta were collected after sacrifice and stored for further analysis.
Results
Feeding rats with an ARD for 14 days resulted in the successful development of hyperlipidemia, as the TC and TG values were significantly increased (p < 0.05). Further feeding with an ARD for a total of 28 days resulted in significantly increased levels of TC, TG, LDL, non-HDL, and decreased levels of HDL compared to rats fed with SRD (p < 0.05). Greater risk predispositions for CVDs were documented for rats in the AD group, due to the significant increase in AI and LDL/HDL ratio compared to the SD group (p < 0.05).
Conclusion
Obtained lipid profile and predictors confirm the establishment of a diet-induced model of hyperlipidemia in Wistar rats and prove the suitability of our model for future testing and proving the effectiveness of lipid-lowering agents.
Keywords
Atherogenic diet
Model
Hyperlipidemia
Rats

- AD
-
atherogenic diet group
- AI
-
atherogenic index
- ALT
-
alanine transaminase
- ARD
-
atherogenic rodent diet
- AST
-
aspartate transaminase
- CVDs
-
cardiovascular diseases
- GC
-
glucose
- HDL
-
high-density lipoprotein
- HE
-
hematoxylin-eosin
- HMG-CoA
-
3-hydroxy-3-methylglutaryl-coenzyme A
- LDL
-
low-density lipoprotein
- SD
-
standard diet group
- SPSS
-
Statistical Package for Social Sciences
- SRD
-
standard rodent diet
- TC
-
total cholesterol
- TG
-
triglycerides
- TP
-
total protein
Abbreviations
1 Introduction
Cardiovascular diseases (CVDs) still remain the leading cause of morbidity and mortality worldwide (Roth et al., 2020). According to pre-COVID-19 available literature, a constant increase in the number of deaths from CVDs is recorded and reaching almost 9 million deaths in 2019 (WHO, 2020). Unhealthy lifestyle habits and increased uptake of saturated fat led to hyperlipidemia which is considered a major risk factor for atherosclerosis and CVDs (Bergheanu et al., 2017; Andreadou et al., 2020; Hill and Bordoni, 2022; Yao et al., 2020). The increased consumption of high fat in the diet is also directly related to obesity and insulin resistance (Storlien et al., 1991; Munshi et al., 2014; Vandevijvere et al., 2015; Lu et al., 2016).
The standard therapy for the treatment of hyperlipidemia is based on statins, inhibitors of enzyme 3-hydroxy-3-methylglutaryl-coenzyme A (HMG-CoA) reductase. Although, it has well-established efficacy in lowering low-density lipoprotein cholesterol (LDL-C) and preventing the progression of atherosclerosis and CVDs, conventional statin therapy is often insufficient due to the following issues: lack of optimal reduction of LDL-C, statin intolerance (particularly at higher dosage regimes) mainly due to various side effects and the possibility of serious side effects such as hepatotoxicity, renal injury, cramps, myalgia, weakness, and rhabdomyolysis (Muscoli et al., 2022; Kosmas et al., 2021). Therefore, further investigations in this field are required, including preclinical studies as a significant component of drug development and assessment, in order to improve conventional statin therapy.
Over the years, in order to create a reliable animal model for the investigation of the pathogenesis of hyperlipidemia, similar to that in humans, different types of models have been tested for preclinical research and the evaluation of various lipid-lowering agents and pharmacological therapies (Andreadou et al., 2020). Although rats and mice are naturally resistant to the development of hyperlipidemia and atherosclerosis, dietary and genetic interventions result in the successful increase of lipid parameters in blood, obesity, and atherosclerotic lesions (Li et al., 2020; Andreadou et al., 2020; Zhao et al., 2020).
Several studies have suggested that long-term feeding with a high-fat diet or so-called atherogenic diet results in the successful induction of a reliable model of hyperlipidemia in rodents (Poznyak et al., 2020; Marques et al., 2015). Previous models were mainly based on different nutritional modifications of diets, such as an increase in fats or sugars and supplementations with cholesterol, cholic acid, or sodium cholate, single intraperitoneal injection of non-ionic surfactants, or genetic modifications of an animal (Zhao et al., 2020; Munshi et al., 2014). However, those studies mostly monitored only the reduction of cholesterol and did not provide sufficient data regarding the impact of induced hyperlipidemia on biochemical parameters and animal liver. Moreover, a recent review suggested that some of the previous studies did not provide TC values at the beginning and the end of the study making it impossible to prove the induction of hyperlipidemia (Cunha et al., 2021).
In the view of above, the primary aim of this study was to develop a more reliable atherogenic diet-induced model of hyperlipidemia in Wistar rats for a better insight into pathophysiological changes and their effects on relevant biochemical and histological markers as well as on the thickness of the abdominal aorta.
2 Materials and methods
2.1 Experimental animals
Animal care and experimental procedures were conducted in compliance with the International Guiding Principles for Biomedical Research Involving Animals (International Guiding Principles for Biomedical Research Involving Animals, 2012). All the experimental procedures were approved by the Ethics Committee of the Faculty of Pharmacy, University of Sarajevo (Protocol No. 0101-773/19). Wistar rats were bred and housed at the Department of Pharmacology, Clinical Pharmacology and Toxicology of Medical Faculty, University of Sarajevo. Throughout the study, experimental animals were maintained under constant laboratory conditions (temperature: 20–23 °C, humidity: 60 ± 10 %, and 12 h dark/light cycle).
2.2 Diets
Animals were fed two types of rodent diets, an atherogenic rodent diet (ARD) for induction of the model of hyperlipidemia and a commercially available standard rodent diet (SRD) (VERSELE-LAGA, Nature Rat) used as a control. An atherogenic rodent diet was prepared from 75.0 % of commercially available Teklad TD. 02,028 (Western purified atherogenic diet with added cholesterol and cholic source) to which 15.0 % of lard and 10.0 % of coconut oil were added. The exact ingredients of ARD and SRD used for the induction of the model of hyperlipidemia are presented in Table 1. Water was available ad libitum. SRD – standard rodent diet; ARD – atherogenic rodent diet
ARD
Ingredientsg/kg
SRD
Ingredients
Analytical constituents (%)
Casein
146.25
Crude protein
17.5
DL-methionine
2.25
Crude oils and fats
8.5
Sucrose
244.095
Crude fibers
8.0
Corn starch
112.5
Crude ash
5.0
Anhydrous milkfat
157.5
Additives (per kilogram)
Cholesterol
9.375
Vitamin A (I.U)
11,750
Cholic acid
3.75
Vitamin D3 (I.U)
1450
Cellulose
37.5
Vitamin E (mg)
90.0
Mineral Mix, AIN-76 (170915)
26.25
Fe (mg)
112.0
Calcium carbonate
3.0
Mn (mg)
86.0
Vitamin Mix, Teklad (40060)
7.5
Zn (mg)
80.0
Ethoxyquin, antioxidant
0.03
Cu (mg)
11.0
Lard
150.0
I (mg)
2.0
Coconut oil
100.0
Se (mg)
0.23
2.3 Experimental design
During the period of this study, a total number of 24 male and female rats, weighing 180–230 g, three-month-old, were kept in four plexiglass cages, in groups of six animals each, according to sex and experimental groups. The total amount of food placed per cage was 120 g/per day, according to the manufacturer’s recommendation (15–20 g/rat/per day). In an acclimatization period, all the rats were fed with an SRD for 7 days. Male and female rats were randomly divided into two groups: the standard rodent diet (SD) group (n = 12, 6 males and 6 females) in which rats were fed with SRD, and the atherogenic rodent diet (AD) group (n = 12, 6 males and 6 females) in which rats were fed with ARD throughout the study period of 28 days. Daily observation of the experimental animals during the experiment showed no deviations or changes in the appearance of the examined groups. All rats completed the 28 days of the study. The body weight of rats was recorded weekly during the period of the experiment.
2.4 Measurement of biochemical parameters
Values of total cholesterol (TC) and triglycerides (TG), measured in mmol/L, were determined at baseline, after the second week, and on the last day of the study, while other parameters high-density lipoprotein (HDL) cholesterol, low-density lipoprotein (LDL) cholesterol, non-HDL cholesterol, total protein (TP), glucose (GC), alanine transaminase (ALT), and aspartate transaminase (AST) were determined only on the last day of the study. The following biochemical parameters: TC, TG, HDL, TP, GC, ALT, and AST were determined on automated clinical chemistry and immunoassay analyzer Architect Ci8200 (Abbott Laboratories, Abbott Park, Ill., USA). Low-density lipoprotein cholesterol and non-HDL were calculated according to Friedewald's formula (Friedewald et al., 1972). In order to assess the risk for the development of cardiovascular and atherosclerotic diseases, the following ratios were calculated: an atherogenic index (AI), as AI = (TC – HDL cholesterol)/HDL cholesterol (Rosenfeld et al., 1989), and LDL/HDL cholesterol ratio. On the last day of the study, after overnight fast and free access to water, rats were anesthetized, with an application of ketamine (75 mg/ml) and xylazine (5 mg/ml), and sacrificed. The blood samples were collected by cardiac puncture, centrifuged at 4000 rpm/5 min and plasma was used for the determination of biochemical parameters. The liver and abdominal aorta were collected and preserved in a 10 % buffered neutral formalin solution for histological analysis.
2.5 Thickness of the abdominal aorta
One cross-sectional segment was taken from the abdominal aorta and further processed with standard histotechnological procedure to obtain slides for quantitative histological analysis. The latter included measurement of the overall wall thickness (tunica intima, media, and adventitia), as well as the separate measurements of the tunica intima layer, and the joint tunica intima and tunica media (Altaweel et al., 2021; Surówka et al., 2022). Measurements were performed using image processing and analysis software (Modular software for interactive image processing and analysis - ELLIPSE Version 2.0.8.1.) and were expressed in micrometers (µm).
2.6 Liver histology
Two segments of the liver were taken from the left and medial hepatic lobe. The segments were then processed by a standard histotechnological procedure. Five micrometers thick sections were stained with the hematoxylin-eosin method (Ruehl-Fehlert et al., 2003). Histological analysis was performed using a light microscope (Eclipse E400, Nikon).
2.7 Satistical analysis
The Statistical Package for Social Sciences (SPSS) program, version 19.0 (SPSS Inc, Chicago, Illinois, SAD) was used for statistical analysis. Symmetry of the distribution of each numerical variable was analyzed by the Kolmogorov-Smirnov test. Numerical variables with symmetrical distributions (TC, TG, HDL, LDL, non-HDL, ALT, AST, GC, TP, AI, LDL/HDL ratio) were presented by the mean and standard deviation while numerical variables with skewed distribution (body weight and abdominal aorta wall thickness) were presented by the median and interquartile range (25th-75th percentile). The comparison of variables between two independent samples was performed by parametric Student's t-test for 2 independent samples (for variables with symmetrical distributions) or by nonparametric Mann-Whitney U test (for variables with skewed distributions). The comparison of variables between more than 2 dependent samples was performed by parametric repeated measures ANOVA (for variables with symmetrical distributions) or by nonparametric Friedman test (for variables with skewed distributions). Accepted statistical significance was at the level of p < 0.05.
3 Results
3.1 Body weight
The body weight of the SD and AD groups measured on Days 1, 7, 14, 21, and 28 are shown in Fig. 1. An increase in body weight was observed in both the SD and AD groups. The highest body weight values as well as the constant increase in body weight during the study period were recorded in the AD group. The Friedman's repeated measurements test showed a significant trend of weight changes in both the SD (χ2 = 36.094; p < 0.05) and AD (χ2 = 47.267; p < 0.05) group.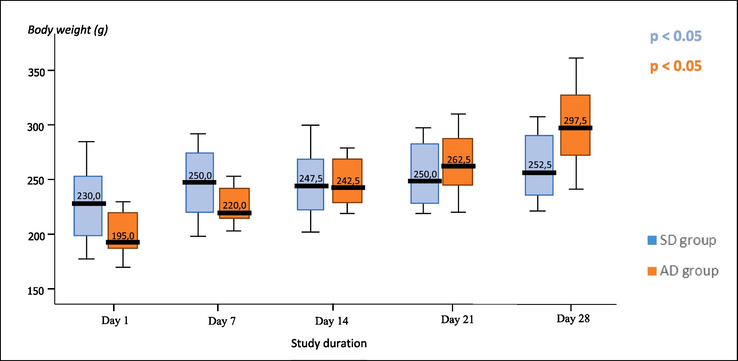
Effects of standard rodent diet (SRD) and atherogenic rodent diet (ARD) on the body weight (g) of rats in the standard diet (SD) and atherogenic diet (AD) group measured on Days 1, 7, 14, 21, and 28 of the study.
3.2 TC and TG values
The levels of TC in the SD and AD groups measured on Days 1, 14, and 28 are shown in Fig. 2, while the levels of TG in the same groups measured at the same time points are shown in Fig. 3. No significant change in TC and TG values after being fed with SRD for 2 weeks, i.e. Day 1 vs. Day 14, was found (p > 0.05). Also, after further feeding with SRD for the next two weeks TC and TG values remained unchanged (Day 14 vs Day 28, p > 0.05). Significantly elevated levels of TC and TG values after being fed with ARD for 2 weeks, i.e. day 1 vs. day 14, were found (p < 0.05). Also, further feeding with ARD for the additional two weeks resulted in a significant increase in TC and TG values (Day 14 vs Day 28, p < 0.05). A significant difference in TC and TG values between the SD and AD groups was measured on Day 14. (p < 0.05) and Day 28. (p < 0.05) was found.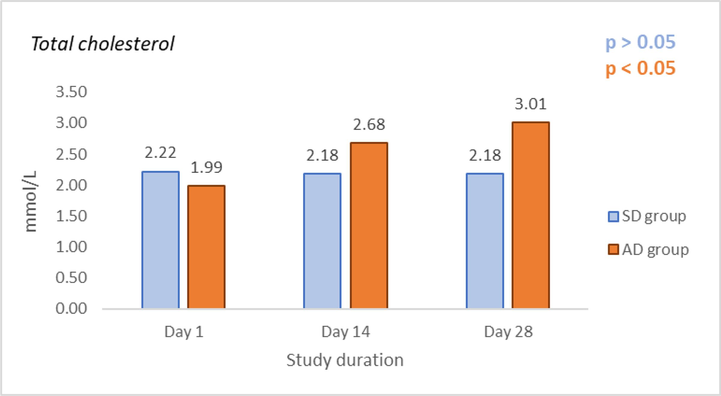
Effects of standard rodent diet (SRD) and atherogenic rodent diet (ARD) on values of total cholesterol (TC) (mmol/L) in the standard diet (SD) and atherogenic diet (AD) group on Day 1, 14, and 28 of the study.
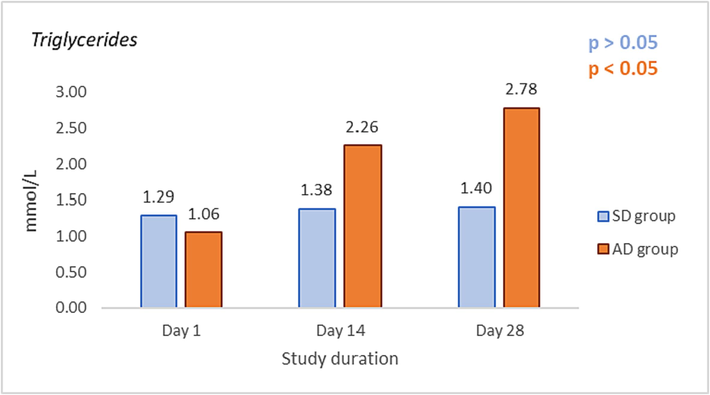
Effects of standard rodent diet (SRD) and atherogenic rodent diet (ARD) on values of triglycerides (TG (mmol/L) in the standard diet (SD) and atherogenic diet (AD) group on Day 1, 14, and 28 of the study.
3.3 Biochemical parameters
The values of biochemical parameters in SD and AD groups measured on Day 28 are shown in Table 2. Feeding rats for 28 days with ARD significantly elevated values of LDL, non-HDL, AI, LDL/HDL ratios, GC, and ALT, while significantly decreasing values of HDL compared to the SD group (p < 0.05). No significant change was observed between SD and AD groups in TP and AST values (p > 0.05). AD - atherogenic diet group; AI – atherogenic index; ALT - alanine transaminase; AST - aspartate transaminase; GC – glucose; HDL - high-density lipoprotein cholesterol; LDL - low-density lipoprotein cholesterol; SD - standard rdiet group; TP - total protein
Parameter
(Day 28)SD group
(mean ± SD)AD group
(mean ± SD)Sig.
(p-value)
HDL (mmol/L)
0.57 ± 0.05
0.45 ± 0.04
0.0001
LDL (mmol/L)
0.97 ± 0.43
1.30 ± 0.12
0.0001
non-HDL (mmol/L)
1.61 ± 0.41
2.56 ± 0.17
0.0001
TP (g/L)
67.25 ± 3.77
73.50 ± 11.62
0.315
GC (mmol/L)
7.20 ± 0.90
8.0 ± 0.80
0.0001
ALT (U/L)
60.50 ± 9.06
75.08 ± 9.48
0.008
AST (U/L)
129.58 ± 22.33
131.77 ± 21.40
1.000
AI
2.82 ± 0.69
5.78 ± 0.51
0.0001
LDL/HDL ratio
1.69 ± 0.71
2.93 ± 0.33
0.0001
3.4 Thickness of the abdominal aorta
Results of morphometric measurements of the abdominal aorta wall in the SD and AD groups are presented in Fig. 4. A significant increase in the thickness of the tunica intima layer was found in AD compared to SD groups (p < 0.05). No significant difference was observed in the thickness of both tunica intima and media and an entire wall between groups (p >0.05).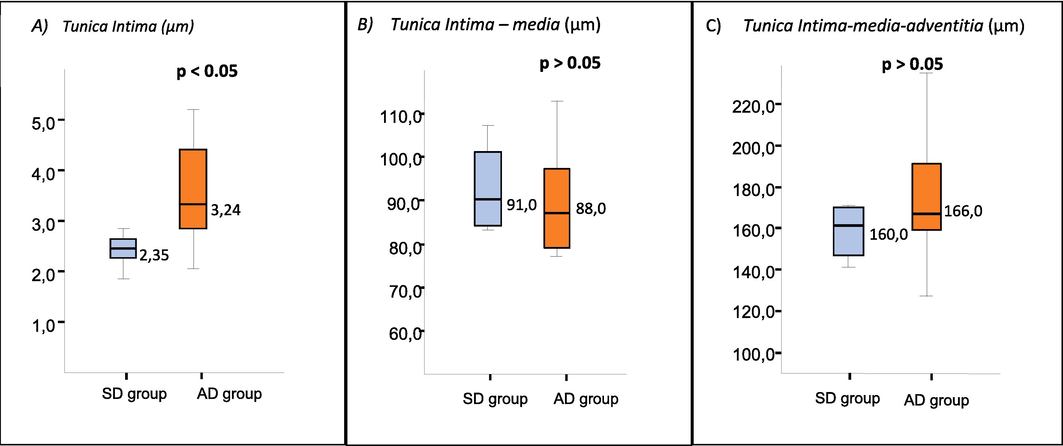
Morphometric measurement of tunica intima layer (A), tunica intima-media layer (B), and tunica intima-media-adventitia layer (C) for standard diet (SD) and atherogenic diet (AD) group on Day 28 of the study.
3.5 Liver histology
Qualitative histological analysis of liver parenchyma and stroma revealed preserved architecture in rats fed with SRD for 28 days (Fig. 5). In the AD group, hepatocytes were altered predominantly in a centrilobular region with coarse and fine vacuolization of their cytoplasm, while stroma was relatively preserved (Fig. 6).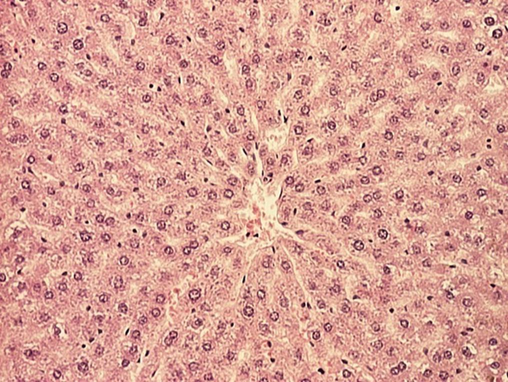
Normal appearance of liver lobule in rats fed with standard rodent diet for 28 days (HE,100x).
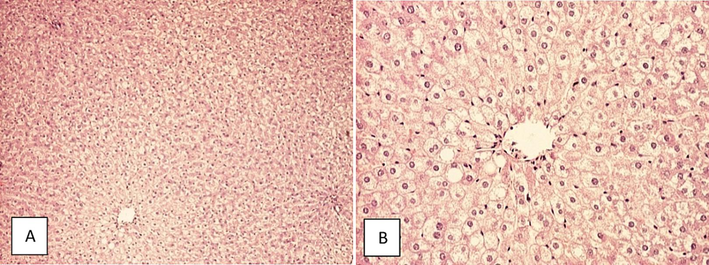
Vacuolization of hepatocyte cytoplasm in rats fed with atherogenic rodent diet for 28 days (A) HE, 40x (B) HE, 100x.
4 Discussion
In order to develop a more reliable and replicable model of hyperlipidemia, our study focuses on providing precise and sufficient data for the development of an atherogenic diet-induced model of hyperlipidemia in Wistar rats and its effects on biochemical and histological parameters as well as on the thickness of the abdominal aorta. The obtained results of the lipid profile and selected parameters from our study confirm the establishment of a diet-induced model of hyperlipidemia in Wistar rats and prove the suitability of our model for future testing and proving the effectiveness of lipid-lowering agents. While there are a number of previously documented experimental diet-induced studies of hyperlipidemia in animals, an evident lack of data in their protocols is present as well as a lack of data about the impact of the model itself (Cunha et al., 2021).
In our study, the diet-induced model of hyperlipidemia is improved not only by adding lard and coconut oil to a commercial atherogenic diet but also by providing and monitoring biochemical and histological changes provoked by the induction of hyperlipidemia. Therefore, feeding rats with an ARD for 14 days resulted in the successful development of hyperlipidemia, as the TC and TG values were significantly increased (Fig. 2) (Fig. 3). Also, further feeding with an ARD for a total of 28 days resulted in significantly increased levels of TC, TG, LDL, non-HDL, and decreased levels of HDL compared to rats fed with SRD. It is well documented that elevated levels of lipid parameters, particularly values of TC and TG, are major hyperlipidemic markers. Hyperlipidemia is an extremely common condition and recent evidence suggests that patients diagnosed with hyperlipidemia are twice as likely to develop CVDs due a to well-established association between elevated lipid levels and the risk of CVDs (Andreadou et al., 2020; Hill and Bordoni, 2022; Yao et al., 2020; Murphy et al., 2012; Jellinger et al., 2012). Moreover, our results showed a significant increase in AI and LDL/HDL ratio compared to the SD group. The AI, which is composed of TG and HDL cholesterol, is an important predictor for assessing the risk of atherogenicity and CVDs (Kim et al., 2022). Also, feeding rats with an ARD resulted in higher body weight gain compared to rats fed with SRD. However, both groups demonstrated weight gain throughout the period of feeding. An exception was noticed in the SD group on Day 14 of feeding, where the body weight of rats decreased. This can be explained by various factors such as daily variation of body mass, dynamics of food and water intake, and environmental and psychological stressful influences.
Various studies have shown that factors, such as age, diet duration, and dietary composition, significantly influence the process of inducing hyperlipidemia in rats (Udomkasemsab and Prangthip, 2019; Sasidharan et al., 2013; Zaman et al., 2011). In addition to a diet with increased content of cholesterol, supplements of cholic acid, as used in our study, are applied due to their emulsifying activity which increases the absorption of cholesterol from the gastrointestinal tract (Balkan et al., 2004; Vergnes et al., 2003). High-fat ingredients such as lard, coconut oil, soybean, or palm oil, are also used as an adjunct to diets to increase lipids values and the risk of atherosclerosis (Feingold et al., 2021) and therefore, we added lard and coconut oil to a commercially available atherogenic diet (Table 1).
Similar diet-induced models of hyperlipidemia were applied by other researchers but with different types and percentages of ingredients as well as different durations of feeding. Munshi et al. performed a 6-week long feeding with a high-fat and high-sugar diet (Munshi et al., 2014). While Arafa, 2015 performed only 7 days of feeding with a high cholesterol diet, however, no change was observed in TG levels (Arafa, 2005). According to a recent review, the shortest duration of the study was 15 days and the most commonly used addition of cholesterol was 1 % cholesterol or 2 % cholesterol + 0.5 % cholic acid (Cunha et al., 2021). Similar to our 14-day period of induction, Beynen et al. reported successful induction of hyperlipidemia in rats after 13 days of feeding with a diet containing 2 % cholesterol and 0.5 % cholate which is a higher percentage of cholesterol content and cholic supplement than in our study (Beynen et al., 1984).
Induction of hyperlipidemia provokes an increase in hepatic transaminase levels due to the injured hepatic cells and intracellular accumulation of lipids (Hasan et al., 2018; Kakimoto and Kowaltowski, 2016). In almost all liver diseases, ALT values are higher than AST values due to an ALT longer circulating half-life, which makes ALT a more liver-specific marker (Vuppalanchi and Chalasani, 2011). Expectedly, feeding rats with ARD for 28 days resulted in significantly higher serum levels of ALT compared to the SD group, while serum levels of AST remained without significant increase.
Alterations in levels of ALT and AST suggest liver damage which is proven in our study by qualitative histological analysis of the liver that revealed altered morphological properties of hepatocytes in AD in comparison to the SD group. Morphometric measurement of the thickness of the abdominal aorta, which is a significant marker of preclinical atherosclerosis and indicator of wall damage due to plaque formation (Järvisalo et al., 2001), demonstrated a significant increase in thickness of only the tunica intima layer in AD compared to SD groups. This result is expected considering that the ARD feeding period of 28 days is short. Moreover, a longer period of feeding also did not demonstrate the complete thickness of the aortic wall as noted in a study by Saleh et al., where 56 days only resulted in a significant increase of tunica intima and media (Saleh et al., 2019).
4.1 Limitations
One of the major limitations of this study was the lack of baseline measurements of the majority of biochemical parameters. The second limitation is the lack of precise food intake monitoring. Thirdly, as other models did not include time points of parameter monitoring, we were not able to conduct a direct comparison with other diet-induced models of hyperlipidemia. Also, previous models exhibited non-uniform characteristics such as species, age, diet duration, and dietary composition.
5 Conclusion
In conclusion, our results confirm the successful improvement of the diet-induced model of hyperlipidemia which is suitable for future testing and proving the effectiveness of lipid-lowering agents as well as screenings of potentially new ones. Contrary to existing models, our model is more detailed and provides better insight into pathophysiological changes, and is comparable with the development of hyperlipidemia in humans. Further research work should focus on the investigating most common disorders associated with the development of hyperlipidemia that trigger related markers such as markers of oxidative stress and inflammation.
Disclosure of funding
This research did not receive any specific grant from funding agencies in the public, commercial, or not-for-profit sectors.
Declaration of competing interest
The authors declare that they have no known competing financial interests or personal relationships that could have appeared to influence the work reported in this paper.
References
- The effects of irisin on the rat thoracic aorta: a histological study. Folia Morphol. (warsz). 2021;81(4):923-930.
- [CrossRef] [Google Scholar]
- Hyperlipidaemia and cardioprotection: Animal models for translational studies. Br. J. Pharmacol.. 2020;177:5287-5311.
- [CrossRef] [Google Scholar]
- Curcumin attenuates diet-induced hypercholesterolemia in rats. Med. Sci. Monit.. 2005;7:228-234.
- [Google Scholar]
- The effects of high cholesterol diets on lipids and oxidative stress in plasma, liver and aorta of rabbits and rats. Nutr. Res.. 2004;24:229-234.
- [Google Scholar]
- Pathophysiology and treatment of atherosclerosis. Neth. Hear. J.. 2017;25:231-242.
- [CrossRef] [Google Scholar]
- Cholesterol Metabolism in Two Strains of Rats with High or Low Response of Serum Cholesterol to a Cholesterol-Rich Diet. J. Nutr.. 1984;9:1640-1650.
- [CrossRef] [Google Scholar]
- Cunha, L.F., Ongaratto, M.A., Endres, M., Barschak, A.G., 2021. Modelling hypercholesterolaemia in rats using high cholesterol diet. Int. J. Exp. Path 102, 74–79. https://doi.org/10.1111%2Fiep.12387.
- The Effect of Diet on Cardiovascular Disease and Lipid and Lipoprotein Levels. In: Feingold K.R., Anawalt B., Blackman M.R., eds. Endotext. South Dartmouth (MA): MDText.com Inc; 2021.
- [Google Scholar]
- Estimation of the concentration of low-density lipoprotein cholesterol in plasma, without use of preparative ultracentrifuge. Clin. Chem.. 1972;18:499-502.
- [Google Scholar]
- Biochemical and histopathological profiling of Wistar rat treated with Brassica napus as a supplementary feed. Food Sci. Human Wellness. 2018;7:77-82.
- [CrossRef] [Google Scholar]
- International Guiding Principles for Biomedical Research Involving Animals, 2012. https://olaw.nih.gov/sites/default/files/Guiding_Principles_2012.pdf (accessed 8 November 2022).
- AACE Task Force for Management of Dyslipidemia and Prevention of Atherosclerosis. American Association of Clinical Endocrinologists' Guidelines for Management of Dyslipidemia and Prevention of Atherosclerosis. Endocr. Pract.. 2012;18:1-78.
- [CrossRef] [Google Scholar]
- Effects of high fat diets on rodent liver bioenergetics and oxidative imbalance. Redox Biol.. 2016;8(216–225):216-225.
- [CrossRef] [Google Scholar]
- Association of the atherogenic index of plasma with cardiovascular risk beyond the traditional risk factors: a nationwide population-based cohort study. Cardiovasc. Diabetol.. 2022;21:81.
- [CrossRef] [Google Scholar]
- New and emerging lipid-modifying drugs to lower LDL cholesterol. Drugs Context. 2021;10:1-22.
- [CrossRef] [Google Scholar]
- High fat diet induced obesity model using four strains of mice: Kunming, C57BL/6, Balb/c and ICR. Exp. Anim.. 2020;69(326–335):326-335.
- [CrossRef] [Google Scholar]
- Curbing the obesity epidemic in China. Lancet Diabetes Endocrinol.. 2016;4:470-471.
- [CrossRef] [Google Scholar]
- High-fat diet-induced obesity Rat model: a comparison between Wistar and Sprague-Dawley Rat. Adipocyte. 2015;15:11-21.
- [CrossRef] [Google Scholar]
- Development of an experimental diet model in rats to study hyperlipidemia and insulin resistance, markers for coronary heart disease. Indian J. Pharmacol.. 2014;46:270-276.
- [CrossRef] [Google Scholar]
- Murphy, S.L., Xu, J.Q., Kochanek, K.D., 2012. Deaths: Preliminary data for 2010. National vital statistics reports, Table B. Hyattsville, MD: National Center for Health Statistics. https://www.cdc.gov/nchs/data/nvsr/nvsr60/nvsr60_04.pdf.
- Current Options and Future Perspectives in the Treatment of Dyslipidemia. J. Clin. Med.. 2022;11:e4716.
- [Google Scholar]
- Animal models of human atherosclerosis: current progress. Braz. J. Med. Biol. Res.. 2020;53:e9557.
- [Google Scholar]
- Global Burden of Cardiovascular Diseases and Risk Factors, 1990–2019: Update From the GBD 2019 Study. J. Am. Coll. Cardiol. 2020
- [CrossRef] [Google Scholar]
- Revised guides for organ sampling and trimming in rats and mice–part 1. Exp. Toxicol. Pathol.. 2003;55(2–3):91-106. PMID: 14620530
- [Google Scholar]
- Comparative Histological and Immunohistochemical Study on The Effect of Curcumin and Atorvastatin in Induced Atherosclerosis in Aorta and Cardiac Muscle of Male Rabbits. Egypt. J. Hosp. Med.. 2019;76:3500-3515.
- [Google Scholar]
- An experimental approach for selecting appropriate rodent diets for research studies on metabolic disorders. BioMed. Res. Int.. 2013;2013:752870
- [CrossRef] [Google Scholar]
- Influence of dietary fat composition on development of insulin resistance in rats. Relationship to muscle triglyceride and omega-3 fatty acids in muscle phospholipid. Diabetes. 1991;40:280-289.
- [CrossRef] [Google Scholar]
- The Effect of Chronic Immunosuppressive Regimens Treatment on Aortal Media Morphology and the Balance between Matrix Metalloproteinases (mmp-2 and mmp-9) and Their Inhibitors in the Abdominal Aorta of Rats. Int. J. Environ. Res. Public Health. 2022;19(11):6399.
- [CrossRef] [Google Scholar]
- High fat diet for induced dyslipidemia and cardiac pathological alterations in Wistar rats compared to Sprague Dawley rats. Clin. Investig. Arterioscler.. 2019;31:56-62.
- [CrossRef] [Google Scholar]
- Increased food energy supply as a major driver of the obesity epidemic: a global analysis. Bull. World Health Organ.. 2015;93:446-456.
- [CrossRef] [Google Scholar]
- Cholesterol and cholate components of an atherogenic diet induce distinct stages of hepatic inflammatory gene expression. J. Biol. Chem.. 2003;278:42774-42784.
- [CrossRef] [Google Scholar]
- Vuppalanchi, R., Chalasani, N., 2011. Laboratory Tests in Liver Disease, Editor(s): Romil Saxena, Practical Hepatic Pathology: A Diagnostic Approach, W.B. 55-62.
- World Health Organization (WHO) reveals leading causes of death and disability worldwide: 2000–2019. 2020. https://www.who.int/news/item/09-12-2020-who-reveals-leading-causes-of-death-and-disability-worldwide-2000-2019; (accessed 10 January 2023).
- Mechanisms underlying direct actions of hyperlipidemia on myocardium: an updated review. Lipids Health Dis.. 2020;19:23.
- [CrossRef] [Google Scholar]
- Lipid profile and insulin sensitivity in rats fed with high-fat or high-fructose diets. Br J Nutr. 2011;106:206-210.
- [CrossRef] [Google Scholar]
Appendix A
Supplementary data
Supplementary data to this article can be found online at https://doi.org/10.1016/j.jksus.2023.103068.
Appendix A
Supplementary data
The following are the Supplementary data to this article:


