

Identification of MAGE-A family genes in colon cancer patients and their expression mechanism
⁎Corresponding author. malmutari@ksu.edu.sa (Mikhlid H. Almutairi)
-
Received: ,
Accepted: ,
This article was originally published by Elsevier and was migrated to Scientific Scholar after the change of Publisher.
Peer review under responsibility of King Saud University.
Abstract
Colon cancer (CC) is a more frequent cancer type among men and is the third one among women. Cancer testis (CT) genes are classically expressed in the testes during postnatal life. However, they may be abnormally expressed in several types of cancers. The general purpose of this study was to look at the expressions of MAGE-A family genes, an example of the CT gene, in several patients with CC to evaluate whether they may be used as cancer biomarkers in the early stages of cancer identification and improve treatment options.
In this study, MAGE-A family genes were examined using RT-PCR in 10 matching CC and normal colon (NC) samples. Also, the influence of DNA demethylation on the expression status of MAGE-A genes was assessed by treating the human CC cell lines with different doses of 5-aza-2′-deoxycytidine (1.0, 5.0, and 10.0 µM) for 48 or 72 h.
All MAGE-A family gene results had faint bands in different samples of NC tissues, except for MAGE-A1. MAGE-A2, MAGE-A3, MAGE-A4, MAGE-A6, MAGE-A8, MAGE-A9, MAGE-A10, MAGE-A11, and MAGE-A12 genes were observed in 20 %, 60 %, 50 %, 80 %, 90 %, 60 %, 40 %, 30 %, and 40 % of the NC samples, respectively. However, they had strong bands in multiple samples of CC tissues with 80 %, 70 %, 60 %, 100 %, 100 %, 80 %, 60 %, 30 %, and 70 % of CC samples, respectively. Interestingly, MAGE-A1 was detected in 50 % of CC tissues but not in NC tissues, making this gene a suitable potential biomarker for early CC diagnosis. No expression of MAGE-A1 was detected in the Caco-2 cells after 48 h of treatment. However, the MAGE-A1 gene had faint bands after treatment of Caco-2 cells with 1–10 µM of 5-aza-2′-deoxycytidine for 72 h. In HCT116 cells, the MAGE-A1 gene had faint bands after 48 h and moderate-intensity bands 72 h after treating cells with 1–10 µM of -aza-2′-deoxycytidine. MAGE-A3 and MAGE-A4 were expressed after treating the Caco-2 cells with 1–10 µM 5-aza-2′-deoxycytidine for 48 or 72 h. Further protein-level tests and a larger cohort of patients are needed to assess this finding.
Keywords
MAGE-A
Biomarker
Gene expression
Colon cancer

1 Introduction
Colon cancer (CC) is a very heterogeneous disease influenced by the accumulation of genetic and epigenetic alterations, resulting in the transformation of normal colonic mucosa into aggressive cancer (Sang et al., 2011). It is the fourth type of cancer responsible for causing most deaths globally (Brody, 2015). According to the World Health Organization, newly-diagnosed CC cases and deaths are estimated to increase by 77 % and 80 %, respectively, by 2030 (Binefa et al., 2014). In Saudi Arabia, CC is a more frequent cancer type among men and is third one among women. The age frequency of the disease in Saudi men and women is between 55 and 58 years (Alsanea et al., 2015). The increased incidence of CC cases in the Saudi population is influenced by several environmental factors, such as a lack of physical activity, excess weight or obesity, and smoking (Al-zalabani, 2020). However, genetic susceptibilities among Saudi individuals require more investigation to enhance our understanding of the major risk factors associated with CC disease.
Several studies aimed to determine molecular cancer markers have been conducted in the last few decades. However, only a few such markers have clinically caught attention to improve the diagnosis process, as certain cancer-testis antigens (CTAs) are significantly expressed in CC tissues (Li et al., 2005, Shantha Kumara et al., 2012). Cancer-testis (CT) genes are classically expressed in the testes during postnatal life. However, they may be abnormally expressed in several types of cancers. More than 100 CT genes have been described to date, and their unique expression sequences can be used as markers of malignancies (Suyama et al., 2010, Gjerstorff et al., 2015). Despite their involvement in spermatogenesis and fertilization, the biological roles of several CTAs are still poorly understood. However, CT expression has diverse occurrences within different tumor types, such as ovarian, colon cancers, and melanoma (Hofmann et al., 2008, Caballero and Chen, 2012). Abnormal expression of these CT in cancer tissue might play a key role in tumor development, proliferation, and anti-apoptotic mechanisms (Gibbs and Whitehurst, 2018). Once CT is typically expressed in testes described in immunologically privileged areas, their expression in cancer cells may provoke immune responses (Jäger et al., 1998). Therefore, their presentation on cancer cells could be clinically significant as an effective immune-based anticancer approach. MAGE proteins are the best characterized and functional of CTAs due to their immunological importance and involvement in cancer cell survival (Tarnowski et al., 2016). They are also linked with aggressive cancers, poor clinical prognosis, enlarged tumor growth, metastases, and enrichment in stem cell-like populations (Sang et al., 2011). Some MAGE proteins have been found in previous studies as non-overlapping oncogenic driver activity, which might provide a novel approach to improving cancer-specific therapies [21]. For example, the interface of p53 with chromatin has been found to be directly inhibited by MAGE-A proteins, resulting in inhibition of its effect as a transcriptional regulator (Marcar et al., 2010). Generally, MAGE genes have been reported to be primarily expressed in several tumor types, such as colon (Mori et al., 1996), melanoma (Barrow et al., 2006), brain [5], lung (Kim et al., 2012), prostate (Karpf et al., 2009), and breast (Ayyoub et al., 2014). In several studies, the expression of MAGE genes has also been detected in a wide range of cancers among different populations, including Taiwanese, Japanese, Koreans, and Chinese patients (Chung et al., 2010, Takami et al., 2013, Wang et al., 2004a).
Human MAGE family members are broadly divided into MAGE-A, MAGE-B, and MAGE-C subfamilies and are primarily expressed in a wide array of cancers. Despite the high sequence and structural similarities, each member of MAGE-A has a different function (Lee and Potts, 2017). MAGE-A is also highly linked with a malignant phenotype in breast cancer, bladder cancer, melanoma, oral cancer, lung cancer, and colorectal cancers (Shantha Kumara et al., 2012, Hou et al., 2014).
MAGE-A genes were found by Van der Bruggen et al. in 1991, while investigating tumor antigens in melanoma cells (Bruggen et al., 1991). They are a family of more than 12 strictly connected genes located on the long arm of the X chromosome (region Xq28). However, only MAGE-A1, -A2, -A3, -A4, -A6 and -A12 have been found to be expressed in a variety of tumors (Fenton et al., 1998). MAGEA9 expression was also upregulated in CC. The expression of different MAGEA gene family members can strongly interrelate (Bredenbeck et al., 2008). MAGE‐A1 expression was observed in esophageal squamous cell carcinoma (Anvari et al., 2017) and lung cancer (Fanipakdel et al., 2019).
The expression of several CT genes is regulated by DNA methylation. DNA methylation is mainly carried out by DNA methyltransferase enzymes (DNMTs) in the gene promoter region (Lian et al., 2018). DNA hypomethylation is the most often documented mechanism for gene expression activation in many cancer types (Wang et al., 2004b). The expression of some CT genes is reportedly promoted by DNA hypomethylation, such as the cancer-associated gene (CAGE) in gastric cancer (Lee et al., 2006). The treatment of tumor cells with a DNA methyltransferase 1 inhibitor (DNMTi), the DNA methyltransferase inhibitor 5-aza-2′-deoxycytidine (Grunwald et al., 2006, Wang et al., 2004b), can induce the expression of CT genes, such as SSX and NY-ESO-1 (Akers et al., 2010). Additionally, treating different human ovarian and CC cell lines with 5-aza-2′-deoxycytidine increases the mRNA expression of different CT genes (Adair and Hogan, 2009, Almatrafi et al., 2014). Because CC is more difficult to treat at later stages, late detection is one of the primary reasons for increased mortality from this malignancy in Saudi Arabia. Therefore, the general purpose of this study was to look at the expressions of the MAGE-A family gene in several patients with CC to evaluate whether they may be used as cancer biomarkers in the early stages of cancer identification and improve treatment options.
2 Materials and methods
2.1 Specimen collection and ethical approval
A total of 10 male Saudi patients, containing 10 matching normal colon (NC) and colon cancer (CC) tissues were sampled in this study. None of the CC patients received any medical treatment, such as chemotherapy, radiotherapy, and/or immunotherapy. Fresh tissue CC specimens and matched neighboring NC tissues were collected in separate sterile tubes containing RNAlater stabilization solution to preserve and stabilize the RNA (Thermo Fisher; 76106).
Ethical approval was obtained from the Al-Imam Muhammad Ibn Saud Islamic University Ethics Committee, with IRB number HAPO-01-R-011 (Project number: 56–2020). Each participant completed a survey and signed a written informed consent form. Participants were asked to complete a self-administered questionnaire that included questions about their age, family history of cancer, personal medical history, and social behaviors, such as smoking and alcohol usage.
2.2 Primer design for MAGE-A family genes
The database from the National Center for Biotechnology Information's (https://www.ncbi.nlm.nih.gov/) has specific gene sequences. Intron-spanning primers were created for each gene to eliminate false positives owing to probable genomic DNA contamination. Primer-BLAST software (https://www.ncbi.nlm.nih.gov/tools/primer-blast/) was used to construct individual primers for each gene. All primers used in this work were manufactured by Macrogen (https://dna.macrogen.com/) and diluted in sterile distilled water to a final concentration of 10 pmol. The primer sequences for each MAGE-A family gene and their expected sizes are shown in Table 1.
| Official gene | Primer direction |
Primer sequence (from 5′→3′) | Ta* | Productsize (bp) |
|
|---|---|---|---|---|---|
| Symbol | Full name | ||||
| ACTB | Actin beta | Forward | AGAAAATCTGGCACCACACC | 58 | 553 |
| Reverse | AGGAAGGAAGGCTGGAAGAG | ||||
| MAGE-A1 | MAGE family member A1 | Forward | CCCACTACCATCAACTTCAC | 676 | |
| Reverse | CTCTTGCACTGACCTTGATC | ||||
| MAGE-A2 | MAGE family member A2 | Forward | CGCTTCTTCCTCTTCTACTC | 317 | |
| Reverse | GGCAATTTCTGAGGACACTC | ||||
| MAGE-A3 | MAGE family member A3 | Forward | CTCCTCCTCTTCTACTCTAG | 582 | |
| Reverse | CCCTCAAACACCTCTAACAC | ||||
| MAGE-A4 | MAGE family member A4 | Forward | CTACCATCAGCTTCACTTGC | 647 | |
| Reverse | CTCCAGGACTTTCACATAGC | ||||
| MAGE-A6 | MAGE family member A6 | Forward | CTCCTCCTCTTCTACTCTAG | 474 | |
| Reverse | GGCATGATCTGATTGTCACC | ||||
| MAGE-A8 | MAGE family member A8 | Forward | GTTCCAGCAGCAATGAAGAG | 377 | |
| Reverse | CATGCCCAGGACGATTATCA | ||||
| MAGE-A9 | MAGE family member A9 | Forward | CCTCCATTTCCGTCTACTAC | 475 | |
| Reverse | CTCAACGCTTCCCAGATAAC | ||||
| MAGE-A10 | MAGE family member A10 | Forward | TGGTGCAGTTTCTGCTCTTC | 472 | |
| Reverse | CACAGAAACTCATACCGTGC | ||||
| MAGE-A11 | MAGE family member A11 | Forward | CAGGTGAGCACTATGTTCTC | 478 | |
| Reverse | TCCCAAAGATGGCATCCATG | ||||
| MAGE-A12 | MAGE family member A12 | Forward | CTGGAGTCAATCCGATGAGG | 491 | |
| Reverse | TGGGATGCGCAAAGACACTG | ||||
| Ta* - Annealing temperature for each gene | |||||
2.3 Sources and culturing of human CC cell lines HCT116 and Caco-2
HCT116 and Caco-2 cell lines were purchased from the American Type Culture Collection (ATCC, Manassas, VA, USA). They were maintained at 37 °C in a humidified atmosphere containing 5 % CO2 and passaged according to the dilutions and confluences suggested by ATCC. The cell lines were cultured in a DMEM medium (Thermo Fisher Scientific; 61965026) with 10 % fetal bovine serum (FBS) (Thermo Fisher Scientific; A3160801).
2.4 HCT116 and Caco-2 cell lines treated with various doses of 5-aza-2′ deoxycytidine
A demethylating compound (5-aza-2′ deoxycytidine) was used to treat the HCT116 and Caco-2 cell lines (Sigma; A3656). Giving cells varied dosages of 5-aza-2′ deoxycytidine (1.0, 5.0, and 10.0 μM) for 48 or 72 h. The media were replaced every 24 h with fresh media containing 5-aza-2′ deoxycytidine.
2.5 Total RNA extraction and cDNA preparation
The All Prep DNA/RNA Mini Kit (Qiagen; 80204) was used to extract total RNA from NC, and CC samples (around 50 mg) and cultured cells (around 5 × 10⁶ cells), according to the manufacturer’s instructions. A Nano-Drop8000 spectrophotometer was used to determine the concentration, purity, and quality of the isolated RNAs (Thermo Fisher Scientific, Waltham, MA, USA). According to the manufacturer’s instructions, 1 μg of RNA was reverse transcribed into cDNA using a High-Capacity cDNA Reverse Transcription Kit (Applied Biosystems; 4368814) from each sample. The cDNA was then diluted at a 1:10 concentration and stored at −20 °C until needed.
2.6 RT-PCR and gel electrophoresis
One microliter of diluted cDNA (100 ng), 1 μl of each primer (10 pmol), and 15 μl of BioMix Red (BioLine; BIO-25006) were mixed with distilled water to generate a final volume of 25 μl for RT-PCR. PCR setup was performed as follows: a 5 min pre-denaturation hold at 96 °C, 35 cycles of denaturing at 96 °C for 30 s, annealing temperature at 58 °C for 30 s, and extension at 72 °C for 30 s/kb were performed, followed by a 5 min final extension step at 72 °C. On 1 % agarose gels, PCR products were processed in 1X TBE buffer and stained with 0.5 g/ml ethidium bromide. Amplification of the ACTB gene was used to assess the quality of NC and CC cDNA samples. Amplification of the GAPDH gene was used to determine the quality of the treated and untreated cDNA samples. A total of 3 μl of 100 bp DNA marker (NEB; N0467) was added for PCR product size assessment.
2.7 RT-PCR product purification and sequencing
In two clean separate, Eppendorf tubes (1.5 ml), 15 μl of DNA (10 ng/μl) and 15 μl of forward and/or reverse primers (5 pmol/μl) were placed. All two tubes were sent to the Microgen for DNA sequencing. The resulting sequencing of each product was submitted to the Basic Local Alignment Search Tool (BLAST) website ( https://blast.ncbi.nlm.nih.gov/Blast.cgi) to compare a query sequence with those from the NCBI database.
2.8 GeneMANIA data analysis
GeneMANIA (Gene Function Prediction using a Multiple Association Network Integration Algorithm) is a service with which the genetic and protein relationships of target genes are analyzed, co-expression, pathways, co-localization, and domain-protein similarity (Warde-Farley et al., 2010). We investigated the link between MAGE-A family members and their interacting genes using this information.
3 Results
3.1 Demographic and clinical data
The overall demographic and clinical characteristics of the research participants are shown in Table 2. At diagnosis, the mean age of the 10 CC patients was 57 years (range: 24–83 years). A total of 50 % of CC patients were under 57 years old, and 50 % were over 57 years old. Most patients were at histological stage grade 2 (70 %), while 30 % were at grade three.
| Clinical parameters | Colon cancer N (%) |
Adjacent normal colon N (%) |
||||||||
|---|---|---|---|---|---|---|---|---|---|---|
| Participants | 10 (100 %) | 10 (100 %) | ||||||||
| Mean of age (min–max) | 57 (24–83) | |||||||||
| ≥57 | 5 (50 %) | 5 (50 %) | ||||||||
| <57 | 5 (50 %) | 5 (50 %) | ||||||||
| Histological grade of each patient | ||||||||||
| Participants | 1 | 2 | 3 | 4 | 5 | 6 | 7 | 8 | 9 | 10 |
| Histological grade | II | II | II | II | III | II | III | III | II | II |
3.2 Expression profile of MAGE-A family genes in matching CC and NC tissues
Ten MAGE-A family genes were validated by RT-PCR analysis. These genes were MAGE-A1, MAGE-A2, MAGE-A3, MAGE-A4, MAGE-A6, MAGE-A8, MAGE-A9, MAGE-A10, MAGE-A11, and MAGE-A12. Three factors were used for the selection of these genes: 1) no expressions were observed in normal tissues in the NCBI database (designated as testis-restricted), 2) their expression profile in CC tissue or cell lines, and 3) the majority of them have a relationship to malignancy.
RT-PCR validation started with the screening of MAGE-A family genes in several RNAs from 10 NC tissues to evaluate their testis specificity. The testis cDNA was produced from the total RNA of human testes and was used to validate the primer for each MAGE-A gene (Thermo Fisher Scientific; AM7972). The expression of the ACTB gene was used as a positive control to ensure that the cDNA was of good quality.
The RT-PCR screening of the MAGE-A family genes on the 10 NC tissues indicated that all these genes showed strong bands in the testis. All the MAGE-A1 family genes showed faint bands in different samples of NC tissues in NC tissues, except for MAGE-A1. For example, MAGE-A2 MAGE-A3, MAGE-A4, MAGE-A6, MAGE-A8, MAGE-A9, MAGE-A10, MAGE-A11, and MAGE-A12 genes were observed in two (20 %), six (60 %), five (50 %), eight (80 %), nine (90 %), six (60 %), four (40 %), three (30 %), and four (40 %) NC samples, respectively (Fig. 1). Also, there was an unexpectedly large and faint band for the MAGE-A1 gene in sample 7 in Fig. 1 (left). However, the sequencing of this PCR product did not match MAGE-A1, which was designated in the NC tissue panel as a testis-restricted gene.
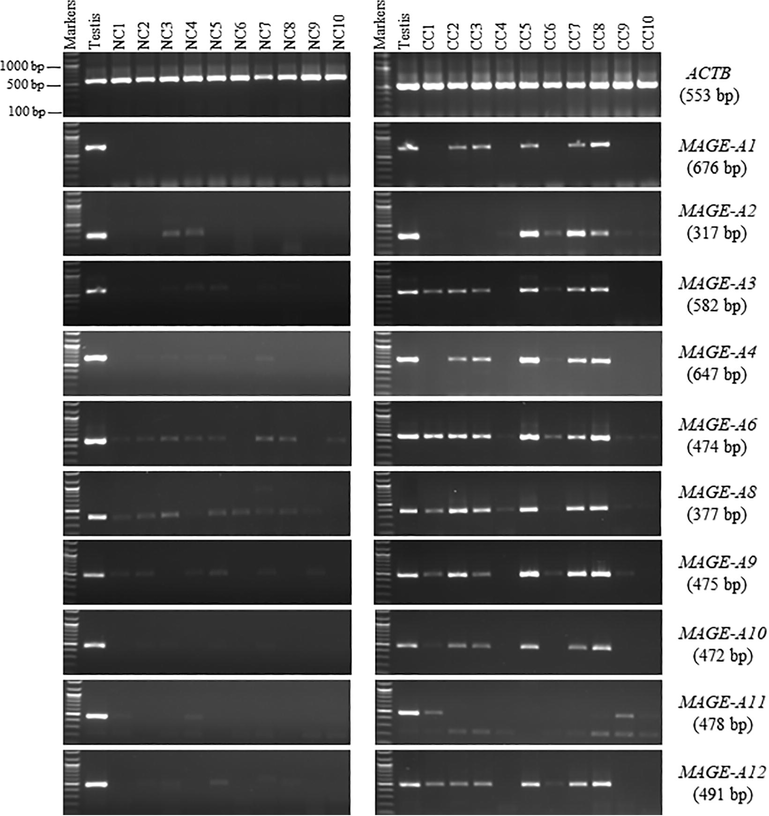
- RT-PCR expression profiles for the MAGE-A family genes matched NC and CC tissues. The MAGE-A1, MAGE-A2, MAGE-A3, MAGE-A4, MAGE-A6, MAGE-A8, MAGE-A9, MAGE-A10, MAGE-A11, and MAGE-A12 genes were analyzed using RT-PCR on 1 % agarose gels. Total RNA from 10 NC tissues (left) and 10 CC tissues (right) was used to make cDNAs. The primers for each gene were tested using testis cDNA. For the cDNA samples, ACTB expression was employed as a positive control. Each gene’s predicted product size is shown on the right between brackets.
In contrast, all MAGE-A family genes showed strong bands in multiple samples of CC tissues. MAGE-A2 MAGE-A3, MAGE-A4, MAGE-A6, MAGE-A8, MAGE-A9, MAGE-A10, MAGE-A11, and MAGE-A12 genes were detected in eight (80 %), seven (70 %), six (60 %), 10 (100 %), 10 (100 %), eight (80 %), six (60 %), three (30 %), and seven (70 %) CC samples, respectively. Interestingly, MAGE-A1 was detected in 50 % of the CC tissues but not in NC tissues. Therefore, it was considered a good candidate for the CT gene (Fig. 1, right).
3.3 Effects of 5-aza-2′-deoxycytidine treatment on MAGE-A family gene expression in CC cell lines
The influence of DNA demethylation on the expression status of MAGE-A genes was assessed by treating the human CC cell lines, including Caco-2 and HCT116, with different doses of 5-aza-2′-deoxycytidine (1.0, 5.0, and 10.0 μM) for 48 or 72 h. The MAGE-A1, MAGE-A3, and MAGE-A4 genes were chosen in this investigation. This choice was based on the expressions of these genes that cannot be seen in the untreated Caco-2 or HCT116 cancer cell lines. All cell lines treated with DMSO were used to compare gene expression, since the drugs were dissolved in DMSO. Untreated Caco-2 and HCT116 cells were also used as negative controls to compare the expression of MAGE-A genes in treated cells. The normal testis was also employed as a positive control for primer efficiency. cDNA quality was assessed using the ACTB gene. A well-known CT gene is SSX2, which was used as a positive control to evaluate its expression. Gene expressions of the MAGE-A1, MAGE-A3, and MAGE-A4 genes were examined using RT-PCR, and their results are shown in Fig. 2.
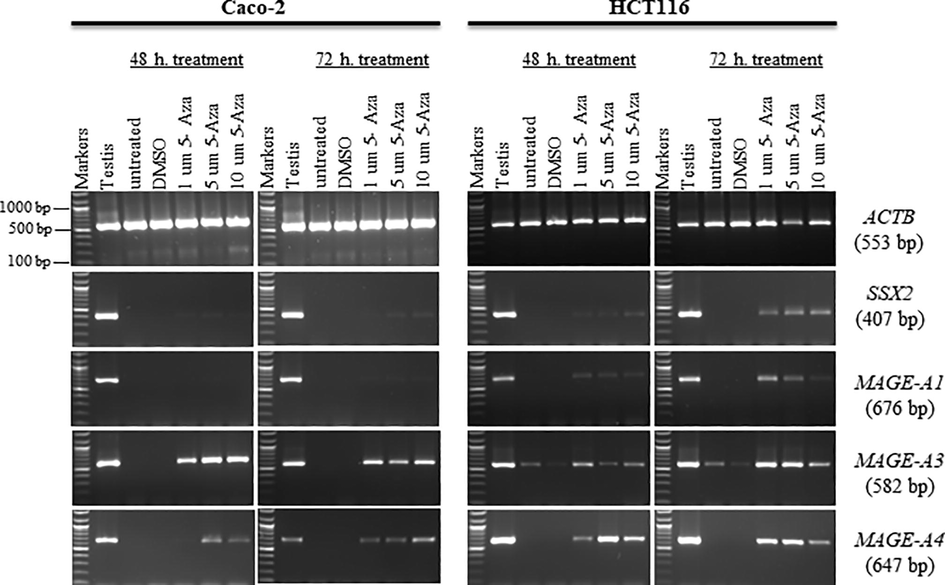
- The effects of 5-aza-2′-deoxycytidine on MAGE family gene expression in the Caco-2 and HCT116 cancer cell lines. It is shown in agarose gels that the expression of the MAGE-A1, MAGE-A3, and MAGE-A4 genes after treatment with a range of concentrations of 5-aza-2′-deoxycytidine (1.0, 5.0, and 10.0 μM) for 48 h (left) or 72 h (right). Untreated Caco-2 and HCT116 cells were used to compare with treated cells, and a testis sample served as a positive control. Control Caco-2 and HCT116 cells were treated with DMSO, since DMSO was the solvent used for the 5-aza-2′-deoxycytidine solution. Expression of the ACTB gene is the positive control of the cDNA samples. Each gene’s predicted product size is shown on the right between brackets.
No expression of MAGE-A1 was detected in Caco-2 cells after 48 h of treatment. However, the MAGE-A1 gene showed faint bands after treatment of Caco-2 cells with 1–10 μM of 5-aza-2′-deoxycytidine for 72 h. In HCT116 cells, the MAGE-A1 gene had faint bands after 48 h and moderate-intensity bands for 72 h after the treatment of cells with 1–10 µM of -aza-2′-deoxycytidine. MAGE-A3 and MAGE-A4 were expressed after treatment of Caco-2 cells with 1–10 μM 5-aza-2′-deoxycytidine for 48 or 72 h. The band intensities of MAGE-A4 in HCT116 cells treated with 5-aza-2′-deoxycytidine were higher than in treated Caco-2 cells. For MAGE-A3 in HCT116 cells, the band intensities in cells treated with 5-aza-2′-deoxycytidine were higher than in untreated cells in 48 and 72 h treatments.
3.4 Co-expression and physical interaction analysis of MAGE-A family genes
We used GeneMANIA data analysis to predict the possible gene association network and gene functions to build a network of MAGE-A family members and their functionally related genes. A total of 20 genes were revealed by the results, such as CTAG2, MAGE-B2, MAGE-A2B, GTSF1, MAGE-C1, PRAME, CTAG1A, HTR2C, SAGE1, FAM133A, TKTL1, SSX1, POTEM, CSAG1, TPTE, MAGE-C2, ZNF595, SSX3, COX7B2, and GPR158, which were mainly related to the regulatory functions of differentially expressed MAGE-A family genes (Fig. 3). Additionally, the relationship network of MAGE-A family members was shown by the analysis to be connected with co-expression, accounting for 98.08 %, and physical interactions, accounting for 1.92 %.
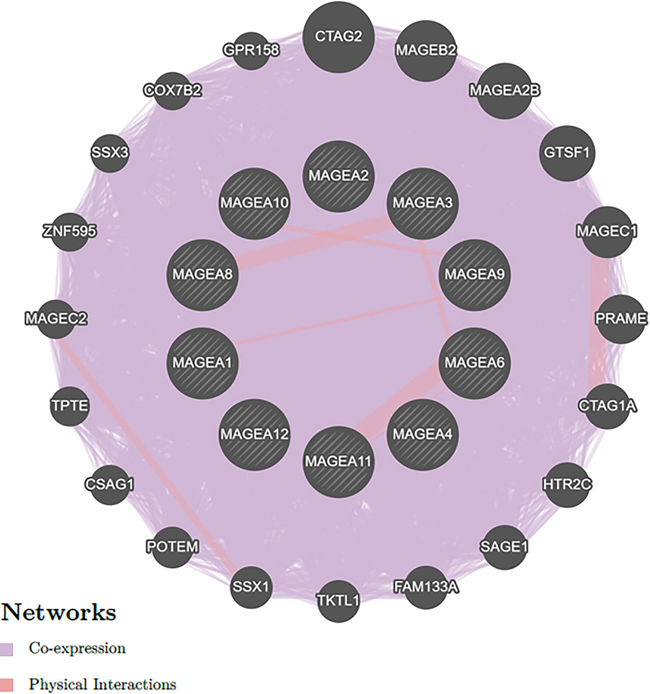
- Network analysis of the MAGE-A1, MAGE-A2, MAGE-A3, MAGE-A4, MAGE-A6, MAGE-A8, MAGE-A9, MAGE-A10, MAGE-A11, and MAGE-A12 genes using GeneMANIA. All MAGE-A family genes are represented as nodes (shown as circles), and interactions are represented as edges (shown as lines).
4 Discussion
CC is one of the primary causes of death in Saudi Arabia, primarily affecting older adults. Still, people of all ages are now affected by it (Rasool et al., 2021). Consequently, biomarkers for the early stages of CC must be identified (Kanojia et al., 2011). CT antigens have promising prognostic, diagnostic, and therapeutic implications (Hofmann et al., 2008). CT antigens are produced by the MAGE gene and expressed preferentially in various human tumors but not in normal tissues other than the testis (Hou et al., 2014). However, the expression profile of MAGE-A family genes in CC patients is unknown, especially in Saudi populations. Therefore, our research aimed to learn more about MAGE-A family gene expression profiles and their mechanisms.
RT-PCR was used in this investigation to examine 10 MAGE-A family genes in 10 CC specimens compared with their adjacent NC specimens. For the first time, it was shown in our results that MAGE-A2 MAGE-A3, MAGE-A4, MAGE-A6, MAGE-A8, MAGE-A9, MAGE-A10, MAGE-A11, and MAGE-A12 genes had PCR products in different CC specimens that were also different from those in the NC specimens. However, the bands in CC specimens were more robust than their matching bands in the NC specimens. This pattern was also found in previous studies (Hou et al., 2014, Shantha Kumara et al., 2012), which is similar to the RT-PCR results identified in this study. Additionally, MAGE-A1 was identified by this screen as a potential candidate for CC markers in the Saudi population because its expression was observed in different CC samples, but not in NC samples. This is most likely connected to the activation of CT genes, such as MAGE-A family genes, in cancer. For instance, demethylation can cause the activation of the previously described CT genes in cancer (Almatrafi et al., 2014). Similar results for MAGE-A1 were observed in lung cancer (Anvari et al., 2017) and colorectal cancer (Kutilin, 2020).
The regulatory mechanisms that control MAGE-A family gene expression are unknown in malignancies. Epigenetic processes, such as DNA methylation, have been found to modulate MAGE-A gene expressions (Hou et al., 2014). Caco-2 CC cells were treated with varying amounts of 5-aza-2′-deoxycytidine for 48 or 72 h to evaluate a possible induction of the MAGE-A family gene expression by DNA methylation inhibition, HCT116. Gene expression may be influenced by DNA demethylation caused by 5-aza-2′-deoxycytidine by loosening the chromatin structure. The expression of MAGE-A1, MAGE-A3, and MAGE-A4 was increased in HCT116, Caco-2 cells after treatment with 5-aza-2′-deoxycytidine, indicating that DNA hypomethylation is an essential factor in the control of these genes. Our results are consistent with those found in other reports (Kim et al., 2006, Gunda et al., 2013, Wischnewski et al., 2006). DNA methylation has a fundamental role in silencing MAGE-A1, MAGE-A3, and MAGE-A4.
The results indicated that gene interactions have essential roles in many vital biological processes, such as cell cycle control, metabolic, and signaling pathways, and disease pathways. Determining MAGE-A family gene associations will enhance the development of new techniques for preventing, diagnosing, and treating CC. It was shown by our results that most MAGE-A family genes in an interaction network were represented as complex networks. The nodes are the proteins, and the interactions between the pairs of proteins they connect are represented by the edges in such networks. Gene-interaction networks that have been reported in many previous studies have also been used to predict gene-disease associations in Alzheimer’s disease (Chen et al., 2006, Gonzalez et al., 2007). Finally, the current study has two limitations. First, there were only 10 surgical samples, and the outcomes must be proven in more extensive samples. Second, because of the shortage of samples, we did not assess the protein levels of the potential MAGE-A family genes in CC.
5 Conclusion
We examined the expression patterns of 10 MAGE-A family genes in CC tissues and their corresponding NC tissues to see whether there were any MAGE-A gene biomarkers in CC that might aid in early diagnosis. MAGE-A1 was shown to have mRNA expression in 50 % of CC patients, but not in neighboring NC tissues. The expression pattern of this gene in the CC samples suggests that it might be used as a cancer biomarker. Further investigations at the protein level and with a larger cohort of patients are needed to assess this discovery. We also observed hypomethylation in the promoter regions of the MAGE-A1, MAGE-A3, and MAGE-A4 genes. This suggests an up-regulation of their expressions and might play a significant role in CC development and progression.
Author contributions
All authors have read and agreed to publish the final version of the manuscript. Mikhlid Almutairi: project administration, supervision, validation, sample collection, writing – original draft, Mona Alotaibi: RT-PCR analysis and primer design, Rasha Alonaizan: clinical data and sample collection and editing of the manuscript, Abdulwahed Alrefaei: data analysis and clinical data collection, and Bader Almutairi: cell cultures and epigenetic experiments.
Funding
This research received no external funding.
Institutional Review Board statement
The study was conducted according to the guidelines of the Declaration of Helsinki, and approved by the Institutional Review Board (or Ethics Committee) of the Al-Imam Muhammad Ibn Saud Islamic University (Project number: 56–2020, IRB-HAPO-01-R-011).
Informed consent statement
Informed consent was obtained from all subjects involved in the study. Written informed consent has been obtained from the patient(s) to publish this paper.
Acknowledgements
The authors extend their appreciation to the Researchers Supporting Project number (RSP-2021/191), King Saud University, Riyadh, Saudi Arabia.
Declaration of Competing Interest
The authors declare that they have no known competing financial interests or personal relationships that could have appeared to influence the work reported in this paper.
References
- Treatment of ovarian cancer cell lines with 5-aza-2'-deoxycytidine upregulates the expression of cancer-testis antigens and class I major histocompatibility complex-encoded molecules. Cancer Immunol. Immunother.. 2009;58(4):589-601.
- [Google Scholar]
- Regulation of cancer germline antigen gene expression: implications for cancer immunotherapy. Future Oncol.. 2010;6:717-732.
- [Google Scholar]
- Identification of a class of human cancer germline genes with transcriptional silencing refractory to the hypomethylating drug 5-aza-2'-deoxycytidine. Oncoscience. 2014;1:745-750.
- [Google Scholar]
- Colorectal cancer in Saudi Arabia: incidence, survival, demographics and implications for national policies. Ann. Saudi Med.. 2015;35:196-202.
- [Google Scholar]
- Preventability of colorectal cancer in Saudi Arabia: fraction of cases attributable to modifiable risk factors in 2015–2040. Int. J. Environ. Res. Public Health. 2020;17:320.
- [Google Scholar]
- The prevalence and expression pattern of melanoma-associated antigen 1 in esophageal squamous cell carcinoma: a historical cohort study. Electron Phys.. 2017;9:3756-3763.
- [Google Scholar]
- Expression of MAGE-A3/6 in primary breast cancer is associated with hormone receptor negative status, high histologic grade, and poor survival. J. Immunother.. 2014;37:73-76.
- [Google Scholar]
- Tumor antigen expression in melanoma varies according to antigen and stage. Clin. Cancer Res.. 2006;12:764-771.
- [Google Scholar]
- Colorectal cancer: from prevention to personalized medicine. World J. Gastroenterol.. 2014;20:6786-6808.
- [Google Scholar]
- Coordinated expression of clustered cancer/testis genes encoded in a large inverted repeat DNA structure. Gene. 2008;415:68-73.
- [Google Scholar]
- A gene encoding an antigen recognized by cytolytic T lymphocytes on a human melanoma. Science. 1991;254:1643-1647.
- [Google Scholar]
- Cancer/testis antigens: potential targets for immunotherapy. Innate Immune Regul. Cancer Immunother. 2012:347-369.
- [Google Scholar]
- Mining Alzheimer disease relevant proteins from integrated protein interactome data. Pac. Symp. Biocomput. 2006:367-378.
- [Google Scholar]
- Differential gene expression profile of MAGE family in taiwanese patients with colorectal cancer. J. Surg. Oncol.. 2010;102:148-153.
- [Google Scholar]
- Overexpression of cancer-testis antigen melanoma-associated antigen A1 in lung cancer: A novel biomarker for prognosis, and a possible target for immunotherapy. J. Cell. Physiol.. 2019;234(7):12080-12086.
- [Google Scholar]
- Induction of melanoma antigen-specific cytotoxic T lymphocytes in vitro by stimulation with B7-expressing human melanoma cell lines. J. Immunother.. 1998;21(2):95-108.
- [Google Scholar]
- Emerging Contributions of cancer/testis antigens to neoplastic behaviors. Trends Cancer. 2018;4:701-712.
- [Google Scholar]
- Oncogenic cancer/testis antigens: prime candidates for immunotherapy. Oncotarget. 2015;6(18):15772-15787.
- [Google Scholar]
- Mining gene-disease relationships from biomedical literature: weighting protein-protein interactions and connectivity measures. Pac Symp Biocomput 2007:28-39.
- [Google Scholar]
- Expression of multiple epigenetically regulated cancer/germline genes in nonsmall cell lung cancer. Int. J. Cancer. 2006;118:2522-2528.
- [Google Scholar]
- Potential role of 5-aza-2'-deoxycytidine induced MAGE-A4 expression in immunotherapy for anaplastic thyroid cancer. Surgery. 2013;154:1456-1462. discussion 1462
- [Google Scholar]
- Expressions of MAGE-A9 and MAGE-A11 in breast cancer and their expression mechanism. Arch. Med. Res.. 2014;45:44-51.
- [Google Scholar]
- Simultaneous humoral and cellular immune response against cancer-testis antigen NY-ESO-1: definition of human histocompatibility leukocyte antigen (HLA)-A2-binding peptide epitopes. J. Exp. Med.. 1998;187:265-270.
- [Google Scholar]
- Sperm-associated antigen 9 is a novel biomarker for colorectal cancer and is involved in tumor growth and tumorigenicity. Am. J. Pathol.. 2011;178:1009-1020.
- [Google Scholar]
- Increased expression of androgen receptor coregulator MAGE-11 in prostate cancer by DNA hypomethylation and cyclic AMP. Mol. Cancer Res.. 2009;7:523-535.
- [Google Scholar]
- Promoter hypomethylation and reactivation of MAGE-A1 and MAGE-A3 genes in colorectal cancer cell lines and cancer tissues. World J. Gastroenterol.. 2006;12:5651-5657.
- [Google Scholar]
- Pattern of cancer/testis antigen expression in lung cancer patients. Int. J. Mol. Med.. 2012;29:656-662.
- [Google Scholar]
- Regulation of gene expression of cancer/testis antigens in colorectal cancer patients. Mol Biol (Mosk). 2020;54:580-595.
- [Google Scholar]
- DNA hypomethylation of CAGE promotors in squamous cell carcinoma of uterine cervix. Ann. N. Y. Acad. Sci.. 2006;1091:218-224.
- [Google Scholar]
- A comprehensive guide to the MAGE family of ubiquitin ligases. J. Mol. Biol.. 2017;429:1114-1142.
- [Google Scholar]
- Expression profile of cancer-testis genes in 121 human colorectal cancer tissue and adjacent normal tissue. Clin. Cancer Res.. 2005;11:1809-1814.
- [Google Scholar]
- Epigenetic regulation of MAGE family in human cancer progression-DNA methylation, histone modification, and non-coding RNAs. Clin Epigenetics. 2018;10:115.
- [Google Scholar]
- Mage-A cancer/testis antigens inhibit p53 function by blocking its interaction with chromatin. Cancer Res.. 2010;70:10362-10370.
- [Google Scholar]
- Expression of MAGE genes in human colorectal carcinoma. Ann. Surg.. 1996;224:183-188.
- [Google Scholar]
- Overexpression of CXCL8 gene in Saudi colon cancer patients. Saudi J. Biol. Sci.. 2021;28:6045-6049.
- [Google Scholar]
- MAGE-A3 is highly expressed in a subset of colorectal cancer patients. Cancer Immun.. 2012;12:16.
- [Google Scholar]
- Expression of cancer/testis antigens in prostate cancer is associated with disease progression. Prostate. 2010;70:1778-1787.
- [Google Scholar]
- Evaluation of MAGE-D4 expression in hepatocellular carcinoma in Japanese patients. J. Surg. Oncol.. 2013;108:557-562.
- [Google Scholar]
- Expression of cancer testis antigens in colorectal cancer: new prognostic and therapeutic implications. Dis. Markers. 2016;2016:1987505.
- [Google Scholar]
- The genetic polymorphism of melanoma-associated antigen 1 in Chinese normal donors and hepatoma patients. Zhonghua Gan Zang Bing Za Zhi. 2004;12:151-155.
- [Google Scholar]
- Sp17 gene expression in myeloma cells is regulated by promoter methylation. Br. J. Cancer. 2004;91:1597-1603.
- [Google Scholar]
- The GeneMANIA prediction server: biological network integration for gene prioritization and predicting gene function. Nucleic Acids Res.. 2010;38:W214-W220.
- [Google Scholar]
- Promoter demethylation and histone acetylation mediate gene expression of MAGE-A1, -A2, -A3, and -A12 in human cancer cells. Mol. Cancer Res.. 2006;4:339-349.
- [Google Scholar]


