

Translate this page into:
Hydrometeorological consequences on the water balance in the Ganga river system under changing climatic conditions using land surface model
⁎Corresponding authors. abhishek@coral.iitkgp.ac.in (Abhishek Kumar Rai), salam@ksu.edu.sa (Shamshad Alam),
-
Received: ,
Accepted: ,
This article was originally published by Elsevier and was migrated to Scientific Scholar after the change of Publisher.
Peer review under responsibility of King Saud University.
Abstract
The United Nations Sustainable Development Goal (SDG) ensures adequately accessible water and management for all. Due to the rapid increase in population and industries along the Ganga river, it is necessary to estimate the water budget to fulfill the demand for water in the future. The Mann-Kendall (MK) test conducted on the Noah-Land Surface Model data for 72 years results in a maximum declining trend of water budget in the Yamuna Lower (Q = −3.82 BCM/year), and a minimum in the Damodar sub-basin (Q = −0.10 BCM/year). All the sub-basins show an increase in groundwater level (mbgl) except the Kali Sindh, which shows a decreasing trend (Q = −0.07 m/year). The percentage change was also estimated in all the sub-basins, including various parameters such as precipitation, evapotranspiration, runoff, water budget, and temperature. The extremely severe groundwater drought was estimated using the Standard Groundwater Level Index (SGWLI), from which the values for the Ram Ganga Confluence (SGWLI = 2.44; 2005), Upper stream of Gomti (SGWLI = 2.06; 2014), Ghaghra (SGWLI = 2.22; 2005), Ram Ganga (SGWLI = 2.28; 2005), Yamuna Lower (SGWLI = 2.13; 2007), Kali Sindh (SGWLI = 2.30,2.67; 2002, 2003), Chambal Upper (SGWLI = 2.30,2.20; 2001, 2003), Son (SGWLI = 2.02; 2010), Gandak (SGWLI = 2.37; 2010), Kosi (SGWLI = 2.08; 2012), Damodar (SGWLI = 2.72; 2010), and Bhagirathi (SGWLI = 2.06; 2014) were obtained for a total of 62,050 observed well data.The obtained in-situ point data is converted into the surface raster using a geostatistical technique. Our results show a declining trend in the water budget of all the 19 sub-basins of the Ganga basin and also the groundwater drought in several parts.
Keywords
GLDAS
GIS
Land Surface Model
M−K Test
Noah
Water Budget

- GLDAS
-
Global Land Data Assimilation System
- SDG
-
Sustainable Development Goal
- MK
-
Mann-Kendall (MK) test
- SGWLI
-
Standard Groundwater Level Index
- GPCP
-
Global Precipitation Climatology Project
- GIS
-
Geographical Information system
- CGWB
-
Central Ground Water Board
- Mbgl
-
Meter below ground level
Abbreviations
1 Introduction
The United Nation’s Sustainable Development Goal ensures accessibility and sustainable water and sanitation for all. It also highlights the importance of growing concern about water and sanitation problems in the global political agenda (SDG, 2018). As per the Fourth Assessment Report by the Intergovernmental Panel on Climate Change (IPCC), the average worldwide temperatures could increase by 1.1–6.4 °C by the end of the 21st century (IPCC, 2007; Rehman et al., 2022). Climate change may influence the worldwide and regional hydrological cycles, varying the spatial and temporal distribution of major elements of the hydrological cycle such as rainfall, runoff, evaporation, and soil moisture, causing a re-distribution of surface and groundwater resources over a spatio-temporal scale and enhancing the possibility of a number of hydrological extremes (Qin et al., 2011). Changing precipitation or melting snow and ice in many areas changes hydrological processes and impacts water supplies in terms of quantity and quality (Jarraud and Steiner, 2012). The rate of precipitation is not evenly distributed over the global spatial extent. The distribution of open fresh water on Earth's surface available in reservoirs, rivers, and swamps is 87%, 2% and 11%, respectively (Gleick, 1993). Water storage calculations were frequently done by applying: in-situ observations, hydrological modelling, and remote sensing (Hall et al., 2011; Duan and Bastiaanssen, 2013). Unavailability of ground-based gauge stations, especially in developing and underdeveloped countries, and uncertainty in the hydrological model lead to foster the use of remote sensing data for sustainable water resource management (Fang et al., 2008; Singh et al., 2016; Bring et al., 2017). Assessing water storage and stream discharge will permit us to comprehend the dynamics of the topographical division of the global water cycle, and to predict the significances of alteration on water resources (Zhang et al., 2006).
According to groundwater depletion studies, the Indo-Gangetic plains of northern India, Bangladesh, and the regions of Nepal and Pakistan have the highest depletion rate (Aeschbach-Hertig and Gleeson, 2012). Rodell et al. (2009) used the GRACE data and soil moisture dataset variation integrated with hydrological modelling to show that groundwater depletion takes place at an average rate of 4.0 ± 1.0 cm/year in terms of equivalent water height over the region of Haryana (Delhi), Punjab, and Rajasthan. The results show that the rate of depletion will be cause severe problems in the near future leading to water scarcity in several areas. Therefore, there is an urgent need to estimate the water budget for efficient and sustainable management of water resources. A water budget defines the amount of water change retained in an environment, such as a basin, sub-basin or watershed, and is balanced by the amount at which water flow takes place in and out of the region (Healy et al., 2007).
Water available in the Earth's system is constant, although certain variations may occur locally depending on geologic conditions and the regional climate (Birylo et al. 2018a; Birylo et al., 2018b). Observed variations in an area's water supply can be used over time to determine the impacts of climate changes and human activity on water supplies (Healy et al., 2007). Apart from securing drinking water sources of groundwater, water budgets can be utilised for a number of applications such as land use/cover planning, water use developments, landfill location approvals, recharge well locations, residential and industrial water supply, irrigation water supply, metropolitan water supplies, total extraction, dam construction, and stormwater management (Maliva and Missimer, 2012). Recent studies carried out on measuring the wind wave height put new insight into the application of satellite altimeters in coastal hydrology and also the wave period retrieval analysis (Wang and Ichikawa, 2016; Lama et al., 2022; Sadeghifar et al., 2022). A similar type of study was also conducted for 33 years on a global basis using various satellite altimetry data (Ribal and Young,2019). In addition, satellite altimetry was used in the Brahmaputa region with the Jason 2 satellite, which used optical and microwave remote sensing to measure flow extent and stage discharge (Dubey et al., 2015).The impact of various spatial resolutions for vegetation using unmanned aerial vehicles, including high-resolution orthomosaics, i.e., higher resolution than traditional aerial or satellite observations, of small and medium areas (Saponaro et al.,2021). The recent study on riparian vegetation were done using UAV having multi spectral images, and also evaluated based on the nature of exposed currents for the bulk drag prediction (Vettori and Nikora,2019; Lama et al., 2021a, Lama et al., 2021b; Gijón Mancheño et al., 2021). For understanding the challenges of ecohydrology the multidisciplinary approach adopted physical and ecological perpective of river system, and also characterized by green–blue flood control scenario, which help in modelling depth averaged streamwise velocity for vegetative rivers (Gosselin et al.,2019; Lama et al., 2021a, Lama et al., 2021b; Li et al., 2021). The field based experiment shows the interaction between flow and vegetation leads to varying sediment deposition using different models for predicting (Liu & Nepf, 2016; Lama et al.,2020). The ecohydrological and flow dynamics under changing climate condition helps us to understand the threat of flood hazard and mitigation using remote sensing and create awareness of the local management strategies (Erena et al., 2018; Errico et al., 2019; Lama et al., 2021a, Lama et al., 2021b).
The Global Land Data Assimilation System (GLDAS) model is used by various researchers globally for the computation of water budgets in different regions. (Birylo, 2017; Roads et al., 2003; Seneviratne et al., 2004; Swenson and Wahr, 2002). Globally, many researchers deploy the non-parametric Mann-Kendall (MK) test for the trend analysis of hydroclimatic variables to understand the long-term effects of climate change (Kyselý, 2009; Petrow and Merz, 2009; Dinpashoh et al. 2011).
In this paper, we first estimate the water budget in the study area. Secondly, time series analysis using a non-parametric test of the hydroclimatic variables is conducted, which helps in understanding the trends. Finally, groundwater drought locations are identified using the in-situ data from the monitoring wells. All these analyses were done on all the 19 sub-basins of the Ganga basin since most of the Indian population lives along the Ganga river, which has highly fertile agricultural land. We apply a non-parametric test which helps to delineate the sub-basin which is more prone to water scarcity over the long time series analysis. A water budget is a component used by the decision maker to estimate the hydrologic process for the sustainable development of water resource management. The analysis' findings may be useful to the government and policymakers who use basin-level water management plans to achieve a variety of goals.
2 Study area
The river Ganga originates from the Gangotri glacier in the district of Uttarkashi, Uttarakhand, of the Himalayan region at an elevation of 7010 m. With the Tropic of Cancer running across it, the Gaga basin is situated between 21°6′ and 31°21′ North Latitudes and 73°02′ and 89°05′ East Longitudes and has an area of 0.88 million km2. The Ganga basin is bounded by the Himalayas in the north, the Vindhaya and Chota Nagpur plateaus in the south, the Indus and Aravali in the west, and the confluence of the Brahmaputra and Bay of Bengal in the east. Therefore, the Ganga river system has a large spatial variation in terms of ecological and hydrometeorological perspectives. Due to changing climate conditions, the Himalayan glaciers are vulnerable to extinction or retreat, which is an alarming condition for maintaining a sustainable flow of water into the river system and its tributaries. The effect of temporal and spatial variability of temperature, precipitation, and evapotranspiration may significantly impact the water balance in the Ganga river system. The Ganga drains through a basin of extraordinary variation in geology, geomorphology, altitude, climate, land use, vegetation, and cropping pattern. India comprises 22 major basins, of which the Ganga basin plays a crucial role in economic development. The Yamuna Lower sub-basin (15.45%) has the largest percent drainage area of the Ganga basin.
3 Data source and methodology
The first and foremost thing in the monitoring and estimation of the water budget is to delineate the river basin. The published map from CWC and ISRO was imported into the GIS platform, then georeferenced the map using the Geographic Coordinate System having datum WGS 1984, maintaining the spatial extent of the boundary (CWC and ISRO). All the 19 sub-basins are digitised for the extraction of spatial data for further analysis. The development of GLDAS was done by teams from different organisations like the National Aeronautics and Space Administration (NASA), Goddard Space Flight Centre (GSFC), National Oceanic and Atmospheric Administration (NOAA), and National Centres for Environmental Prediction (NCEP) based on long-term data using prediction and simulation models. The deployment of ground and space-borne observation techniques for the two constraints applied to land surface states includes employing Land Surface Models (LSM) including meteorological data and another by data assimilation techniques (Rodell et al., 2004). With the development of technology and research, four GLDAS Land Surface Model (LSM) were developed (Fang et al., 2008). The two main GLDAS land surface models include Mosaic (Sellers et al., 1986), NOAH (Betts et al., 1997), whereas the other two including Community Land Model (CLM), (Dai, 2003), Variable Infiltration Capacity model (VIC), (Liang et al., 1994). Based on the hydrological flux from inward and outward, completing the water budget component in the study area using vertical (Precipitation and Evapotranspiration) and horizontal (Runoff) flux within the basin. GLDAS-2 NOAH land surface model having 36 parameters including 3-hourly and monthly data product from 1948 to till now. The NOAH LSM are classified into five categories including past 3hr time average (tavg = 12 parameter), past 3-hr accumulated (Qcc = 3 variable), instantaneous (inst = 14 variable), forcing past 3-hr average (f_tavg = 3 variable), and forcing instantaneous (f_inst = 4 variable)(Spennemann et al., 2015).
The GLDAS having the two-component for the long term climatological data studies are GLDAS-2.0 (Rodell et al., 2004) from 1948 to 2010 using global meteorological forcing data set from Princeton University (Sheffield et al., 2006), on the other hand, GLDAS-2.1 (Rodell et al., 2009) having the dataset from 2000 to till now by incorporating with a combination of Global Data Analysis System (GDAS), AGRicultural METeorological (AGRMET) modelling system radiation data, and disaggregated Global Precipitation Climatology Project (GPCP).
The GLDAS NOAH land surface model L4 dataset, which uses as for the estimation of the water budget from 1948 to 2019 having a spatial resolution of 0.25 *0.25°with monthly time average temporal data downloaded from Giovanni ( https://giovanni.gsfc.nasa.gov/giovanni/). GLDAS_NOAH025_ M_2.0 data used for water budget from 1948 to 1999, and from 2000 to 2019 GLDAS_NOAH025_M_2.1 dataset are used.
Monitoring water availability in the study area, the water flow in river/stream depends upon the following component in the basin contributing to the flow are total precipitation rate (Rainf_f_tavg), evapotranspiration (evaporation and transpiration, Evap_tavg), rate of infiltration in the soil, surface water such as soil moisture, reservoirs, lake, and in addition groundwater storage and the last one is storm surface runoff (Qs_acc), this component provides complete water budget. The precipitation is an important component added into the earth system in the form of an inflow and leaving system by means of evapotranspiration and streamflow within the catchment.
The objective of this paper is to estimate the water budget (balance) by usingLand Surface Model (GLDAS_Noah), which can be used for deriving water budget components.
3.1 Computation of water budget
The hydrological cycle considering the terrestrial water storage are given below (Seneviratne et al. 2004);
Within a given geographic region, most hydrological basin groundwater runoff is considered to be discharged into streams and, hence, is measured along with surface water runoff (Seneviratne et al. 2004). Therefore, for large study area the equation (1) can be modified into equation (2), based on the studies carried out globally (Lv et al. 2017; Birylo et al. 2018a; Birylo et al., 2018b) assuming there is no lateral flow of groundwater along the river basin in the study area (Wan et al., 2015). Considering that there is no surface, sub-surface, or groundwater net inflow/outflow in the study area, surface runoff and base-flow contribute to discharge. The first-order equation for surface water budget is given below:
Precipitation is the source and sinks that surface receives from which evapotranspiration is lost to the atmosphere. Evapotranspiration is the cumulative amount of water vaporises into the atmosphere, including evaporation from land surfaces and transpiration from vegetation and plants. Runoff is the horizontal flow of water from the basin depending upon the morphometric characteristics of the terrain. It is important to note here that the GLDAS model, is a column model, and lateral flow is not included, so this equation is valid in the sense that runoff and subsurface runoff actually is no net-input in the river basin, its really going through the eventually goes through the river stream of discharge, so that is one of the assumptions in deriving this. Another important thing is that when we look at these parameters GLDAS like system, there is no irrigation or other management such as reservoir or dam management are included, so this is an all-natural hydrologic cycle that we are looking at. To obtain the water budget component, we can use a number of data sources such as precipitation from GPM IMERG, and GLDAS download from Giovanni, for evapotranspiration ALEXI, MOD 16, and GLDAS download from SERVIR Global and Giovanni, and runoff which cannot be provided directly from satellite but estimated by GLDAS which is also downloaded from Giovanni, provide all these data for computing water budget. We used GLDAS because all parameters have the same spatial and temporal resolution. Therefore, the biggest advantage of GLDAS is that everything is uniformly gridded in pace and time, which gives better accuracy than using different satellite sensors of different temporal resolution.
3.2 Non-Parametric test for time series and trend detection for hydrometeorological paratemets
The non-parametric test employs to evaluate the magnitude and trend of the hydroclimatic parameter (Bisht et al., 2018; da Silva et al., 2015; Panda and Sahu, 2019). The time-series data are equally spaced and arranged in ascending order from 1948 to 2019.
3.2.1 Measurement of the significance of the trend
The detection of trends is a difficult task because of the various characteristics of the data. The main goal of trend analysis is to determine whether the values of the data are increasing, decreasing, or remaining static over time (Kisi and Ay 2014; Marques et al., 2015). In order to detect trends, nonparametric tests Mann-Kendall S Statistic is computed as follows (Mann,1945; Kendall,1975; Mohsin and Gough, 2010) using Eq. (4) and (5).
The variance is computed as:
A tied group is a collection of data samples that all have the same value (i.e. they are all tied). When the sample size is greater than or equal to 30, the standard normal test statistic Zs is derived from equation 7:
Zs statistics follow the standard normal distribution with zero mean and unit variance under the null hypothesis of no trend. An upward trend is indicated by a positive Zs value, while an upward trend is indicated by a negative Zs value It is possible to use the normal cumulative distribution function to calculate the p value for an MK statistic S (Yue and Wang, 2002;Neeti and Eastman, 2011).
3.2.2 Estimation of the magnitude of the trend using Theil-Sen's slope estimator
Sen's slope deals with the estimation of the magnitude of the trend based on the time series data arranged in order of sequence within a time frame (Theil, 1950) using equation 8.
The median of Sen's slope (Qmed) estimator is calculated from the number of time periods (N) derived from the magnitude of the trend (Ti) from smallest to largest. The Qmed is computed as for N as odd, similarly for N as even.
The values of Qmed helps to find the nature of the trend of hydroclimatic parameters. The positive values show the increasing trend, whereas negative values depict the declining trend of the variable based on the steepness of the slope.
3.2.3 Computation of percentage change (Pc) or relative change (Rc)
Some patterns may not be statistically significant but are of practical interest, and vice versa. Change percentage was calculated in this study by using a linear trend to approximate it. That is, the change percent equals the median slope multiplied by the period duration divided by the mean. The percentage change equation given below (Kumar et al., 2016):
3.3 Standard groundwater level Index (SGWLI) for groundwater drought analysis
The groundwater drought is a situation where groundwater sources fail as a direct consequence of drought (Bloomfield and Marchant, 2013). Groundwater drought is a particular type of hydrological drought that occurs when groundwater recharge, heads or discharge deviate from normal, which leads to the consequences of groundwater supply to maintain the eco-hydrological process. The observed groundwater level data was collected from the Central Groundwater Board for the year 21 years from 1996 to 2016, having a total number of sample points 62,050 based on pre-monsoon, monsoon, post-monsoon (rabi), and post-monsoon (Kharif). The average annual groundwater level was prepared using the point data converted into the raster surface using the geostatistical technique of inverse distance weighted method (Hasan and Rai, 2020). The statistical values of the sub-basin were computed using zonal statistics on the GIS platform. Based on the water level index, the groundwater drought, which is used to analyse the spatial and temporal stress of groundwater is defined as (Bhuiyan, 2000; Shahid & Kumar, 2010; Halder et al., 2020) Eq. (10).
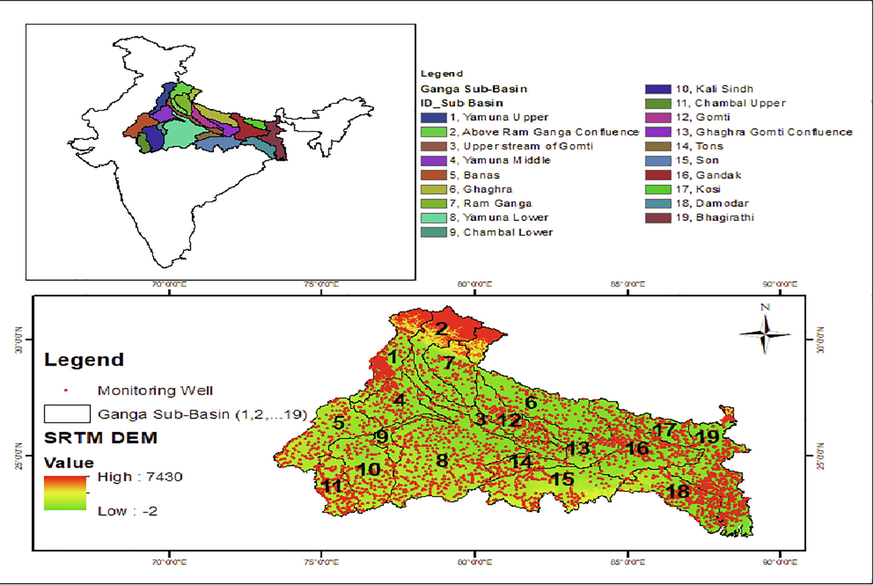
Study area of Ganga basin showing 19 sub-basin.
4 Results and discussion
The assessment of dynamic groundwater resources in India has been carried out by the Central Ground Water Board (CGWB) and the concerned State Government authorities (CGWB, 2012). The dynamic groundwater resources are also known as annual replenishable groundwater because it is replenished/recharged each year. According to the latest assessment, the annual replenishable groundwater resource in this region was estimated at 431 billion cubic meters (BCM) as in March 2009, of which 396 BCM is considered available for exploitation for various uses after retaining 35 BCM for natural release during the non-monsoon time for the maintenance of environmental flows in springs, streams and rivers (CGWB, 2012). The stage of groundwater development in India for the years 2004, 2009 and 2011 was obtained as 58%,61%, and 62%, respectively (Kulkarni et al., 2018). The assessment water availability per person for the years 2001 and 2011 was 1813 and 1545 respectively, having the projected demand reduced to 1340 and for the year 2025 and 2050 (DoWR-GOI,2019). The accuracy of NOAH land surface model for the Ganga basin shows Nash Sutcliffe Efficiency (NSE) >0.8 (Prakash Kushwaha et al., 2021). The sub-basin results of autocorrelation function, and Sen’s slope shows in the Figs. 9 and 11.Fig. 2.Fig. 3.Fig. 4.Fig. 5.Fig. 6.
-
Yamuna Upper: The Yamuna Upper sub-basin is located between 27° 18′ to 31° 25′ north latitudes and 75° 45′ to 78° 37′ east longitudes in India. Most of the river's discharge is accounted for by the physiographic and geological characteristics of the Yamuna Upper sub-basin, which is located in the Himalayan range. On average, this area gets approximately 1500 mm of rain each year. The Ganga basin's Yamuna Upper sub-basin has a total catchment of ∼ 38447.64 square kilometres. Uttarakhand, Delhi, Himachal Pradesh, Uttar Pradesh, Haryana, and Rajasthan are all part of the sub-basin. The hydrometeorological analysis of long term data using the M−K test shows the significant (P < 0.05) trend of increasing GWL (mbgl) at 0.29 m/year and decreasing trend of temperature at −0.01 oC/year. The insignificant trend (P > 0.05) of precipitation, evapotranspiration, surface runoff, and water budget having trend magnitude of −1.12 mm/year,-0.21 mm/year,0.08 mm/year, and −0.45BCM/year, respectively in the Yamuna Upper sub-basin (Figs. 8 & 11). The minimum SGWLI values ranges from −1.70 to maximum 1.36 for the year 1998 and 2014, respectively. The results shows only moderate drought takes place in this region from 2013,2014,2015, and 2016, having SGWLI values 1.05,1.36,1.35, and 1.19 respectively (Fig. 12 and Table 1). The percentage change in the hydrometeorological parameters over the long period of 72 years, of precipitation, evapotranspiration, runoff, water budget and temperature found as −10.03,-2.28, 25.72, −60.49, and −3.35 respectively (Fig. 13).
-
Above Ram Ganga Confluence: The Above Ramganga Confluence sub-basin is located between 27° 12′ to 31° 28′ north latitudes and 77° 47′ to 80° 15′ east longitudes in India. This sub-basin includes major rivers such as the Bhagirathi and Alaknanda, as well as smaller rivers such as the Nayar, Song, and Pinder. In this sub-basin, all of these rivers join to create the main Ganga river. The catchment of the sub-basin is ∼ 43530.21 square kilometres. It flows across Uttar Pradesh, Uttarakhand, and certain portions of Himachal Pradesh. Tehri Dam, Koteshwar Dam, and Maneri Dam are all located in this sub-basin. The annual trend analysis of 72 years using the M−K test reveals that the significant increasing trend (P < 0.05) of runoff, GWL (mbgl) 0.31 mm/year, 0.21 m/year, and decreasing trend of temperature and water budget at −0.02oc/year, and −0.78 BCM/year. The insignificant trend (P > 0.05) of precipitation and evapotranspiration having Sen's slope of −1.17 mm/year and 0.14 mm/year, respectively (Figs. 7 & 10). From 1996 to 2016, it is observed only that, etreme severe drought takes place in the year 2005 (SGWLI = 2.44), and the year 2009,2012,2016 shows the moderate drought. 2006,2008,2011,2013,2015 shows the mild drought (SGWL > 0.00), and rest of the year shows no groundwater drought (Fig. 12). The percentage change in the hydrometeorological parameters over the long period of 72 years, of precipitation, evapotranspiration,runoff, water budget and temperature found as −9.47,1.61,36.68,-68.16, and −9.39 respectively (Fig. 13).
-
Upper stream of Gomti: The geographical area of the Upstream of Gomti confluence to Muzaffarnagar sub-basin is between 24° 52′ to 29° 37′ north latitudes and 77° 35′ to 83° 12′ east longitudes of the nation. This is the upstream section of the Gomti River, which has a catchment of ∼ 31346.91 square kilometres. The sub-basin is entirely within the state of Uttar Pradesh. Trend analysis using the M−K test along with Sen's slope was done to evaluate the nature of hydrometeorological parameters. The results show the significant (P < 0.05) increase in trend of evapotranspiration, runoff, and GWL as 0.99 mm/year,0.19 mm/year,0.12 m/year, and decreasing trend of water budget −0.68BCM/year, respectively. Precipitation shows an insignificant decreasing trend of −0.26 mm/year.In the year 2014, it is observed that the extreme severe groundwater drought takes place (SGWLI = 2.06), severe drought in 2014, and moderate drought in the year 2015 (SGWLI = 1.09). Eight different year shows mild drought, and rest of the other year falls under no groundwater drought condition. The percentage change in the hydrometeorological parameters over the long period of 72 years, of precipitation, evapotranspiration,runoff, water budget and temperature found as −1.99,10.76,51.25,-66.44 and 2.28 respectively (Fig. 13).
-
Yamuna Middle: The Yamuna Middle sub-basin is located between 26° 15′ to 28° 43′ north latitudes and 75° 51′ to 79° 19′ east longitudes in India. The Yamuna is the main river that flows through this sub-basin. The entire catchment of the Yamuna Middle sub-basin of the Ganga basin is ∼ 36817.74 square kilometres. The states of Delhi, Haryana, Rajasthan, and Uttar Pradesh are all included in the sub-basin. Utangan or Banganga, Gambhir, Bangan, Kasaundi, Jhirha Karwan and Nadi, are some of the other important rivers in this sub-basin. The M−K test results show the significant (P < 0.05) increasing trend of evapotranspiration (Q = 0.69 mm/year), temperature (Q = 0.01 °C/year), GWL (0.30 m/year), and decreasing trend of water budget (Q = −0.05 BCM/year). The insignificant trend of declining precipitation having Sen's slope of −0.08 mm/year (Figs. 8 & 9). The severe groundwater drought takes place in the year 2016 (SGWLI = 1.70), moderate groundwater drought also takes place in the year 2007,2009,2010,2014,2015 having SGWLI values greater than unity but<1.5. For the year 2005,2006,2008,2011,2012,2013 shows mild drought (SGWLI > 0.00), and rest of the other years having no groundwater drought. The percentage change in the hydrometeorological parameters over the long period of 72 years, of precipitation, evapotranspiration,runoff, water budget and temperature found as −0.78,8.46,36.17,-71.77 and 3.71 respectively (Fig. 13).
-
Banas: The Banas sub-basin is positioned between the latitudes 27° 34′ north and 24° 15′ the longitudes of 73° 24′ and 76° 57′ east of in the nation. The Banas is the major river, with the Morel, Berach, and Gambhir as tributaries flowing into the Banas sub-basin. The Ganga basin's Banas sub-basin has a total catchment of ∼ 55103.94 square kilometres. It flows into the states of Rajasthan and Madhya Pradesh in portions. The hydrometeorological effects on the sub-basin of Ganga sub-basin using MK-test shows the significant increasing (P < 0.05) trend of runoff (Q = 0.12 mm/year), temperature (0.02 oC/year), and groundwater level (0.17 m/year). No significant trend was observed for precipitation (0.69 mm/year) and water budget (-0.11 BCM/year). Banas sub-basin shows moderate groundwater drought for the consequitive three years 2008,2009,2010, other eight years are under mild drought, and rest of the years having no groundwater drought condition (Fig. 10). The percentage change in the hydrometeorological parameters over the long period of 72 years, of precipitation, evapotranspiration,runoff, water budget and temperature found as 7.61, 4.56, 52.81, −10.96 and 4.30respectively (Fig. 13).
-
Ghaghara: The Ghaghara sub-basin is located between the latitudes of 25° 47′ to 30° 31′ north and the longitudes of 79° 29′ to 84° 49′ east in the nation. The Ghaghara and the Sarda rivers, as well as the Rapti and the Little Gandak, are some of the important tributaries that run through this sub-basin. The Ghaghara river begins nearby Manasarovar Lake, at the height of 4,800 m. In Nepal, the river is also recognised as Manchu and Karnali. The river moves in Nepal after flowing for 72 km in a south-easterly direction. Ghaghara moves in India at Kotia Ghat nearby Royal Bardia National Park in Nepal Ganj. Further, it flows for approximately 25 km as the river Girwa. The Ghaghara river's entire catchment is ∼ 69143.58 square kilometres, with 45 per cent of it falling in India. The Ganga basin's Ghaghara sub-basin has a total catchment of ∼ 58,634 square kilometres. The Sarda River is a major tributary of the Ghaghara River, which forms a portion of the border between India and Nepal. Other significant tributaries of the Ghaghara river are the Sarju, Rapti, and Little Gandak. The Ghaghara river is 1,080 km long before it meets the Ganga river (near Doriganj, downstream of Chhapra town in Bihar). It flows across portions of Uttar Pradesh, Uttarakhand, and Bihar. The significant (P < 0.05) long term climatic effect was observed in the Ghaghra sub-basin using the MK-test shows the increasing trend of GWL (Q = 0.08 m/year), whereas the decreasing trend of precipitation (Q = −3.97 mm/year) and water budget (Q = −3.82 BCM/year). There is no significant (P > 0.05) was observed for evapotranspiration (Q = 0.51 mm/year, runoff (Q = 0.12 mm/year), and temperature. Ghaghra shows the extreme severe groundwater drought for the year 2005 (SGWLI = 2.21), 2006,2010,2011,2012 shows the moderate drought, and rest of the other years having no groundwater drought (Fig. 10). The percentage change in the hydrometeorological parameters over the long period of 72 years, of precipitation, evapotranspiration,runoff, water budget and temperature found as −24.46, 4.73, 19.90, −100.77 and −0.74 respectively (Fig. 13).
-
Ram Ganga: The Ramganga sub-basin is located between the latitudes of 27° 7′ to 30° 6′ north and the longitudes of 78° 14′ to 80° 8′ east in India. The Ramganga is the Ganga's first significant tributary. It climbs to approximately 3,110 m in the lower Himalayas near the Lohba village in Uttarakhand's Garhwal district. The Ramganga river is 596 km long from its source to its confluence with the Ganga. The river runs through hilly terrain and includes a lot of falls and rapids along the way. The river joins the plains at Kalagarh, near the Garhwal district's boundary, where the renowned Ramganga dam was built. The river runs southeast from Kalagarh, eventually joining the Ganga on its left bank at Kanauj in the Fatehgarh district. The river runs completely across Uttarakhand and Uttar Pradesh states. The sub-catchment basin's area is about ∼ 33040.17 square kilometres. The Ban, the Gangan, the Khoh, the Gagas, the Aril, the Haldgadi Rao, the Kosi, and the Deoha are major tributaries that enter the Ramganga river. The hydrometeorological parameters of Ghaghra and Ram Ganga shows a similar trend as the Ghaghra, but the magnitude of Sen's slope is different such as precipitation (Q = −3.08 mm/year), evapotranspiration (-0.16 mm/year), runoff (0.07 mm/year), water budget (-1.08BCM/year), and GWL (Q = 0.16 m/year). Ram Ganga shows the extreme severe groundwater drought in the year 2005 having SGWLI value of 2.27. this sub basin also correspond to the moderate, mild and no groundwater drought condition (Fig. 10). The percentage change in the hydrometeorological parameters over the long period of 72 years, of precipitation, evapotranspiration,runoff, water budget and temperature found as −21.04, −1.42, 16.39, −96.21,and −0.61 respectively (Fig. 13).
-
Yamuna Lower: The Yamuna Lower sub-basin is located between 22° 51′ to 28° 1′ north latitudes and 77° 6′ to 81° 55′ east longitudes in India. In the Yamuna lower sub-basin, the Sind, Dhasan, Betwa, and Ken rivers are the main tributaries. With a total catchment area of ∼ 134287.7 square kilometres, the Yamuna Lower sub-basin is the biggest sub-basin in the Ganga basin. The Uttar Pradesh and Madhya Pradesh make up the majority of the sub-basin. The hydrometeorological analysis of long term data using the M−K test shows the significant (P < 0.05) trend of the increasing trend of evapotranspiration (Q = 0.78 mm/year), runoff (0.45 mm/year), temperature (0.01 °C/year), whereas decreasing trend of water budget (Q = −3.82 BCM/year). The insignificant trend (P > 0.05) of precipitation (Q = −0.9 mm/year) and GWL (Q = 0.07 m/year). Yamuna Lower shows the etreme as well as severe groundwater drought condition for the consequitive year of 2007 and 2008, having SGWLI value of 2.13 and 1.64 respectively. This sub-basin also shows the moderate,mild and no groundwater drought condition (Fig. 10). The percentage change in the hydrometeorological parameters over the long period of 72 years, of precipitation, evapotranspiration, runoff, water budget and temperature found as −6.41, 8.79, 46.69, −68.14 and 3.29respectively (Fig. 13).
-
Chambal Lower: The Chambal Lower sub-basin is located between the latitudes of 24° 43′ to 26° 55′ north and the longitudes of 76° 38′ to 79° 17′ east in the nation. In the Chambal Lower sub-basin, the Yamuna meets its tributary river, the Chambal. The Ganga basin's Chambal Lower sub-basin has a total catchment of ∼ 12729.51 square kilometres. The Madhya Pradesh state, as well as portions of Rajasthan and Uttar Pradesh, are drained by the sub-basin. The annual trend analysis of 72 years using the M−K test reveals that the significant increasing trend (P < 0.05) of evapotranspiration (Q = 0.55 mm/year) and temperature (Q = 0.02oC/year, whereas decreasing trend of water budget (Q = −0.28BCM/year). There is an insignificant trend observed in Chambal Lower of precipitation (-1.07 mm/year), runoff (Q = 0.06 mm/year), and GWL (0.01 m/year). Chambal lower shows moderate groundwater drought for the year 2002,2003, and 2007 having SGWLI > 1, while rest of the seven years shows mild drought, and eleven different years shows no groundwater drought condition (Fig. 10). The percentage change in the hydrometeorological parameters over the long period of 72 years, of precipitation, evapotranspiration,runoff, water budget and temperature found as −9.06, 6.97, 10.08, −79.90 and 4.25 respectively (Fig. 13).
-
Kali Sindh: The Kali Sindh and Others up to Confluence with Parbati sub-basin are situated in between 22° 33′ to 26° 3′ north latitudes and 75° 15′ to 77° 23′ east longitudes. The main rivers in this sub-basin are the Kali Sindh and Parbati, which converge at the Banas River, a feeder of the Yamuna. The sub-basin of the Ganga basin has a catchment of ∼ 52533.63 square kilometres. It runs through the states of Madhya Pradesh and Rajasthan. Trend analysis using the M−K test along with Sen's slope done to evaluate the nature of hydrometeorological parameters, shows a significant increasing (P < 0.05) trend of runoff (Q = 0.7 mm/year), and temperature (Q = 0.02oC/year), whereas insignificant trend (P > 0.05) of precipitation (Q = 0.22 mm/year), evapotranspiration (Q = 0.42 mm/year), water budget (Q = −0.47BCM/year), and GWL (Q = −0.07). Kali Sindh shows the two extreme severe groundwater drought for the year 2002, and 2003 having SGWLI of 2.29, and 2.67 respectively. Moderate groundwater drought found in the year 2004 and 2005, another different years shows mild and no drought condition (Fig. 10). The percentage change in the hydrometeorological parameters over the long period of 72 years, of precipitation, evapotranspiration,runoff, water budget and temperature found as 1.79, 4.92, 44.96, −42.16, and 4.27 respectively (Fig. 13).
-
Chambal Upper: The Chambal Upper sub-basin is located between the latitudes of 22° 25′ to 25° 5′ north and the longitudes of 74° 49′ to 76° 12′ east in the nation. The Chambal is the main river in the lower sub-basin of the Yamuna. The Ganga basin's Chambal Upper sub-basin has a total catchment of ∼ 27189.63 square kilometres. The sub-basin drains typically in the states of Madhya Pradesh and Rajasthan. The Sipra or Kshipra river, Chamla river, Gangi Nadi, and Retam Nadi, to mention a few, all drain into this sub-basin. Yashvant Sagar (Corporation) Dam, Rana Pratap Sagar Dam, and other important dams are located in this sub-basin. The hydrometeorological parameters of Kali Sindh and Chambal Upper show a similar trend, but the magnitude of Sen's slope different as a significant increase (P < 0.05) in runoff (Q = 0.92 mm/year), and temperature (Q = 0.01 °C/year), whereas insignificant (P > 0.05) trend was observed in precipitation (Q = −0.02 mm/year), evapotranspiration (Q = −0.01 mm/year), water budget (Q = −0.2 BCM/year), and GWL (Q = 0.02 m/year). Chamal Upper also correspond to two different extreme severe groundwater drought for the 2001 and 2003, and severe drought in the year 2002 (SGWLI = 1.67). Rest of different years hows mild as well as no drought condition (Fig. 10). The percentage change in the hydrometeorological parameters over the long period of 72 years, of precipitation, evapotranspiration,runoff, water budget and temperature found as −0.16, −0.05, 57.98, −36.78, and 4.03 respectively (Fig. 13).
-
Gomti: The Gomti sub-basin is located between the latitudes of 25° 25′ to 28° 40′ north and the longitudes of 79° 59′ to 83° 14′ east in the nation. The Gomti river begins at Mainkot, about 3 km east of Pilibhit, Uttar Pradesh, at the height of 200 m, and flows for around 940 km. Between the Ramganga and Ghaghara systems, the river drains the region. The Ganga basin's Gomti sub-basin has a total catchment of ∼ 31732.83 square kilometres. The sub-basin is entirely within the state of Uttar Pradesh. Before merging with the Ganga at Audihar, Jaunpur, the river runs through Shahjehanpur, Lucknow, Kheri, Barabanki, Faizabad, Sultanpur, Varanasi, Jaunpur, and Ghazipur districts. Lucknow, Uttar Pradesh's capital, is located on the banks of the Gomti River. The Gachai, the Jomkai, the Sai, the Barna, the Saryu, the Chuha, the Kalyani, the Giri, and the Kathna are just a few of the important rivers that run through this sub-basin. The significant (P < 0.05) long term climatic effect was observed in the Gomti sub-basin using MK-test shows an increasing trend of GWL (Q = 0.09 m/year) and decreasing trend of water budget (Q = −1.09BCM/year). Results also shows that there was no significant trend (P > 0.05) found in precipitation (Q = −1.29 mm/year), evapotranspiration (Q = 0.18 mm/year), runoff (Q = 0.18 mm/year), and temperature (0.01 °C/year). Gomti shows the severe drought for the year 2014, and 2016, and moderate, mild and drought condition for different year (Fig. 10).). The percentage change in the hydrometeorological parameters over the long period of 72 years, of precipitation, evapotranspiration,runoff, water budget and temperature found as −9.10, 1.85, 43.73, −89.28 and 1.74 respectively (Fig. 12).
-
Ghaghara and Gomti Convergence: The Ghaghara and Gomti Convergence sub-basin are located in the nation between 24° 34′ to 26° 48′ north latitudes 81° 34′ to 84° 47′ east longitudes and. The Gomti and Ghaghara rivers flow into the main Ganga river in this sub-basin. The Banas Nadi, the Durgauti Nadi, the Chhoti Sarju, the Gomati, the Karamnasa, the Kao Nadi, and the Majhoi are just a few of the rivers that flow through this sub-basin. The Ganga basin's Ghaghara sub-basin has a total catchment of ∼ 28948.41 square kilometres. It flows into the states of Bihar and Uttar Pradesh. The significant (P < 0.05) long term climatic effect was observed in Ghaghra sub-basin using MK-test shows the increasing trend of evapotranspiration (Q = 1.44 mm/year), runoff (Q = 0.34 mm/year), GWL (Q = 0.06 m/year), and decreasing trend of water budget (Q = −0.62BCM/year). The insignificant trend was observed in the Ghaghra Gomti Confluence shows that precipitation (Q = 0.73 mm/year) and temperature (Q = 0.01 °C/year). This sub-basin only shows the moderate,mild and no groundwater drought condition (Fig. 9). The minimum and maximum SGWLI value ranges from −1.77 to 1.43. The percentage change in the hydrometeorological parameters over the long period of 72 years, of precipitation, evapotranspiration,runoff, water budget and temperature found as 5.00, 14.78, 81.59, −49.44, and 1.77 respectively (Fig. 13).
-
Tons: The Tons sub-basin is located between the latitudes of 23° 58′ and 25° 17′ north and the longitudes of 80° 18′ and 83° 20′ east in the nation. The Tons, the main river in this sub-basin, is the Yamuna's longest tributary. It runs across Garhwal, Uttarakhand's Himalayan westernmost region. The river rises at 3,900 m above sea level and meets the Yamuna below Kalsi. It is the Yamuna's largest tributary, with its source on the 6,315-meter-high Banderpoonch Mountain. Tons carry more water than the Yamuna. It drains mostly across Madhya Pradesh and portions of Uttar Pradesh, with a total catchment of ∼ 18200.88 square kilometres. The Satna and Belan rivers, in addition to the Tons, are important rivers in this sub-basin. The M−K test results show the significant (P < 0.05) increasing trend of evapotranspiration (Q = 1.26 mm/year), runoff (Q = 0.42 mm/year), and temperature (Q = 0.01 °C/year). No significant (P > 0.05) results were observed for precipitation (Q = 0.54 mm/year),water budget (Q = −0.38 BCM/year), and GWL (Q = 0.07 m/year). Tons shows the two severe groundwater drought condition for the year 2007, and 2008 having corresponding SGWLI values of 1.97, and 1.85. it also shows moderate,mild and no groundwater drought condition (Fig. 10). The percentage change in the hydrometeorological parameters over the long period of 72 years, of precipitation, evapotranspiration,runoff, water budget and temperature found as 3.65, 14.46, 78.94, −38.26, and 1.98 respectively (Fig. 13).
-
Son: The Sone sub-basin is located between the latitudes of 22° 40′ to 25° 42′ north and the longitudes of 80° 6′ to 85° 4′ east in the nation. The Sone, the principal river in this sub-basin, is an important Ganga right bank tributary. The river begins at the height of 600 m in Sonbhadra, Madhya Pradesh, in the Maikala range of mountains. The basin's entire catchment is ∼ 68952.87 square kilometres. The Sone and Mahanadi rivers, the Rihand, the Kanhar, the Banas, the Gopat, the Ghaghar, and the North Koel are all significant tributaries of the Sone River. The river's entire length is 784 km, with approximately 82 km in Uttar Pradesh, 500 km in Madhya Pradesh, and the rest 202 km in Bihar. The river flows into the Ganga approximately 16 km upstream of Dinapur in Bihar's Patna district. The states of Uttar Pradesh, Bihar, Jharkhand, Chhattisgarh, Madhya Pradesh and make up the sub-basin. The significant (P < 0.05) long term climatic effect was observed in the Son sub-basin using MK-test shows an increasing trend of evapotranspiration (Q = 1.26 mm/year), runoff (Q = 0.37 mm/year), GWL (Q = 0.07 m/year). Precipitation and temperature show the insignificant trend in the Son sub-basin of the Ganga river system. For the year 2010, Son sub-basin shows the extreme severe groundwater drought having SGWLI value of 2.02. It also shows severe,moderate, mild and no groundwater drought condition. The percentage change in the hydrometeorological parameters over the long period of 72 years, of precipitation, evapotranspiration,runoff, water budget and temperature found as 1.20, 10.51, 69.74, −43.18 and 0.40 respectively (Fig. 13).
-
Gandak and Others: The Gandak and others sub-basin are located in the nation between 24° 0′ to 27° 23′ north latitudes and 83° 41′ to 87° 44′ east longitudes and. The Gandak and Punpun rivers, as well as the Baya, Mohana, Dhadhar, Sakri, Harohar, Kiul, Badua, Painiar, Phalgu, Dardhu, Dardha, and Morhar, are some of the important rivers that run through this sub-basin. The Ganga basin's Gandak and other sub-basin has a total catchment of ∼ 62266.68 square kilometres. It flows across Bihar, Jharkhand, and portions of Uttar Pradesh. The hydrometeorological analysis of long term data using the M−K test shows the significant (P < 0.05) increasing trend of evapotranspiration (Q = 1.01 mm/year) runoff (Q = 0.44 mm/year), temperature (Q = 0.01 °C/year), GWL (Q = 0.05 m/year), and decreasing trend of water budget (Q = −2.15 BCM/year). An insignificant trend was observed for precipitation (Q = −0.15 mm/year). The SGWLI values ranges from −1.53 to 2.36 represents the no groundwater drought to extreme groundwater drought condition (Fig. 10). The percentage change in the hydrometeorological parameters over the long period of 72 years, of precipitation, evapotranspiration,runoff, water budget and temperature found as −0.89, 17.02, 99.43, −55.90 and 3.16 respectively (Fig. 13).
-
Kosi: The Kosi sub-basin is located between 25° 25′ to 26° 48′ north latitudes and 85° to 87° 21′ east longitudes of the nation. The Kosi is a significant branch of the Ganga River, which originates in the Himalayas at an altitude of 7,000 m. The Kosi River has a total drainage area of ∼ 74,500 square kilometres, of which is ∼ 11,000 square kilometres in India. Nepal and Tibet account for almost 80% of Kosi's catchment area. Approximately 77 per cent of the land is cultivated. The Kosi basin has a total catchment of 95,156 square kilometres, including 18,413 square kilometres in India. The Bagmati, the Balan, the Kareha, the Lakhandal, and the Kamla, are some of the important rivers flowing in this sub-basin, in addition to the main river, the Kosi and the Adhwara. The sub-basin is entirely within the state of Bihar. Because of the regular floods of the Kosi River, the river is also known as the 'Sorrow of Bihar'. The M−K test for the Kosi sub-basin shows the remarkable significant (P < 0.05) trend of the increasing trend of evapotranspiration (Q = 1.57 mm/year), runoff (Q = 0.39 mm/year), temperature (Q = 0.02 °C/year), GWL (Q = 0.04 m/year), whereas the decreasing trend of precipitation (Q = −2.63 mm/year), and water budget (Q = −1.05 BCM/year). The SGWLI for the sub-basin Kosi ranges from −1.38 to 2.07 reprenting no groundwater drought to the extreme severe drought condition (Fig. 10). The percentage change in the hydrometeorological parameters over the long period of 72 years, of precipitation, evapotranspiration, runoff, water budget and temperature found as −14.45, 14.02, 75.09, −81.43 an4.63 respectively (Fig. 13).
-
Damodar: The Damodar sub-basin is located between the latitudes of 21° 44′ to 24° 25′ north and the longitudes of 84° 35′ to 88° 20′ east in India. The Ganga basin's Damodar sub-basin has a total catchment of ∼ 45076.68 square kilometres. The Damodar is the major river, with the Usri, Barakar, and Kasai as tributaries flowing into the Damodar sub-basin. Jharkhand and West Bengal are the states where it flows. The hydro-meteorological effects on the Damodar sub-basin of Ganga using MK-test shows the significant increasing (P < 0.05) trend of precipitation (Q = 4.37 mm/year), evapotranspiration(Q = 2.68 mm/year), runoff(0.81 mm/year), temperature (0.01 °C/year), GWL (0.07 m/year), whereas insignificant (P > 0.05) trend of water budget (-0.1 BCM/year). Damodar sub-basin shows the wide range of SGWLI from −1.36 to 2.72, having all the aspect of groundwater drought as well as no drought condition. The percentage change in the hydrometeorological parameters over the long period of 72 years, of precipitation, evapotranspiration,runoff, water budget and temperature found as 22.59, 26.92, 121.69,-2.50 and 2.62 respectively (Fig. 13).
-
Bhagirathi and Others (Ganga Lower): The Bhagirathi and others (Ganga Lower) sub-basin is located in the nation between 21° 39′ to 26° 56′ north latitudes and 86° 7′ to 89° 28′ east longitudes. The main Ganga empties into the Bay of Bengal via this sub-basin. The Hoogly, the Jamuna, the Gumani, the Balason, the Dwarka, the Mayurakshi, the Bhagirathi, and the Mahananda are only a few of the drains in the sub-basin. The Ganga basin's sub-basin has a total catchment of ∼ 70605.27 square kilometres. Bihar, Jharkhand, and West Bengal are the states where it flows. Recent studies shows that the lower Ganga basin is also prone to the flood induced ecological vulnerability is high in most of the areas (Rehman et al., 2021). The yearly long term analysis of hydrometeorological parameters, including in situ GWL data, were analysed using the M−K test to analyse the upward and downward trend. The results of Bhagirathi (Lower Ganga) shows the significant P < 0.05) upward trend of precipitation (Q = 3.51 mm/year), evapotranspiration(Q = 2.6 mm/year), runoff(Q = 1.52 mm/year), temperature (Q = 0.01 °C/year), whereas water budget shows the insignificant downward trend having sen's slope of −1.13BCM/year. The minimum and maximum range of SGWLI for the Bhagirathi sub-basin was observed in the year of 1996 and 2014 respectively, it also acts as the discharge point of the Ganga after flowing to such a long path into the Bay of Bengal (Fig. 10). The percentage change in the hydrometeorological parameters over the long period of 72 years, of precipitation, evapotranspiration,runoff, water budget and temperature found as 15.89, 22.58, 98.75, −17.72 and 3.51 respectively (Fig. 13).
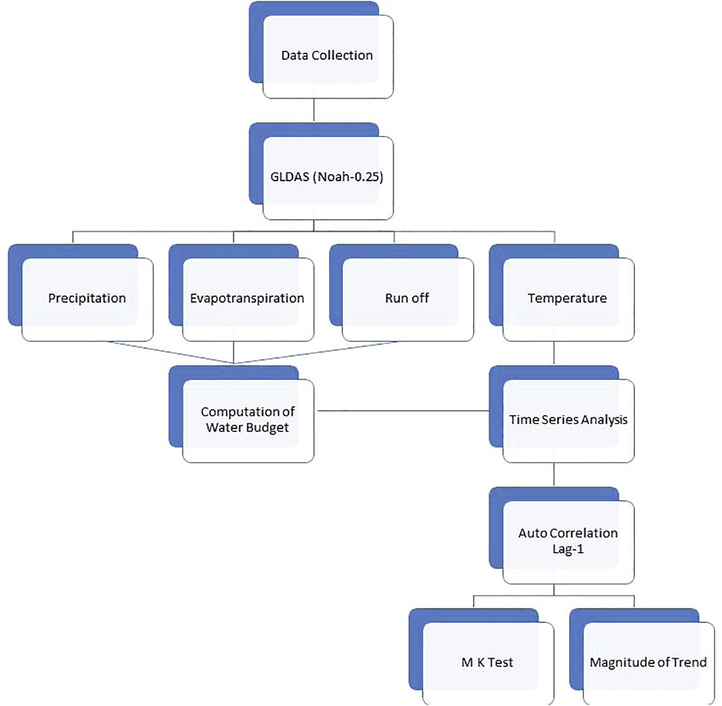
- Adopted Methodology.
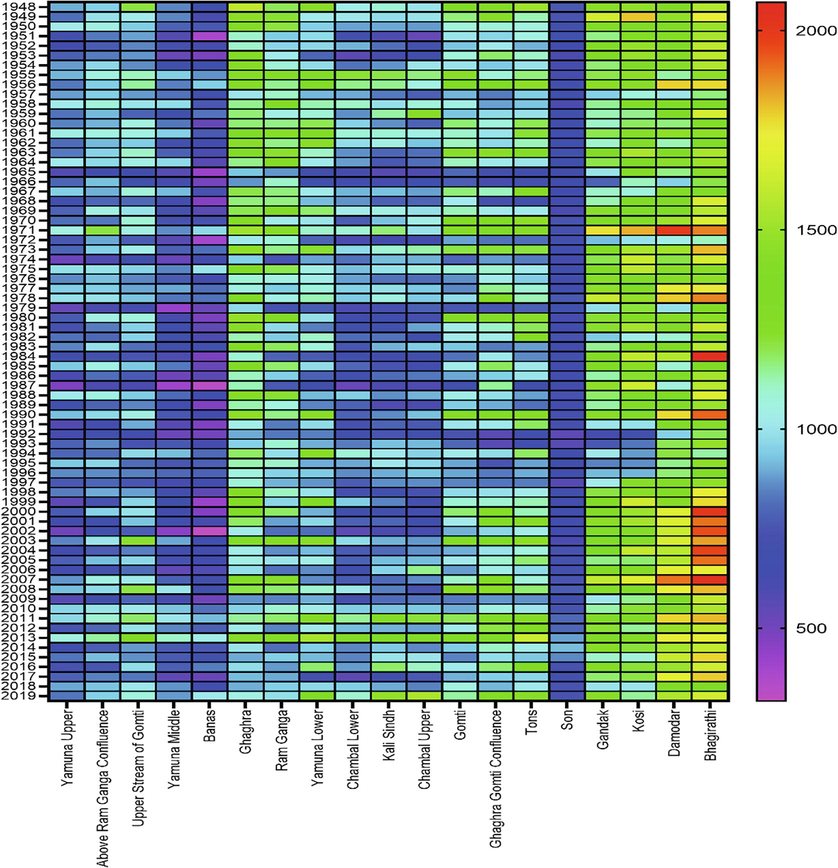
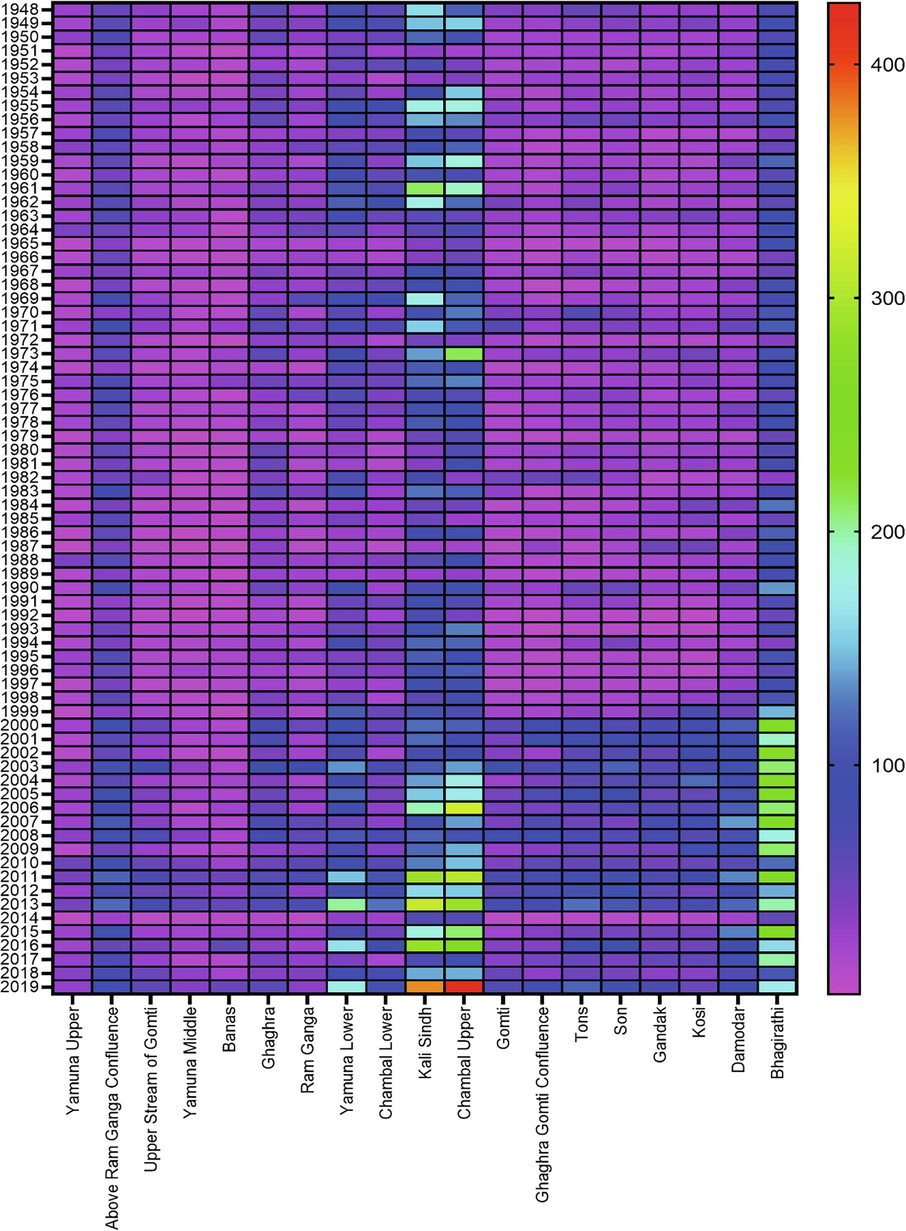
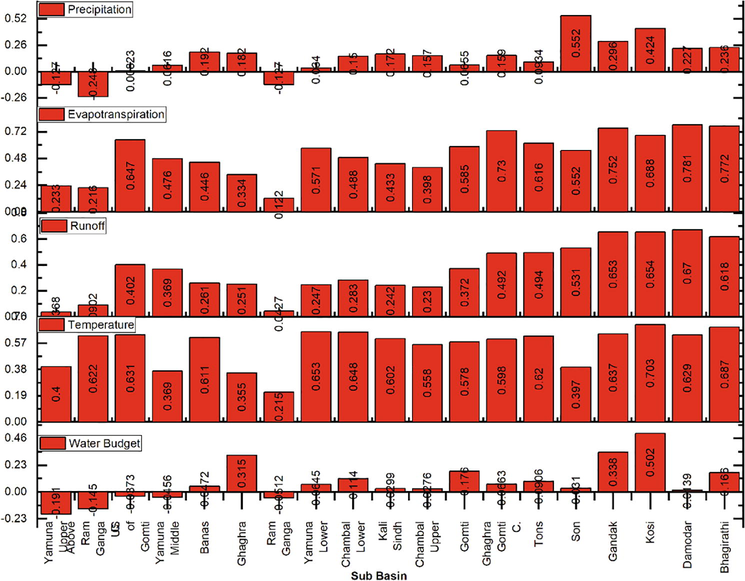
- Temporal distribution of precipitation from 1948 to 2019 in sub-basin (mm/year).
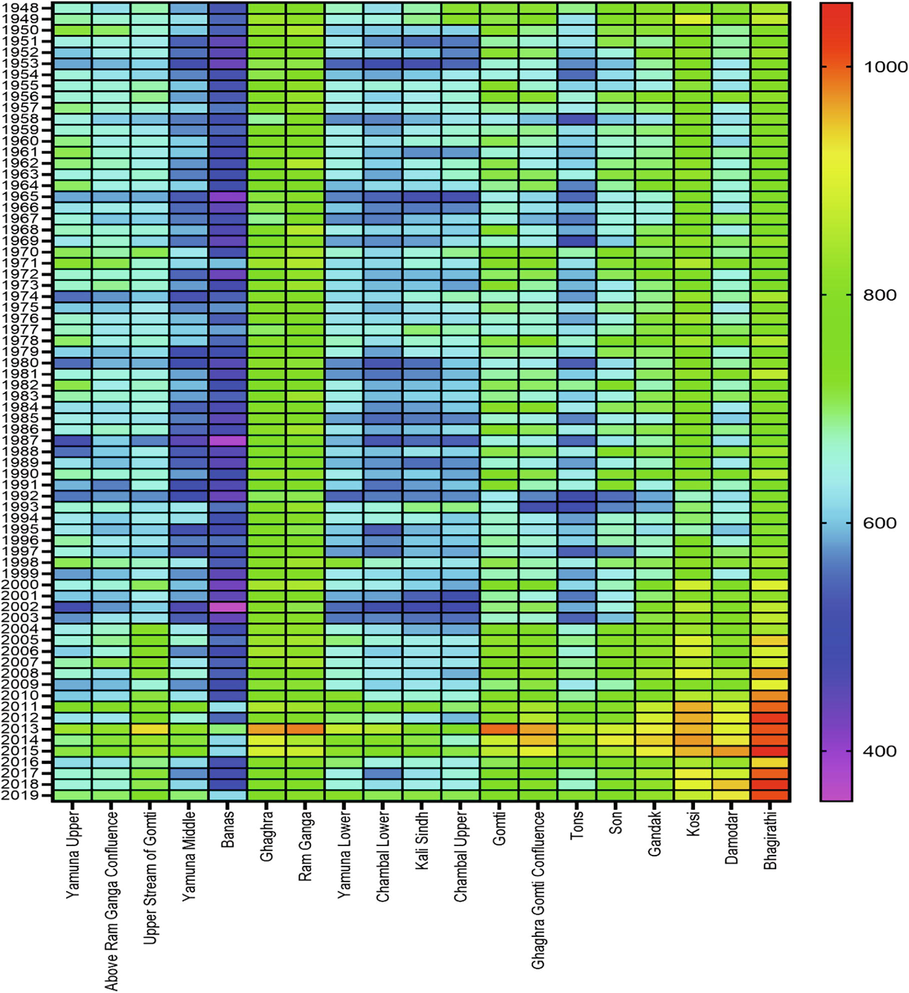
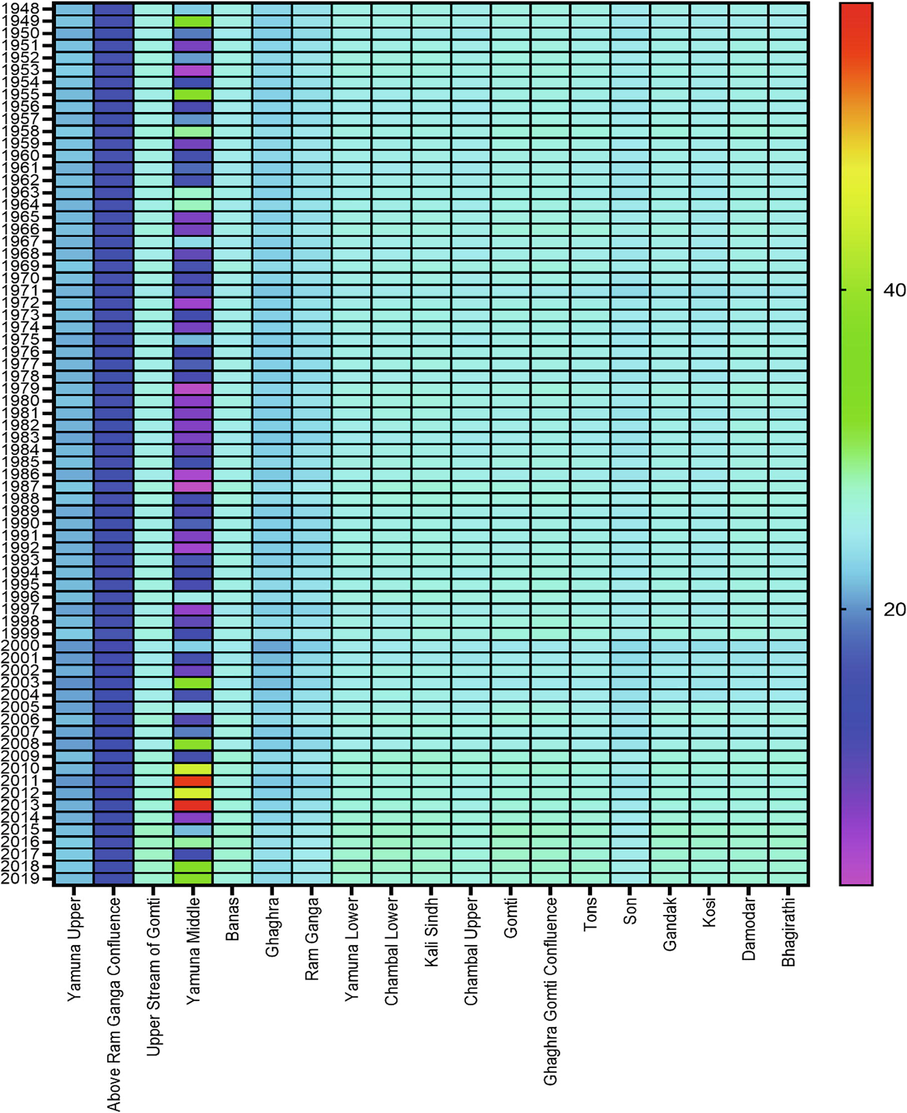
- Temporal distribution of evapotranspiration from 1948 to 2019 in sub-basin (mm/year).
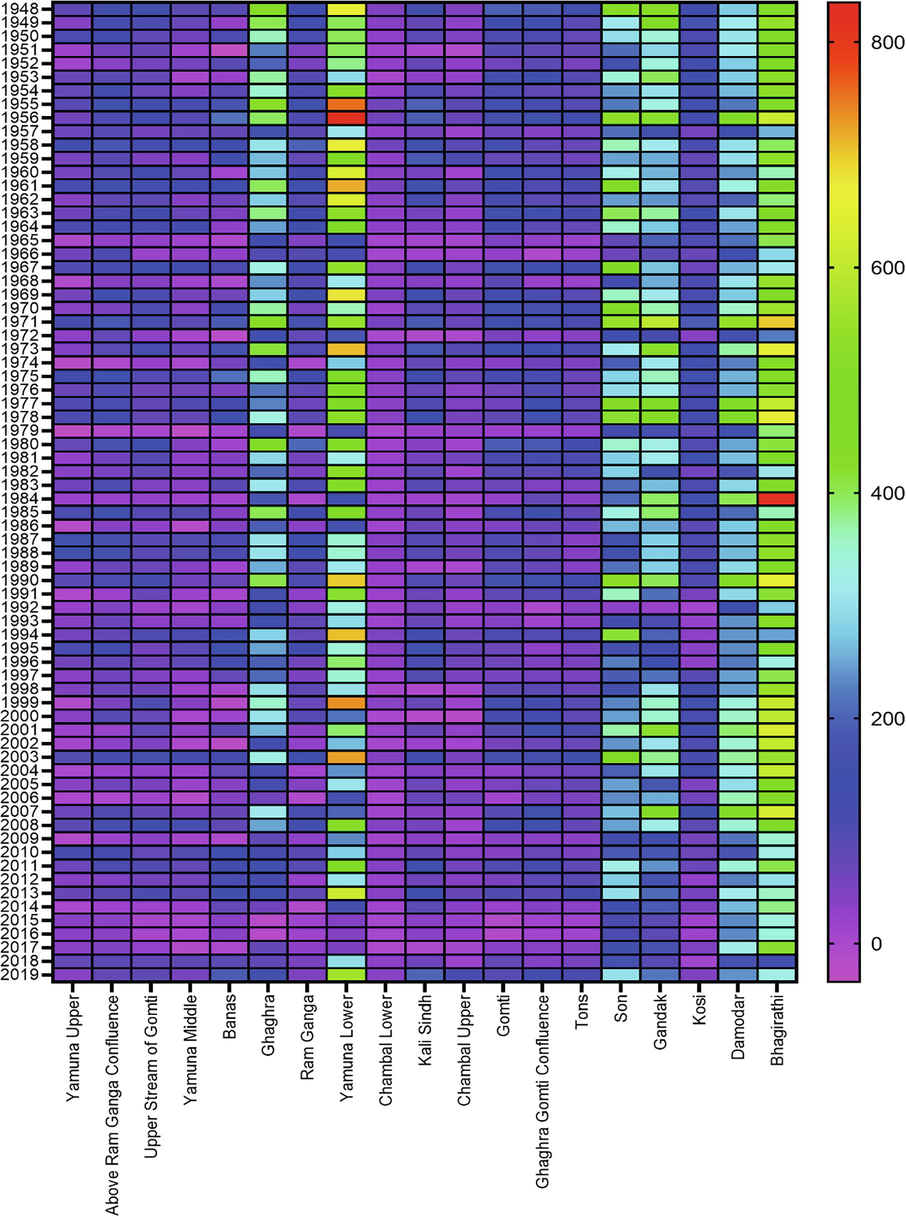
- Temporal distribution of surface runoff 1948–2019 in sub-basin (mm/year).
- Temporal distribution of temperature 1948–2019 in sub-basin (oC/year).
- Temporal distribution of water budget 1948–2019 in sub-basin (mm/year).
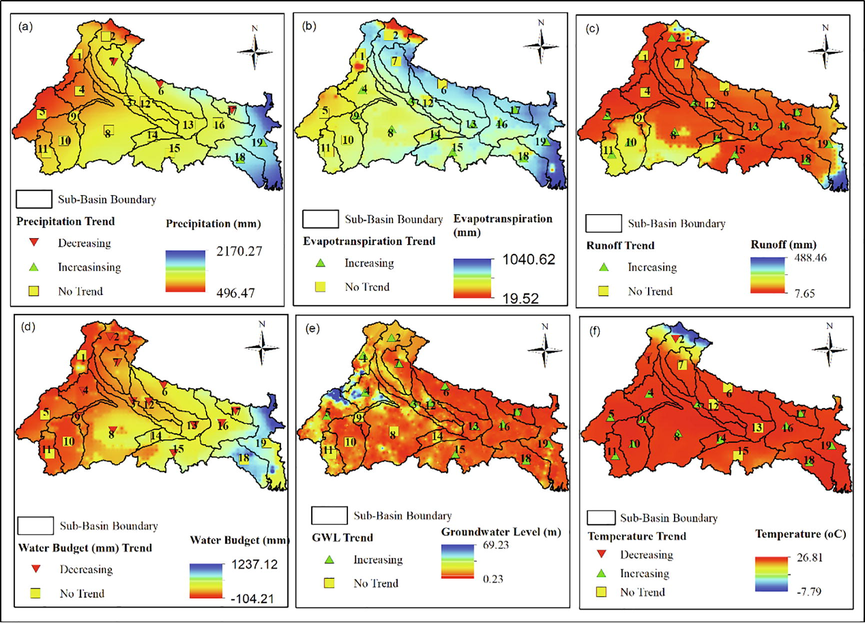
- Spatial distribution of long term trend and hydrometeorological parameters: (a) precipitation (mm), (b) evapotranspiration (mm), (c) runoff (mm), (d) water budget (mm), (e) groundwater level (mbgl), and (f) temperature (0C).
- Shows the Autocorrelation Function (ACF) at lag-1.
- Shows the Kendall Z-statistics of different sub-basin of Ganga.
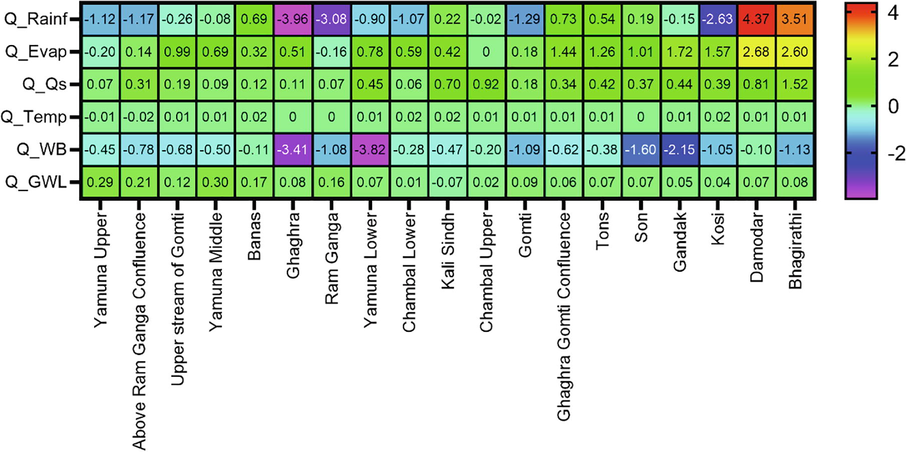
- Distribution of Sen’s slope (Q), for Q_Rainf (mm/yr), Q_Evap (mm/yr), Q_Qs (mm/yr), Q_Temp (0C/yr), Q_WB (BCM/yr), and Q_GWL (m/yr).
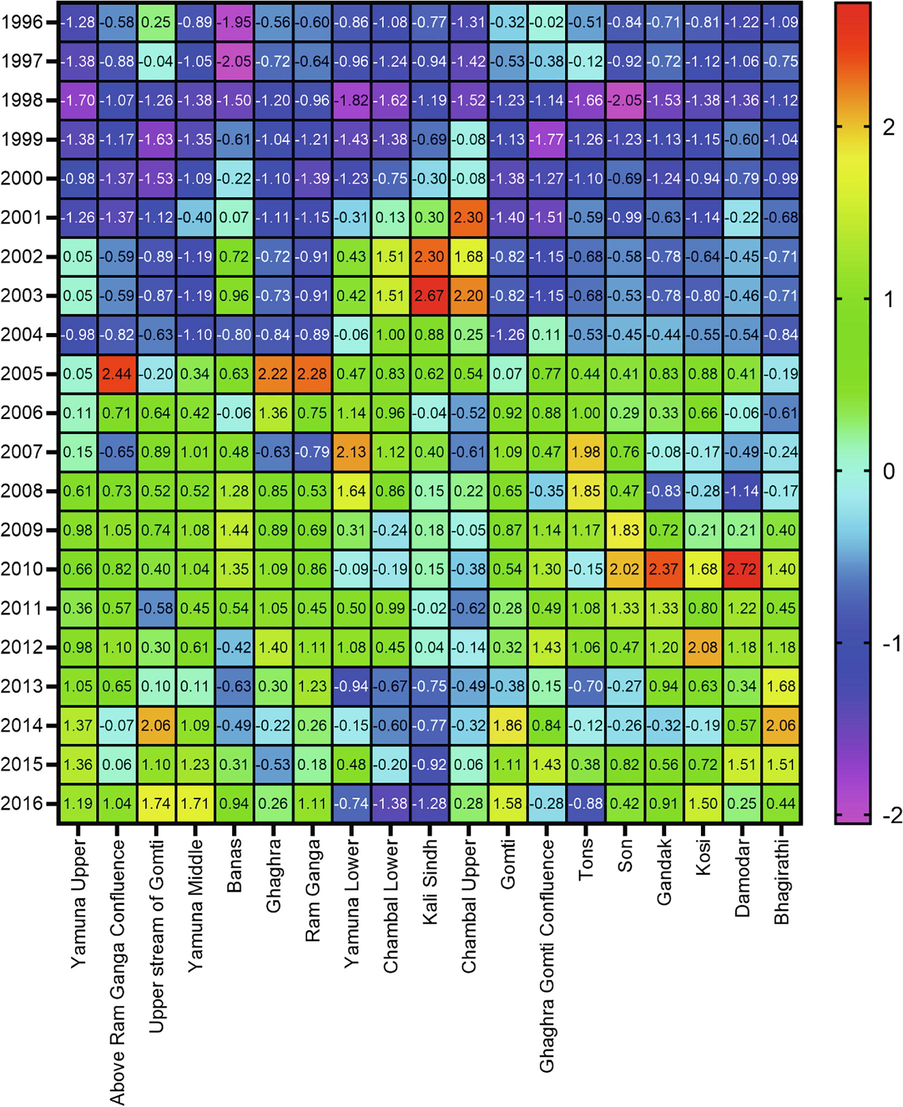
- Sub- basin characterisation of Standard Groundwater Level Drought Index (SGWLI).
| Sub-Basin ID | Sub-Basin | Extreme Severe Drought | Severe Drought | Moderate Drought | Mild Drought | No Drought |
|---|---|---|---|---|---|---|
| 1 | Yamuna Upper | 4 | 10 | 7 | ||
| 2 | Above Ram Ganga Confluence | 1 | 3 | 6 | 11 | |
| 3 | Upper stream of Gomti | 1 | 1 | 1 | 8 | 10 |
| 4 | Yamuna Middle | 1 | 4 | 6 | 9 | |
| 5 | Banas | 3 | 8 | 10 | ||
| 6 | Ghaghra | 1 | 4 | 4 | 12 | |
| 7 | Ram Ganga | 1 | 3 | 7 | 10 | |
| 8 | Yamuna Lower | 1 | 1 | 2 | 6 | 11 |
| 9 | Chambal Lower | 2 | 1 | 7 | 11 | |
| 10 | Kali Sindh | 2 | 8 | 11 | ||
| 11 | Chambal Upper | 2 | 1 | 5 | 13 | |
| 12 | Gomti | 2 | 2 | 7 | 10 | |
| 13 | Ghaghra Gomti Confluence | 4 | 7 | 10 | ||
| 14 | Tons | 2 | 4 | 2 | 13 | |
| 15 | Son | 1 | 1 | 1 | 7 | 11 |
| 16 | Gandak | 1 | 2 | 6 | 12 | |
| 17 | Kosi | 1 | 1 | 1 | 6 | 12 |
| 18 | Damodar | 1 | 1 | 2 | 5 | 12 |
| 19 | Bhagirathi | 1 | 2 | 2 | 3 | 13 |
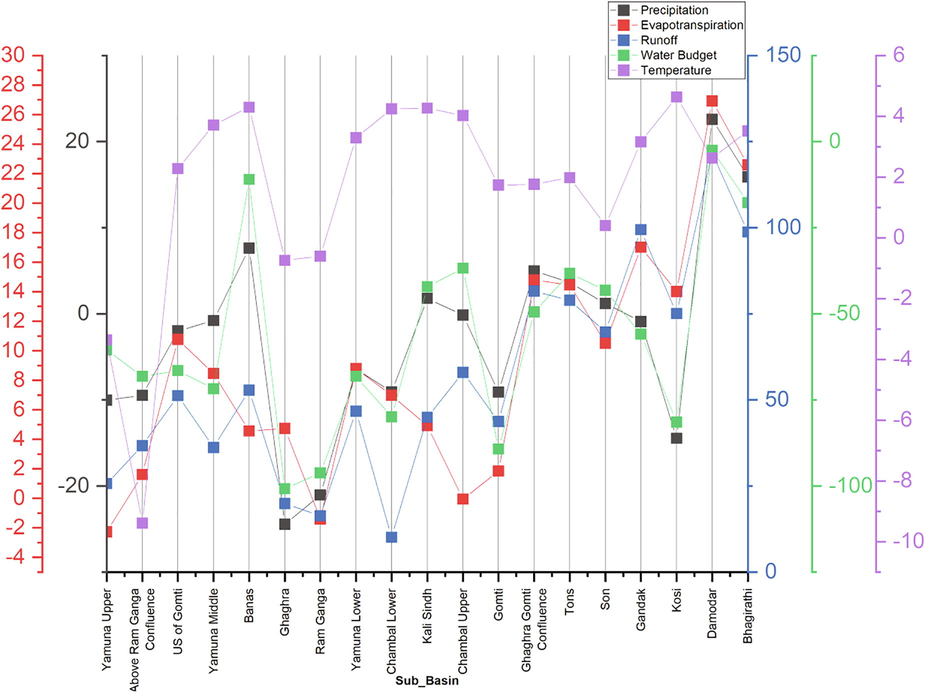
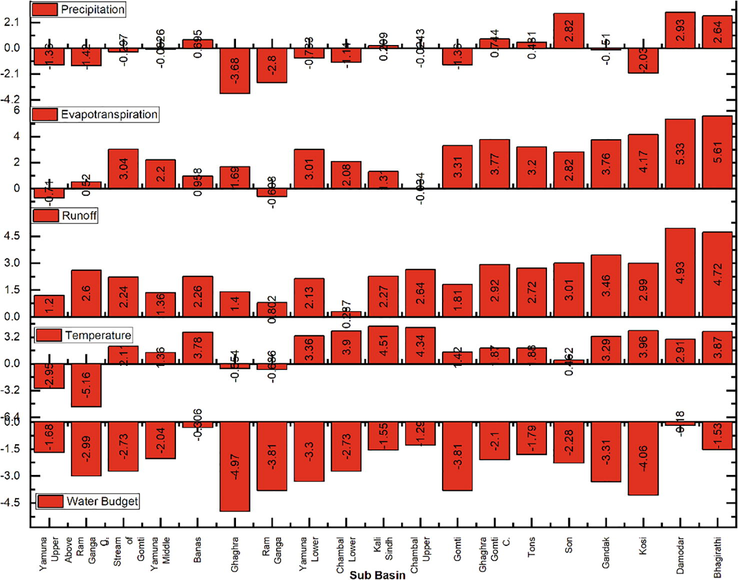
- Shows the percentage change from 1948 to 2019 in the Ganga Sub-Basin in 72 years.
5 Conclusion
In this study, we have evaluated the hydrometeorological parameters for the 19 sub-basins, and have attempted to identify the major parameters influencing groundwater availability in the region. The non-parametric MK-Test along with Sen’s slope estimate was done on the hydrometeorological data from the years 1948 to 2019 for 72 years. The hydrometeorological analysis of the water budget, including in-situ based monitoring wells used to determine the ground water drought, shows the groundwater stress. Most of the results show the statistically significant declining trend in the water budget. It is also observed that the hydrometeorological extremes also increase, leading to groundwater drought. Water storage and groundwater flow analyses in regional studies are guided by hydrometeorology, topography, land use patterns, and morphometry.
In India's water sector, inequitable water access, poor water quality, unsustainable use of groundwater, particularly in agriculture, and weak governance are some of the major concerns (https://ioraecological.com). The National Water Policy (NWP) emphasised water allocation's ecological and environmental implications. There was a focus on using hydrological units and taking into account quality, quantity, and environmental factors when making water resource decisions. According to the 2016 drought of the National Water Framework (NWF) Bill, which embodies the principles of water protection, conservation, regulation, as well as management, legal and executive action on water is permitted at all levels of government. By the analysis we have an idea about the climate change impacts on hydro-meteorological hazards. We also can develop the mitigation that measures the hydro-meteorological disasters in leading to future water scarcity. The results are extremely useful for delineating artificial recharge sites depending upon the nature of groundwater drought as a mitigation steps.
Funding statement
The authors would like to acknowledge the funding support provided by the King Saud University, Riyadh, Saudi Arabia through the Researchers Support Project Number (RSP-2021/297).
Acknowledgement
The authors thank the Central Ground Water Board (CGWB), and Giovanni (https://giovanni.gsfc.nasa.gov/giovanni/), for providing the relevant data. We are also thankful to the Indian Institute of Technology Kharagpur and Aliah University for providing assistance with all the relevant work environments and infrastructure facilities. Authors are also thankful to King Saud University, Riyadh, Saudi Arabia for providing financial support through Researchers Support Project Number (RSP-2021/297).
Declaration of Competing Interest
The authors declare that they have no known competing financial interests or personal relationships that could have appeared to influence the work reported in this paper.
References
- Bhuiyan, C., 2000. Various Drought Indices For Monitoring Drought Condition In Aravalli Terrain Of India.
- Birylo, M., 2017. Uncertainty in estimated water cycle determined with atmospheric budget , water budget and total water storage 177–184.
- Regional strategies for the accelerating global problem of groundwater depletion. Nature Geoscience. 2012;5(12):853-861.
- [Google Scholar]
- Assessment of the land surface and boundary layer models in two operational versions of the NCEP Eta model using FIFE data. Mon. Wea. Rev.. 1997;125:2896-2916.
- [Google Scholar]
- Analysis of water budget prediction accuracy using ARIMA models. Water Sci. Technol. Water Supply. 2018;18:819-830.
- [CrossRef] [Google Scholar]
- Assessment of the Water Budget from GLDAS Model. Proc. - 2018 Balt. Geod. Congr. BGC-Geomatics. 2018;2018:86-90.
- [CrossRef] [Google Scholar]
- Spatio-temporal trends of rainfall across Indian river basins. Theor. Appl. Climatol.. 2018;132:419-436.
- [CrossRef] [Google Scholar]
- Analysis of groundwater drought building on the standardised precipitation index approach. Hydrol. Earth Syst. Sci.. 2013;17:4769-4787.
- [CrossRef] [Google Scholar]
- Pan-Arctic river discharge: Prioritizing monitoring of future. Earth’s Futur.. 2017;5:72-92.
- [CrossRef] [Google Scholar]
- CGWB, 2012. Manual on Aquifer Mapping, Government of India, Ministry of Water Resources. Gov. India, Minist. Water Resour. Gr. Water Board 72.
- Rainfall and river flow trends using Mann-Kendall and Sen’s slope estimator statistical tests in the Cobres River basin. Nat. Hazards. 2015;77:1205-1221.
- [CrossRef] [Google Scholar]
- The Common Land Model. Bulletin of the American Meteorological Society. 2003;84(8):1013-1023.
- [Google Scholar]
- Trends in reference crop evapotranspiration over Iran. J. Hydrol.. 2011;399:422-433.
- [CrossRef] [Google Scholar]
- Estimating water volume variations in lakes and reservoirs from four operational satellite altimetry databases and satellite imagery data. Remote Sens. Environ.. 2013;134:403-416.
- [CrossRef] [Google Scholar]
- An improved methodology to estimate river stage and discharge using Jason-2 satellite data. J. Hydrol.. 2015;529:1776-1787.
- [CrossRef] [Google Scholar]
- Flood hazard mapping using FLO-2D and local management strategies of Dire Dawa city, Ethiopia. Journal of Hydrology: Regional Studies. 2018;19:224-239.
- [CrossRef] [Google Scholar]
- Flow dynamics and turbulence patterns in a drainage channel colonized by common reed (Phragmites australis) under different scenarios of vegetation management. Ecological Engineering. 2019;133:39-52.
- [CrossRef] [Google Scholar]
- Predictive model of bulk drag coefficient for a nature-based structure exposed to currents. Sci. Rep.. 2021;11:3517.
- [CrossRef] [Google Scholar]
- Water in Crisis: A Guide to the World’s Fresh Water Resources. New York, USA: Oxford University Press; 1993.
- Advancing ecohydraulics and ecohydrology by clarifying the role of their component interdisciplines. J. Ecohydraulics. 2019;4(2):172-187.
- [CrossRef] [Google Scholar]
- Global land data assimilation system (GLDAS) products from nasa hydrology data and information services center (HDISC). Am. Soc. Photogramm. Remote Sens. - ASPRS Annu. Conf. 2008 - Bridg. Horizons New Front. Geospatial Collab.. 2008;1:183-190.
- [Google Scholar]
- Halder, S., Roy, M.B., Roy, P.K., 2020. Analysis of groundwater level trend and groundwater drought using Standard Groundwater Level Index : a case study of an eastern river basin of West Analysis of groundwater level trend and groundwater drought using Standard Groundwater Level Index : a case 1–2. https://doi.org/10.1007/s42452-020-2302-6.
- Tracking water level changes of the Amazon Basin with space-borne remote sensing and integration with large scale hydrodynamic modelling: A review. Phys. Chem. Earth. 2011;36:223-231.
- [CrossRef] [Google Scholar]
- Groundwater quality assessment in the Lower Ganga Basin using entropy information theory and GIS. J. Clean. Prod.. 2020;274:123077
- [CrossRef] [Google Scholar]
- Water budgets: Foundations for effective water- resources and environmental management: U.S. Geological Survey Circular 1308, 90 p. Ars Comb.. 2007;95:65-70.
- [CrossRef] [Google Scholar]
- Jarraud, M., Steiner, A., 2012. Summary for policymakers, Managing the Risks of Extreme Events and Disasters to Advance Climate Change Adaptation: Special Report of the Intergovernmental Panel on Climate Change. https://doi.org/10.1017/CBO9781139177245.003
- On the indirect estimation of wind wave heights over the southern Coasts of Caspian Sea: A comparative analysis. Water. 2022;14:843.
- [CrossRef] [Google Scholar]
- Trends in heavy precipitation in the Czech Republic over 1961-2005. Int. J. Climatol.. 2009;29:1745-1758.
- [Google Scholar]
- Bulk Drag Predictions of Riparian Arundo donax Stands through UAV-acquired Multispectral Images. Water. 2021;13:1333.
- [CrossRef] [Google Scholar]
- Hydraulic Efficiency of Green-Blue Flood Control Scenarios for Vegetated Rivers: 1D and 2D Unsteady Simulations. Water. 2021;13(19):2620.
- [Google Scholar]
- Evaluation of Flow Resistance Models Based on Field Experiments in a Partly Vegetated Reclamation Channel. Geosciences. 2020;10:47.
- [CrossRef] [Google Scholar]
- Modeling depth-averaged streamwise velocity in a channel with one-line emergent vegetation patches. River Res. Appl.. 2021;1–9
- [CrossRef] [Google Scholar]
- A simple hydrologically based model of land surface water and energy fluxes for GSMs. J. Geophys. Res. 1994;99(D7):14415-14428.
- [Google Scholar]
- Sediment deposition within and around a finite patch of model vegetation over a range of channel velocity. Water Resour. Res.. 2016;52:600-612.
- [CrossRef] [Google Scholar]
- Water budget closure based on GRACE measurements and reconstructed evapotranspiration using GLDAS and water use data for two large densely-populated mid-latitude basins. J. Hydrol.. 2017;547:585-599.
- [CrossRef] [Google Scholar]
- Report AR4, The Physical Sciences Basis. In: Climate Change 2007. Cambridge, UK: Cambridge University Press; 2007.
- [Google Scholar]
- Rank Correlation Methods. London: Charles Griffi; 1975.
- Comparison of Mann-Kendall and innovative trend method for water quality pa- rameters of the Kizilirmak River. Turkey. J Hydrol. 2014;513(26):362-375.
- [CrossRef] [Google Scholar]
- Groundwater Management in India: Status, Challenges and a Framework for Responses. In: Groundwater of South Asia. Singapore: Springer; 2018. p. :615-642.
- [Google Scholar]
- Long-term climatic trend analysis of Giridih district, Jharkhand (India) using statistical approach. Model. Earth Syst. Environ.. 2016;2:116.
- [CrossRef] [Google Scholar]
- Water budget. Environmental Science and Engineering (Subseries: Environmental Science) 2012
- [CrossRef] [Google Scholar]
- Rainfall and river flow trends using Mann–Kendall and Sen’s slope estimator statistical tests in the Cobres River basin. Nat Hazards. 2015;77(2):1205-1221.
- [Google Scholar]
- Trend analysis of long-term temperature time series in the Greater Toronto Area (GTA) Theor. Appl. Climatol.. 2010;101:311-327.
- [CrossRef] [Google Scholar]
- Neeti, N., Eastman, J.R., 2011. A Contextual Mann-Kendall Approach for the Assessment of Trend Significance in 15, 599–611. https://doi.org/10.1111/j.1467-9671.2011.01280.x
- Trend analysis of seasonal rainfall and temperature pattern in Kalahandi, Bolangir and Koraput districts of Odisha. India. Atmos. Sci. Lett.. 2019;20:1-10.
- [CrossRef] [Google Scholar]
- Trends in flood magnitude, frequency and seasonality in Germany in the period 1951–2002. J. Hydrol. 2009;371:129-141.
- [Google Scholar]
- Multimodel assessment of water budget in Indian sub-continental river basins. J. Hydrol.. 2021;603:126977
- [CrossRef] [Google Scholar]
- Evaluation of IPCC AR4 global climate model simulation over the Yangtze River Basin. IAHS-AISH Publ.. 2011;346:144-149.
- [Google Scholar]
- S. Rehman M.S.U. Hasan A.K. Rai M.H. Rahaman R. Avtar H. Sajjad Integrated approach for spatial flood susceptibility assessment in Bhagirathi sub-basin, India using entropy information theory and geospatial technology.
- Assessing flood-induced ecological vulnerability and risk using GIS-based in situ measurements in Bhagirathi sub-basin, India. Arab J Geosci. 2021;14(15)
- [Google Scholar]
- GCIP water and energy budget synthesis (WEBS) J. Geophys. Res. D Atmos.. 2003;108
- [CrossRef] [Google Scholar]
- The Global Land Data Assimilation System. Bull. Amer. Meteor. Soc.. 2004;85:381-394.
- [CrossRef] [Google Scholar]
- Satellite-based estimates of groundwater depletion in India. Nature. 2009;460:999-1002.
- [CrossRef] [Google Scholar]
- 33 years of globally calibrated wave height and wind speed data based on altimeter observations. Sci. Data. 2019;6:77.
- [CrossRef] [Google Scholar]
- Influence of Spatial Resolution for Vegetation Indices' Extraction Using Visible Bands from Unmanned Aerial Vehicles' Orthomosaics Datasets. Remote Sens.. 2021;13:3238.
- [CrossRef] [Google Scholar]
- Wave height predictions in complex sea flows through soft computing models: Case study of Persian Gulf. Ocean Eng.. 2022;245:110467
- [CrossRef] [Google Scholar]
- The Sustainable Development Goals Report. New York: United Nations; 2018.
- A simple biosphere model (SiB) for use within general circu- lation models. Atmos. Sci.. 1986;43:505-531.
- [Google Scholar]
- Inferring changes in terrestrial water storage using ERA-40 reanalysis data: The Mississippi River basin. J. Clim.. 2004;17:2039-2057.
- [CrossRef] [Google Scholar]
- Groundwater Drought in the Northwestern Districts of Bangladesh. Water Resour Manage. 2010;24(10):1989-2006.
- [Google Scholar]
- Development of a 50-yr high-resolution global dataset of meteorological forcings for land surface modeling. J. Climate. 2006;19(13):3088-3111.
- [Google Scholar]
- Water budget analysis within the surrounding of prominent lakes and reservoirs from multi-sensor earth observation data and hydrological models: Case studies of the Aral Sea and Lake Mead. Remote Sens.. 2016;8(11):953.
- [Google Scholar]
- Spennemann, P.C., Rivera, J.A., Celeste Saulo, A., Penalba, O.C., Rui, H., Beaudoing, H.K., 2015. README Document for GLDAS Version 2 Data Products. Goddard Earth Sci. Data Inf. Serv. Cent. (GES DISC) 16, 1–32. https://doi.org/http://hydro1.sci.gsfc.nasa.gov/ data/s4pa/GLDAS/GLDAS_NOAH10_M.2.0/doc/README_ GLDAS2.pdf.
- Methods for inferring regional surface-mass anomalies from Gravity Recovery and Climate Experiment (GRACE) measurements of time-variable gravity. J. Geophys. Res.. 2002;107(B9):ETG 3-1-ETG 3-13.
- [Google Scholar]
- A rank invariant method of linear and polynomial regressionanalysis, Part 3. Nederl. Akad. Wetensch. Proc.. 1950;53:1397-1412.
- [Google Scholar]
- Flow-seaweed interactions of Saccharina latissima at a blade scale: turbulence, drag force, and blade dynamics. Aquat Sci. 2019;81:61.
- [CrossRef] [Google Scholar]
- Water balance-based actual evapotranspiration reconstruction from ground and satellite observations over the conterminous United States. Water Resour. Res.. 2015;51:6485-6499.
- [CrossRef] [Google Scholar]
- Effect of High-Frequency Sea Waves on Wave Period Retrieval from Radar Altimeter and Buoy Data. Remote Sens.. 2016;8:764.
- [CrossRef] [Google Scholar]
- Regional stream flow trend detection with consideration of both temporal and spatial autocorrelation. Internat. J. Climatol.. 2002;22:923-946.
- [Google Scholar]
- Measuring water storage fluctuations in Lake Dongting, China, by Topex/Poseidon satellite altimetry. Environ. Monit. Assess.. 2006;115:23-37.
- [CrossRef] [Google Scholar]


