

Translate this page into:
Hydrochemical characterization of geothermal and non-geothermal waters from Wadi Fatima, western Saudi Arabia
⁎Corresponding author. Falshehria@ksu.edu.sa (Fahad Alshehri)
-
Received: ,
Accepted: ,
This article was originally published by Elsevier and was migrated to Scientific Scholar after the change of Publisher.
Peer review under responsibility of King Saud University.
Abstract
The present study was conducted in the Wadi Fatima catchment in western Saudi Arabia with the primary objective of finding the major hydrochemical differences among geothermal and non-geothermal groundwater samples. Based on the dissolved-silica content of 124 groundwater samples, the chalcedony geothermometer with no steam loss was used to classify them as geothermal or non-geothermal. The mean total dissolved solids (TDS) of the non-geothermal and geothermal samples were 1254 mg/L and 4389 mg/L, respectively. The high TDS of the geothermal samples can be attributed to the higher temperature of circulation leading to a greater degree of mineral dissolution, as well as the mixing of fresh, shallow groundwater with deeper saline water, as can be seen on Piper and Durov plots. Silicate weathering is the primary hydrochemical process active in the area. Based on the saturation indices of commonly dissolved mineral phases, the geothermal water samples showed higher saturation. Using chalcedony geothermometer can be an effective tool for classifying groundwater from low-temperature reservoirs as geothermal and non-geothermal. Further groundwater facies analysis, ionic relationships, and saturation indices can be employed to determine hydrochemical characteristics of these two different types of waters.
Keywords
Wadi Fatima
Silica thermometry
Groundwater mixing
Saturation index

1 Introduction
The Arabian Peninsula, especially Saudi Arabia, is under extreme water stress owing to high demand and limited availability (Lezzaik and Milewski 2018). Surface-water supplies in Saudi Arabia are meager and are derived mainly from water stored behind >400 dams across the country (Zaharani et al. 2011) but mainly in the southern and southwestern regions, where rainfall is higher than the national mean (Almazroui et al. 2012). Non-renewable groundwater stored in the sedimentary formations of the Arabian platform form the main water-supply resource in the kingdom and constitute >80% of the total water available for agricultural, domestic, and industrial consumption (Rehman et al. 2020). Groundwater stored in the shallow alluvial aquifers within the valleys of the Arabian platform and Arabian Shield and the unconsolidated deposits along the coast make up a small share of the available groundwater resources (DeNicola et al. 2015).
The situation is compounded when groundwater availability is coupled with deterioration in groundwater quality, especially in the non-renewable water stored in the sedimentary aquifers that are characterized by high dissolved-solids content, rendering it unfit for consumption without any treatment (Zaidi et al. 2019). Groundwater pollution from agricultural activities (Alabdula’aly et al. 2010), trace metals (Basahi et al. 2018), and heavy metals (Alomar et al., 2020) also have been reported from different parts of the kingdom. Western Saudi Arabia is drained by several wadis formed by the drainage of ephemeral streams originating in the highlands of the Arabian Shield and draining toward the Red Sea. The alluvial deposits along these wadi channels are an essential source of local groundwater supply. Groundwater-quality investigations have been performed for many of the wadis (Marko et al. 2014; Rajmohan et al. 2019).
Wadi Fatima is a major wadi in western Saudi Arabia and is the largest northeast–southwest-trending wadi in the western Arabian Shield. Various aspects have been investigated by many researchers, including groundwater quality (Alyamani and Hussein 1995; Sharaf 2013); groundwater exploration by geophysics (Al-Garni 2009); subsurface structural mapping by geophysics (Al-Garni 2010); and description of the arid geomorphic features by remote sensing (Alwash et al. 1986).
The objective of the present study was to investigate the groundwater quality in Wadi Fatima with a particular emphasis on silica hydrochemistry. Based on the dissolved-silica content and the application of commonly used silica geothermometers (Khan and Umar, 2010; Khan et al. 2015; Wang et al. 2018), groundwater from the study area was classified as geothermal and non-geothermal, and the groundwater characteristics were investigated. The present study is the first of its kinds which involves the hydrochemical assessment of groundwater samples from wadi Fatima after its classification as geothermal or non-geothermal based on its dissolved silica content. The chalcedony geothermometer used in this study gives an idea about the aquifer temperature and the technique if combined with other geothermometers and measurements of stable isotopes in groundwater, can give an idea about the source and the depth of circulation of the geothermal water. This can further help in determining whether the given reservoir can be considered as a potential source of geothermal energy or not.
2 Study-area description
2.1 Topography and climate
Wadi Fatima is one of the major drainage basins in western Saudi Arabia trending in an east–west direction, perpendicular to the Red Sea coast; it occupies an area of ∼ 5400 km2. It is a seventh-order basin, and includes two physiographic divisions of Saudi Arabia, the western coastal plain and the Hijaz escarpment (Sarwat Mountains) (Fig. 1). As a result, a wide variation in topographic relief ranging from sea level (Red Sea coast) to 2300 m in the highlands of the Arabian Shield can be seen within the basin. A wide variation in the rainfall pattern and temperature are observed in both the upper and lower reaches of the wadi owing to the variation in topography (Şen et al. 2017). The eastern part of the basin, which is at a higher elevation, receives a mean annual rainfall of 150 mm, whereas the western low-lying area of the basin gets 80 mm on average (Niyazi et al. 2014). Similarly, the minimum and maximum temperature varies within 23 °C–32 °C along the coast but is ∼15 °C–28 °C in the highlands.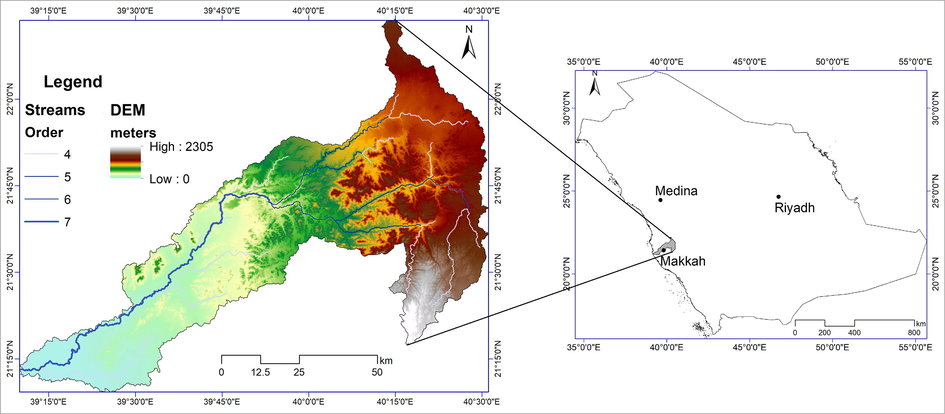
Map showing location, digital elevation model (DEM), and drainage pattern within Wadi Fatima catchment.
2.2 Geology
The stark difference in topography is also reflected in the geology, as the western parts of the basin consist of Quaternary coastal deposits, whereas the eastern part comprises Precambrian basement rocks of the Arabian Shield (Fig. 2). Wadi Fatima is within the rifted western margin of the Arabian Shield, which represents a major southwest‐trending fault zone that has been active since the Precambrian (Grainger 1992). A major part of the study area is composed of late Proterozoic volcanic to volcaniclastic rocks that have been subjected to multiphase deformation, metamorphism, with igneous intrusions. The northeastern part of the basin is covered by the Quaternary basalts of Harrat Rahat. Along the wadi channel and in the coastal areas are surficial unconsolidated Quaternary deposits, including eolian sands and alluvial fan and terrace deposits, covering Tertiary sediments of the Shumaysi Formation (Al-Garni 2009). The Precambrian Fatima Formation, consisting of clastic sedimentary rocks, lies in the northwestern part of the study area, north of the main wadi channel (Fig. 2).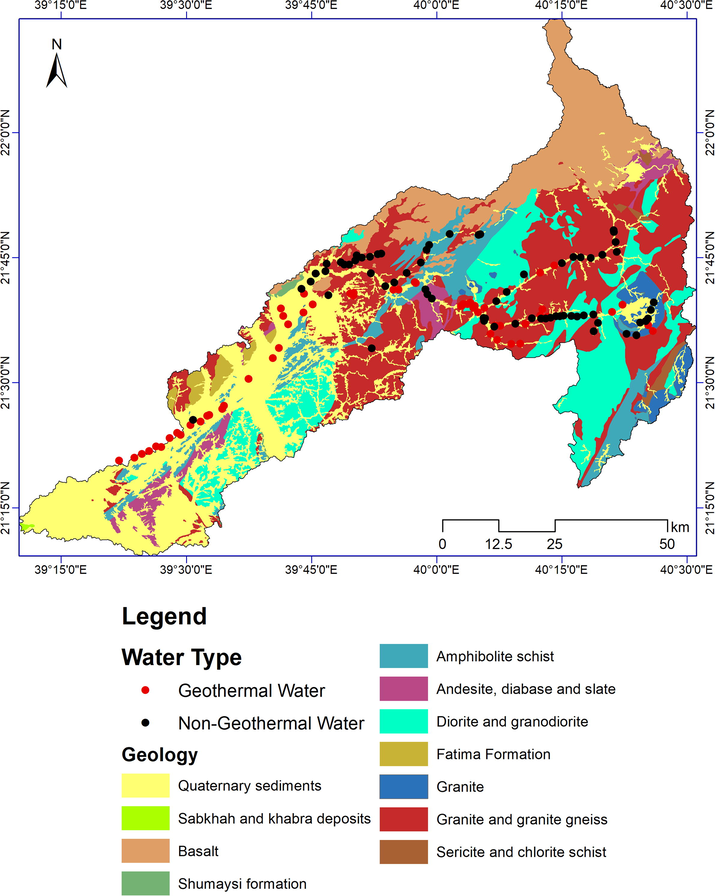
Geological map of Wadi Fatima catchment, adapted from Brown et al. (1963), and location of groundwater sampling sites within catchment.
2.3 Hydrogeology
The thickness of the unconsolidated alluvial deposits within the Wadi Fatima drainage basin varies from 10 to 20 m in the Arabian Shield to ∼ 80 m in the coastal plains. The deposits comprise mainly conglomerate, sandstone, and mudstone (Sharaf 2013). In the Arabian Shield, the weathering of the basement rocks has resulted in secondary porosity supporting shallow aquifers (Sharaf et al. 2004). Overall, transmissivity values of the unconfined aquifer range within 300–1800 m2/day, and specific-yield values range within 0.12–0.2. Recharge of the shallow aquifer is mainly from the infrequent runoff events, which saturate the unconsolidated alluvial deposits above the weathered basement right after the rainfall events. However, a rapid decline in the water table occurs owing to evaporation and the infiltration of water to the underlying weathered and fractured basement (Alyamani and Hussein 1995).
3 Methodology
Major-ion and silica concentrations were obtained for 124 groundwater samples from the Saudi Geological Survey. Standard groundwater sampling procedures as prescribed by APHA (2012) were used. The physical parameters such as EC, TDS, temperature and pH were measure directly in the field using multi-parameter pocket meters. The major ions were analyzed using ion chromatography whereas silica analysis was done using spectrophotometry. The charge balance error (CBE) was calculated for the samples and the samples used in this study had a CBE of <5%. The samples were divided into two different classes (geothermal and non-geothermal) based on Fournier’s (1977) no-steam-loss chalcedony geothermometer. The samples were then compared using different methods to determine the dominant hydrochemical processes operating within the two classes. Piper (GW_Chart) and extended Durov plots (Al-Bassam and Khalil 2012) were prepared to identify the different hydrochemical facies present in the area. Ionic comparisons were made in Microsoft Excel, and saturation indices of the major mineral species present in the groundwater were calculated by applying PHREEQC v.3 interactive software (Parkhurst and Appelo 1999). Location and geology maps were prepared in ArcGIS 10.6.
4 Results and discussion
The boxplot of the major ions and SiO2 in the analyzed groundwater samples shows the minimum and maximum values, the first and third quartiles, and the median and mean (Fig. 3). Na and Cl are the dominant ions. The total dissolved solids (TDS) of the 124 samples range from 411 − 17,969 mg/L. The minimum and maximum values, mean, and standard deviation for the measured parameters (including pH, TDS, and chemical components) of the non-geothermal and geothermal groundwater samples are compiled in Table 1.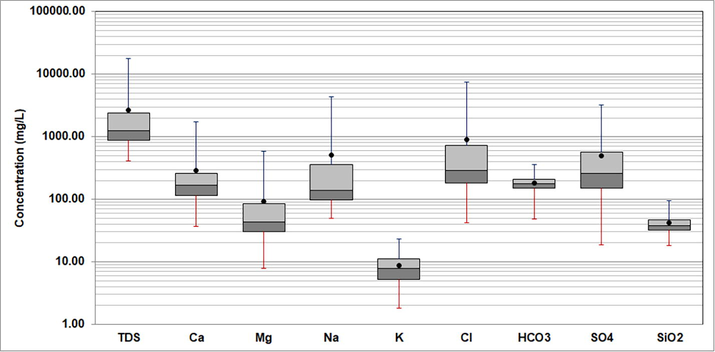
Boxplot showing minimum and maximum, median and mean, and first and third quartile values of analyzed parameters in groundwater.
Parameter
Minimum
Maximum
Mean
Standard deviation
N-GeoT
GeoT
N-GeoT
GeoT
N-GeoT
GeoT
N-GeoT
GeoT
pH
7.00
7.00
8.11
8.00
7.26
7.35
0.25
0.34
TDS
411.00
614.00
5715.00
17,969.00
1253.91
4388.61
849.87
4445.76
Ca
36.40
62.40
538.50
1740.00
169.92
427.60
100.40
396.68
Mg
7.80
21.80
162.10
579.60
43.81
147.61
29.94
147.33
Na
50.00
72.40
1515.00
4359.00
162.02
922.46
210.29
1111.14
K
2.70
1.80
22.00
23.10
9.82
7.68
4.58
5.03
Cl
41.80
62.20
2113.30
7478.00
335.00
1567.38
346.78
1892.60
HCO3
47.80
133.30
295.50
360.10
166.89
199.33
39.66
43.31
NO3
2.04
3.10
355.00
2150.00
107.60
336.73
73.12
384.88
SO4
18.50
69.20
1299.00
3264.00
262.14
784.09
210.65
751.63
SiO2
18.10
40.30
39.00
94.70
31.06
55.31
5.92
14.73
4.1 Silica geothermometry
The presence of dissolved silica in groundwater results mostly from rock–water interaction causing chemical weathering of silicate minerals in the aquifer. The concentration of dissolved silica in the groundwater depends in part on residence time of the groundwater in the aquifer. In the analyzed samples, silica concentration ranged within 18.10–94.70 mg/L and averaged 42.20 mg/L. The amount of dissolved silica in groundwater is also an indicator of the depth of groundwater circulation, as studies have shown that groundwater originating from greater depths has relatively higher silica content (Fournier and Rowe 1966). Given the average geothermal gradient, groundwater rising from greater depths is assumed to have originated from reservoirs at higher temperatures. Accordingly, the solubility of silica in groundwater is controlled by not only the residence time of groundwater in the aquifer but also the reservoir temperature (Wang et al. 2018).
Because the solubility of SiO2 in groundwater is related to both the temperature and pressure in the reservoir, silica geothermometers commonly have been used in geothermal studies to determine the temperature of the circulating water (Arnórsson 2000). The dissolution of silica in groundwater can be represented as SiO2 + H2O → H4SiO4. Although silica has low solubility in groundwater at temperatures of <180 °C, its polymorphs, such as chalcedony, which has a less-ordered crystalline structure, is frequently used as a geothermometer for calculating groundwater temperature. Fournier’s (1977) no-steam-loss chalcedony geothermometer was used in this study to determine the temperature of circulating groundwater:
As mentioned earlier, SiO2 in groundwater is derived purely from rock–water interaction, whereas Cl in groundwater can be derived from geogenic or anthropogenic sources (Kincaid and Findlay 2009). A wide variation in Cl concentration for particular values of SiO2 concentrations in different groundwater samples can indicate that the Cl was derived from anthropogenic sources (Mukate et al. 2018). The plot of Cl versus SiO2 (Fig. 4a) shows lower Cl contents (mean, 335 mg/L) for the non-geothermal samples (SiO2 < 40 mg/L) than for the geothermal samples (SiO2 > 40 mg/L), which average 1567.4 mg/L. Because wide variation in Cl values for similar values of SiO2 is not clearly shown by the plot, the possibility of anthropogenic input of Cl to groundwater can be ruled out. The plot of TDS versus SiO2 (Fig. 4b) shows a similar pattern, with non-geothermal groundwater samples exhibiting a lower mean value of TDS (1254 mg/L) compared to that of the geothermal water (4389 mg/L). The higher Cl and TDS values for geothermal waters indicate a greater degree of mineral dissolution at the higher temperature of circulating water. However, the lack of a good correlation between increasing SiO2 concentration and TDS values indicates that groundwater TDS is also controlled by geogenic factors other than silicate dissolution. The plot of Cl versus TDS (Fig. 4c) shows a strong robust correlation for both non-geothermal and geothermal waters, indicating that the groundwater TDS is strongly influenced by Cl dissolution in groundwater. The source of Cl could be from halite dissolution, saline-water intrusion, or the presence of brines at greater depths due to past marine transgressions, such as during the Pleistocene Epoch along the west coast of Saudi Arabia (Behairy 1983). During such periods of transgression, saline water stored in unconsolidated alluvium along the coast could be the reason for high TDS and Cl concentrations compared to salt-water intrusion alone. In some areas, the high salinity is also a result of the interaction of groundwater with sabkha deposits, which are common along the west coast of Saudi Arabia (Zaidi et al. 2017). However, only minor sabkha deposits have been reported from the Wadi Fatima catchment.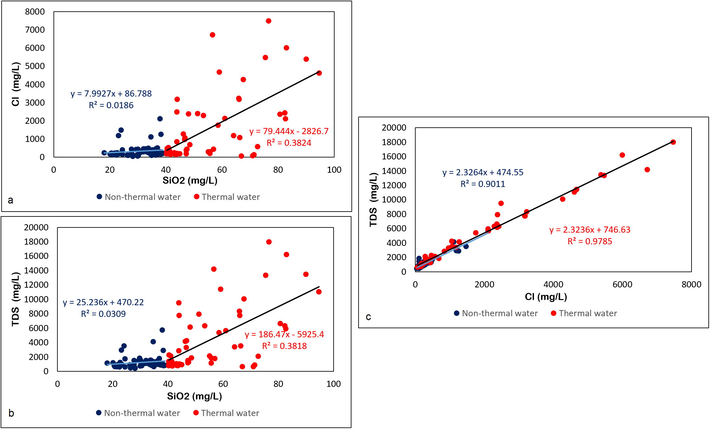
Relationships among SiO2, Cl, and total dissolved solids (TDS). (a) SiO2 versus Cl; (b) SiO2 versus TDS; (c) Cl versus TDS.
4.2 Hydrochemical facies analysis
4.2.1 Piper plot
Based on chalcedony temperatures obtained from silica concentrations, 57 water samples were classified as geothermal (mean TDS, 4389 mg/L) and 67 as non-geothermal (mean TDS value, 1254 mg/L), and then a Piper plot was prepared for each of the two categories (Fig. 5).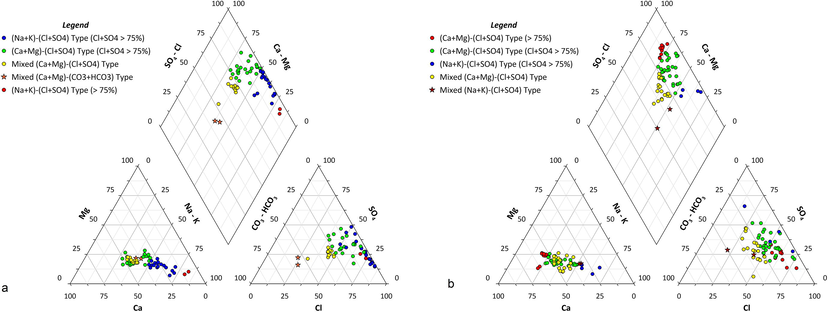
Hydrochemical-facies classification using Piper plot. (a) Geothermal-groundwater samples; (b) Non-geothermal-groundwater samples.
Using ionic-abundance data, the geothermal waters were divided into 5 hydrochemical facies. The Piper plot (Fig. 5a) shows that Cl + SO4 dominates the hydrochemistry. With Na + K concentrations within 50%–75% and Cl + SO4 concentrations > 75%, 18 samples belong to the (Na + K)–(Cl + SO4) facies. These samples are characterized by very high TDS values (mean, 9055 mg/L), and their mean chalcedony temperature is 82.6 °C. With Ca + Mg concentrations within 50%–75% and Cl + SO4 concentration >75%, 23 samples belong to the (Ca + Mg)–(Cl + SO4) facies. For samples belonging to this facies, the mean TDS is 2888 mg/L, and the mean temperature is 73.6 °C. The mixed (Ca + Mg)–(Cl + SO4) facies contains 12 samples with mean TDS value of 874 mg/L and mean temperature of 66.46 °C. The Ca + Mg and Cl + SO4 concentrations are within 50%–75% in these facies. Circulation for these sampled waters may have been at great enough depth to have caused temperatures >60 °C; however, their limited residence time in the aquifer has not increased mineral dissolution, as reflected in their comparatively low TDS values.
Two geothermal-water samples belong to the (Na–K)–(Cl + SO4) facies, where both ionic pairs are >75%. Their mean TDS value is 4501 mg/L, and their temperature is 83.5 °C. This groundwater facies was absent in the non-geothermal water. Two samples belong to the mixed (Ca + Mg)–(HCO3 + CO3) facies, where both ionic pairs have concentrations within 50%–75%. These samples are closest to meteoric-water composition and have a mean TDS of 614 mg/L and chalcedony temperature of 88.8 °C. The reasons for high silica concentration in these samples are not very clear.
The non-geothermal groundwater can also be divided into five different hydrochemical facies (Fig. 5b). The (Ca + Mg)–(Cl + SO4) facies is represented by 10 groundwater samples that have a mean TDS value of 1451 mg/L and for which both ionic pairs have a concentration of >75%. In general, this groundwater facies represents reverse ion exchange, whereby excess Ca and Cl left after bonding with SO4 and Na, respectively, bond with each other to form the rare CaCl2 salt (Zaidi et al. 2015). This groundwater facies was absent in the geothermal water.
The second facies is the (Ca + Mg)–(Cl + SO4) with Ca + Mg concentration within 50%–75% and Cl + SO4 concentration >75%. The mean TDS value of the samples in these facies is 1265 mg/L. Maximum number of samples (30) falls within this facies.
Most of the geothermal waters are in the unconsolidated coastal deposits in the downstream reach of Wadi Fatima. These deposits, which were formed mainly by the chemical and mechanical weathering of the basement rocks of the Arabian Shield, may contain traces of radioactive elements. Instances of radioactive elements, such as 226Ra, 232Th, and 4K, in the groundwater from Makkah province have been reported by Alseroury et al. (2018). The decay of these radioactive elements may lead to high heat generation and, in turn, a higher temperature for the circulating water. Because higher temperatures also are related to depth of circulation, depths (or thicknesses) of alluvial deposits were compared. In the part of Wadi Fatima that is in the Arabian Shield, alluvial deposits are shallower than in the coastal plains in the lower reaches of the Wadi. Thicker deposits allow groundwater to circulate to greater depths, which explains the dominance of geothermal waters in the lower reaches of Wadi Fatima.
4.2.2 Extended Durov plot
An extended Durov diagram (Fig. 6) is commonly used in groundwater studies for identifying the main hydrochemical process operating within an aquifer according to the position of samples within nine fields in the central plotting square (Llyod and Heathcote 1985; Musaed et al. 2020).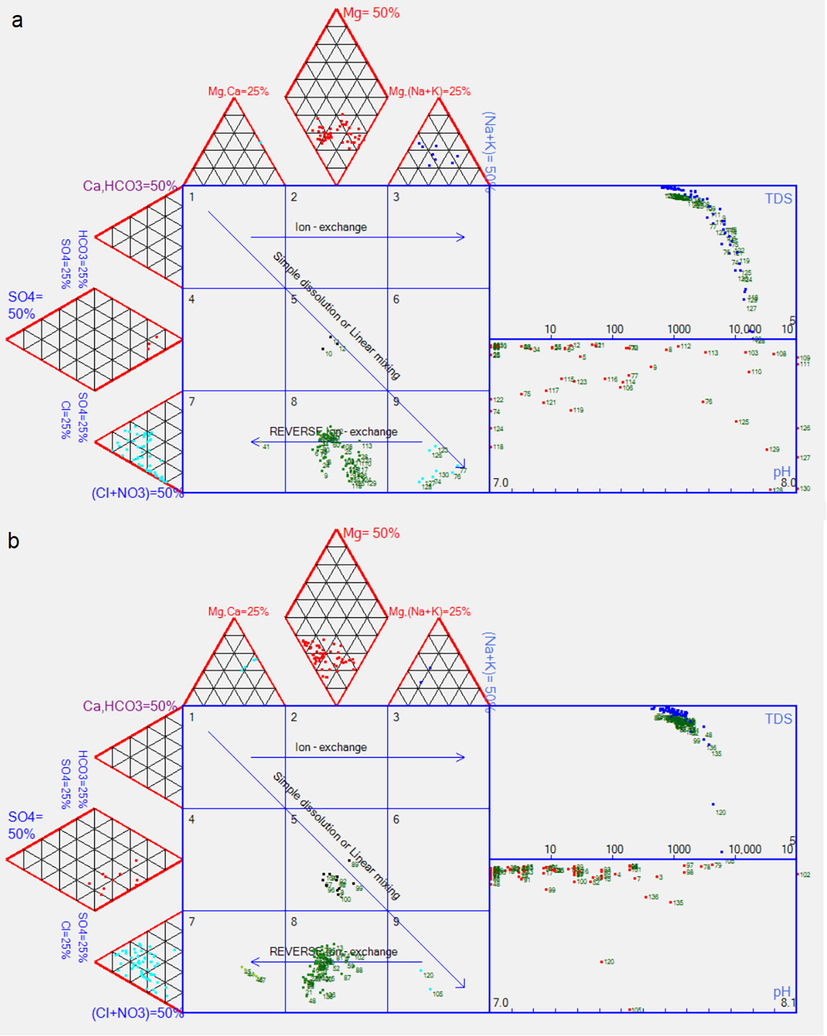
Extended Durov plot showing main geochemical processes controlling groundwater chemistry. (a) Geothermal-groundwater samples; (b) Non-geothermal-groundwater samples.
Geothermal- and non-geothermal-groundwater facies fall within Durov Fields 5, 7, 8, and 9. Different groundwater facies plot in Durov Field 5, which includes a more significant number of non-geothermal than geothermal samples (Fig. 6a and 6b). Durov Field 9, which represents the Na–Cl facies, includes a greater number of geothermal than non-geothermal water samples (Fig. 6a). This facies indicates saline-water intrusion, halite dissolution, or the presence of ancient saline water within the aquifer. The geology and the distance of the sampling wells from the sea favor the presence of ancient saline water obtained from previous episodes of marine transgression in the region. Durov Field 8, common to both types of groundwater samples, indicates the mixing of freshwater in the aquifer with deep ancient saline water and some degree of reverse ion exchange. Durov Field 7, represented by the Ca–Cl facies, indicates saline-water intrusion or reverse ion exchange and includes more non-geothermal- than geothermal-water samples. Mixing of ancient saline water with recent freshwater (Durov Field 9) is apparent in the geothermal-groundwater samples (Fig. 6a), whereas groundwater mixing between different facies (Durov Field 5) can be seen in the non-geothermal waters (Fig. 6b).
4.3 Silicate weathering
Carbonates, silicates, and evaporites are the main mineral groups that undergo chemical weathering (Garrels et al. 1973). Na-normalized ratios of Ca, Mg, and HCO3 commonly have been used to obtain evidence of the weathering of these minerals in groundwater (Mukherjee and Fryar 2008; Khan et al. 2020). Relatively low ratios of Na-normalized endmembers indicate silicate weathering (Gaillardet et al. 1999), whereas extremely low Na-normalized ratios are indicative of evaporite weathering. The continental crust has a mean molar ratio of 0.6 (Taylor and McLennan 1985). The mean Ca/Na molar ratio determined in this study was 0.625, which indicates the predominance of silicate weathering. In a plot of Na-normalized Ca versus Mg, all the water samples fall within the zone of silicate weathering (Fig. 7a). In a plot of Na-normalized Ca versus HCO3, some samples also fall within the evaporite-weathering region (Fig. 7b). Evaporite weathering is more pronounced in the geothermal samples that show a higher percentage of Na (very low HCO3/Na ratios). High TDS values also characterizes these samples.![Mixing diagram using Na-normalized molar ratio for groundwater samples; all samples fall within range of silicates to evaporite endmembers. (a) Na-normalized Ca and Mg; (b) Na-normalized Ca and HCO3. [Composition of three main-source endmembers are shown using dashed boxes (evaporites, silicates, and carbonates)]](/content/185/2022/34/1/img/10.1016_j.jksus.2021.101717-fig7.png)
Mixing diagram using Na-normalized molar ratio for groundwater samples; all samples fall within range of silicates to evaporite endmembers. (a) Na-normalized Ca and Mg; (b) Na-normalized Ca and HCO3. [Composition of three main-source endmembers are shown using dashed boxes (evaporites, silicates, and carbonates)]
Silicate weathering reflects the geology of the Wadi Fatima basin (Fig. 2). The western part of the basin contains Precambrian igneous and metamorphic rocks of the Arabian Shield; these rocks are composed mainly of silicate minerals. Deposits along the coast in the western part of the basin were derived from the physical weathering of basement rock, subsequent transportation of the resulting sediments, and the silicates’ chemical weathering by interaction with groundwater.
4.4 Saturation indices
The most-common modeling approach used in hydrogeochemical studies is thermodynamic calculation of saturation indices of mineral phases. PHREEQC software (Parkhurst and Appelo 1999) uses geochemical parameters to compute indices of minerals that are capable of saturating a solution. Saturation-indices calculation using this code have been commonly used for hydrogeochemical modeling. Based on the ions dissolved in groundwater, the program calculates saturation indices for all possible mineral phases present.
Saturation indices were calculated for the principal mineral phases present in the groundwater samples, which yielded relative abundances that can be represented by silicates > carbonates > evaporites. All the groundwater samples are highly unsaturated with halite (−7.14–3.28) (Fig. 8a) and unsaturated or at or near equilibrium with gypsum (−2.33–0.66) and anhydrite (−2.63–0.24) (Fig. 8b). The samples vary from saturated to undersaturated for the carbonate minerals: calcite (−0.42–1.35), aragonite (−0.57–1.21) (Fig. 8c), and dolomite (−1.0–2.7) (Fig. 8d). However, because carbonate weathering is minimal in the study area owing to the nearly complete absence of carbonate minerals, the obtained results of carbonate saturation do not satisfy the actual in-situ conditions.
Saturation indices for mineral species commonly dissolved in groundwater. (a) Halite; (b) Anhydrite and gypsum; (c) Aragonite and calcite; (d) Dolomite.
The silica dissolved in groundwater may form crystalline SiO2 (quartz) or a cryptocrystalline form (chalcedony) when saturated. The groundwater is saturated with silica but chalcedony is less saturated than quartz, as the groundwater is undersaturated with respect to amorphous silica (Fig. 9). The relative saturation indices of silica in the groundwater samples may be represented as quartz > chalcedony > amorphous silica. Overall, the silica saturation is higher in the geothermal water than in the non-geothermal water. Groundwater interactions with the silicate-bearing sediments in western part of the wadi basin and the rock–water interaction with silicate minerals in the eastern part of the basin are the reasons for silica dissolution and its consequent saturation in the groundwater.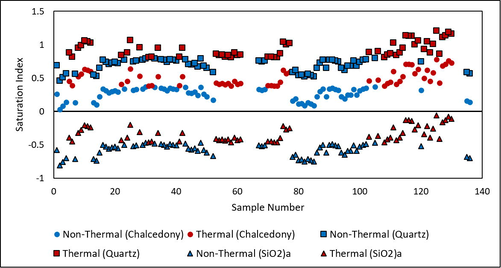
Saturation indices of three silica polymorphs (amorphous silica, chalcedony, and quartz) in groundwater.
The saturation index of amorphous silica is the lowest of the three forms of SiO2 and ranges within −0.06–0.81. The saturation index of crystalline SiO2 (quartz) is the highest and ranges within 0.46–1.21; all the groundwater samples are saturated with quartz. Chalcedony, the cryptocrystalline form of silica, has a saturation index ranging within 0.03–0.78. Some samples are at equilibrium and saturated with respect to chalcedony. In general, the geothermal-groundwater samples are more saturated than the non-geothermal ones.
5 Conclusions
The chalcedony geothermometer has been effectively used to classify the collected groundwater samples as geothermal or non-geothermal. The samples were analyzed to determine major hydrochemical differences between the two water types. Of the 124 groundwater samples, 57 that had chalcedony temperatures >60 °C were classified as geothermal water, and the remaining 67 samples, which had chalcedony temperatures of <60 °C, as non-geothermal. The geothermal-groundwater samples show higher mean TDS values, indicating a greater degree of mineral dissolution due to the high temperature of the circulating waters. Piper plot shows that all 124 groundwater samples belong mainly to the (Ca + Mg)–(Cl + SO4) and (Na + K)–(Cl + SO4) facies, but more of the geothermal-water samples belong to the (Na + K)–(Cl + SO4) facies. The Durov plot reveals a more significant number of non-geothermal than geothermal samples fall within Durov Field 5, which is generally a consequence of mixing of different groundwater facies. The geothermal-groundwater samples populate Durov Field 9, which is represented by Na–Cl facies. From this study, the origin of the Na–Cl facies appears to be attributable to mixing of shallow freshwater with originally deeper saline water in the aquifer. In general, silicate weathering is dominant among rock–water interaction processes for both groundwater types and correlates with the geology of the basement rock and sediments where silicate minerals are prevalent. However, the Na-normalized HCO3 plot shows the presence of evaporites, which can be due to the dominance of Na derived from mixing of freshwater with saline water. With respect to the dissolved-silica saturation index, the groundwater varies from undersaturated to saturated, and the index increases from amorphous silica to chalcedony to quartz. Overall, the geothermal-water samples show a greater degree of silica saturation. The high temperature of the circulating waters has led to silica dissolution and ultimately its precipitation when the water is saturated with silica. Other than silica/chalcedony geothermometers, a host of other cation geothermometers are available however for a reliable interpretation of the temperature values obtained from these thermometers, it is necessary to understand the exact hydrochemical processes influencing the groundwater chemistry. To understand the origin of the circulating waters and hence understand the exact hydrochemical processes it is necessary to carry out stable isotope assessment of the groundwater samples from the study area.
Funding
The authors extend their appreciation to Researchers Supporting Project number (RSP-2021/327), King Saud University, Riyadh, Saudi Arabia.
Declaration of Competing Interest
The authors declare that they have no known competing financial interests or personal relationships that could have appeared to influence the work reported in this paper.
References
- Assessment of nitrate concentration in groundwater in Saudi Arabia. Environ. Monit. Assess.. 2010;161(1-4):1-9.
- [CrossRef] [Google Scholar]
- DurovPwin: a new version to plot the expanded Durov diagram for hydro-chemical data analysis. Comput. Geosci.. 2012;42:1-6.
- [CrossRef] [Google Scholar]
- Geophysical investigations for groundwater in a complex subsurface terrain, Wadi Fatima, KSA: A case history. Jordan J. Civ. Eng.. 2009;3(2):118-136.
- [Google Scholar]
- Magnetic survey for delineating subsurface structures and estimating magnetic sources depth, Wadi Fatima, KSA. J. King Saud. Univ. Sci.. 2010;22(2):87-96.
- [CrossRef] [Google Scholar]
- Recent climate change in the Arabian Peninsula: seasonal rainfall and temperature climatology of Saudi Arabia for 1979–2009. Atmos. Res.. 2012;111:29-45.
- [CrossRef] [Google Scholar]
- Evaluation of groundwater and grey water contamination with heavy metals and their adsorptive remediation using renewable carbon from a mixed-waste source. Water. 2020;12(6):1802.
- [CrossRef] [Google Scholar]
- Estimation of natural radioactive and heavy metals concentration in underground water. J. Radiat. Res. Appl. Sci.. 2018;11(4):373-378.
- [CrossRef] [Google Scholar]
- Description of arid geomorphic features using Landsat-TM data and ground truth information (Wadi Fatima, Kingdom of Saudi Arabia) Catena. 1986;13(3):277-I.
- [CrossRef] [Google Scholar]
- Hydrochemical study of groundwater in recharge area, Wadi Fatimah basin, Saudi Arabia. GeoJournal. 1995;37(1):81-89.
- [CrossRef] [Google Scholar]
- APHA (2012) Standard Methods for the Examination of Water and Wastewater (20th ed.) Jointly published by American Public Health Association (APHA), American Water Works Association (AWWA) and Water Environment Federation (WEF), Washington, USA (2012).
- Isotopic and chemical techniques in geothermal exploration, development and use. Internat. Atomic Energy Agency 2000:109-111.
- [Google Scholar]
- Effect of flash flood on trace metal pollution in the groundwater-Wadi Baysh Basin, western Saudi Arabia. J. Afr. Earth Sc.. 2018;147:338-351.
- [CrossRef] [Google Scholar]
- Marine transgressions in the west coast of Saudi Arabia (Red Sea) between mid-Pleistocene and present. Mar. Geol.. 1983;52(1-2):M25-M31.
- [Google Scholar]
- Brown GF, Jackson RO, Bogue RG, Maclean WH (1963) Geologic map of the southern Hijaz quadrangle, Kingdom of Saudi Arabia. US Geological Survey. https://doi.org/10.3133/i210A
- Climate change and water scarcity: The case of Saudi Arabia. Ann Glob. Health. 2015;81(3):342-353.
- [CrossRef] [Google Scholar]
- Chemical geothermometers and mixing models for geothermal systems. Geothermics. 1977;5(1-4):41-50.
- [Google Scholar]
- Estimation of underground temperatures from the silica content of water from hot springs and wet-steam wells. Am. J. Sci.. 1966;264(9):685-697.
- [Google Scholar]
- Global silicate weathering and CO2 consumption rates deduced from the chemistry of large rivers. Chem. Geol.. 1999;159(1–4):3-30.
- [CrossRef] [Google Scholar]
- Garrels RM, Mackenzie FT, Hunt C (1973) Chemical cycles and the global environment: assessing human influences.
- A geological excursion in the Wadi Fatima area, near Jiddah, Saudi Arabia. Geol. Today. 1992;8(6):215-219.
- [CrossRef] [Google Scholar]
- Significance of silica in identifying the processes affecting groundwater chemistry in parts of Kali watershed, Central Ganga Plain, India. Appl. Water Sci.. 2015;5(1):65-72.
- [Google Scholar]
- Impact of hydrogeochemical processes and its evolution in controlling groundwater chemistry along the east coast of Tamil Nadu and Puducherry. India: Environmental Science and Pollution Research; 2020. p. :1-22.
- Khan, MMA, Umar R (2010) Significance of silica analysis in groundwater in parts of Central Ganga Plain, Uttar Pradesh, India. Current science, pp.1237-1240.
- Sources of elevated chloride in local streams: groundwater and soils as potential reservoirs. Water Air Soil Pollut.. 2009;203(1–4):335-342.
- [CrossRef] [Google Scholar]
- A quantitative assessment of groundwater resources in the Middle East and North Africa region. Hydrogeol. J.. 2018;26(1):251-266.
- [CrossRef] [Google Scholar]
- Natural Inorganic Hydrochemistry In Relation To Groundwater: An Introduction. Oxford: Clarendon Press; 1985. p. :296.
- Geostatistical analysis using GIS for mapping groundwater quality: case study in the recharge area of Wadi Usfan, western Saudi Arabia. Arab. J. Geosci.. 2014;7(12):5239-5252.
- [CrossRef] [Google Scholar]
- Impact of anthropogenic inputs on water quality in Chincholi industrial area of Solapur, Maharashtra, India. Groundwater Sustain. Dev.. 2018;7:359-371.
- [CrossRef] [Google Scholar]
- Deeper groundwater chemistry and geochemical modeling of the arsenic affected western Bengal basin, West Bengal, India. Appl. Geochem.. 2008;23(4):863-894.
- [CrossRef] [Google Scholar]
- Hydrochemical assessment of groundwater in mesozoic sedimentary aquifers in an arid region: a case study from Wadi Nisah in Central Saudi Arabia. Environ. Earth Sci.. 2020;79(6):1-2.
- [CrossRef] [Google Scholar]
- Niyazi B, Elfeki A, Masoud M, Zaidi S (2014) Spatio-temporal rainfall analysis at Wadi Fatima for flood risk assessment. In6th international conference on water resources and the arid environments (ICWRAE 6) (pp. 308-314).
- User’s guide to PHREEQC (Version 2): A computer program for speciation, batch-reaction, one-dimensional transport, and inverse geochemical calculations. Water-resour. Investig. Rep.. 1999;99(4259):312.
- [Google Scholar]
- Evaluation of a brackish groundwater resource in the Wadi Al-Lusub basin, Western Saudi Arabia. Environ. Earth Sci.. 2019;78(15):451.
- [CrossRef] [Google Scholar]
- Contribution to the comparative study of treated and untreated wastewater: a case study (Wadi Fatima and Al Misk Lake) in Saudi Arabia. Arab. J. Geosci.. 2020;13(17) 1-1
- [CrossRef] [Google Scholar]
- Aridity and risk calculations in saudi arabian wadis: Wadi Fatimah case. Earth Syst. Environ.. 2017;1(2):26.
- [CrossRef] [Google Scholar]
- Sharaf MA, Alyamani MS, Subyani AM (2004) Regional study of the rare and trace elements in the groundwater of the major wadi basins (An Numan, Usfan, and Fatimah) in western Saudi Arabia and their suitability for various purposes. Final report, Project. (204/423).
- Major elements hydrochemistry and groundwater quality of Wadi Fatimah, West Central Arabian Shield, Saudi Arabia. Arab. J. Geosci.. 2013;6(7):2633-2653.
- [CrossRef] [Google Scholar]
- The Continental Crust: Its Composition And Evolution. London: Blackwell; 1985.
- Hydrochemical characteristics and evolution of geothermal fluids in the Chabu high-temperature geothermal system, Southern Tibet. Geofluids. 2018;2018:1-15.
- [CrossRef] [Google Scholar]
- Water conservation in the Kingdom of Saudi Arabia for better environment: implications for extension and education. Bulg. J. Agric. Sci.. 2011;17(3):389-395.
- [Google Scholar]
- Factors influencing the major ion chemistry in the Tihama coastal plain of southern Saudi Arabia: evidences from hydrochemical facies analyses and ionic relationships. Environ. Earth Sci.. 2017;76(14):472.
- [CrossRef] [Google Scholar]
- Hydrochemical processes governing groundwater quality of sedimentary aquifers in Central Saudi Arabia and its environmental implications. Environ. Earth Sci.. 2015;74(2):1555-1568.
- [CrossRef] [Google Scholar]
- Assessment of hydrological processes operating in a multi-layered sedimentary aquifer system in Saudi Arabia using integrated chemical and statistical approach. Environ. Monit. Assess.. 2019;191(7):460.
- [CrossRef] [Google Scholar]
Appendix A
Supplementary data
Supplementary data to this article can be found online at https://doi.org/10.1016/j.jksus.2021.101717.
Appendix A
Supplementary data
The following are the Supplementary data to this article:


