

Translate this page into:
HLA-G gene polymorphisms as predictors of survival in colorectal cancer: A unified machine learning approach
⁎Corresponding author at: Université de Tunis El Manar, Faculté des Science de Tunis, LR03ES03 Laboratoire des Microorganismes et Biomolécules Actives, 2092 Tunis, Tunisia. ines.zidi@istmt.utm.tn (Ines Zidi)
-
Received: ,
Accepted: ,
This article was originally published by Elsevier and was migrated to Scientific Scholar after the change of Publisher.
Abstract
Objectives
Human Leukocyte Antigen (HLA-G) is a potent molecule involved in immune-tolerance. Here, we investigated the contribution of HLA-G gene polymorphisms (14 bp Ins/Del and +3142C/G) for accurate prediction of colorectal cancer (CRC) overall survival (OS) status. Our study presents a comprehensive investigation of the prognostic value of HLA-G genotypes and haplotypes in predicting OS status in 266 Tunisian patients with CRC.
Methods
We used a machine learning (ML)-based framework described below: (1) A dimensionality reduction approach was used to examine evidence of an association between HLA-G genotypes and OS status. (2) Decision-tree ML models were used to explore the performance of the HLA-G genotype as a relevant contributing feature to accurately predict OS status.
Results
HLA-G polymorphisms were highly predictive of OS status when a random forest classifier was used. The HLA-G 14 bp Ins/Del polymorphism outperformed the HLA-G + 3142C/G polymorphism as a predictor of OS. The Del/Del genotype was associated with worse OS and the G/G genotype was associated with favorable OS. The InsC haplotype predicted a favorable prognosis, and the DelG haplotype predicted a worse OS. The combined prediction demonstrated, with 100 % precision and high accuracy, that Del/Del genotype associated with key clinical features, can efficiently predict worse OS. The results were evaluated through an external validation process to ensure their reliability.
Conclusions
We demonstrated the potential of HLA-G gene polymorphisms as robust candidate biomarkers to predict OS in CRC patients. The research on the HLA-G gene presents a promising avenue for developing an innovative decision-making tool to identify candidates for personalized therapeutic interventions.
Keywords
HLA-G gene polymorphism
Colorectal cancer
Overall survival status
Machine learning
Decision tree
Random forest

- Adaboost
-
Adaptive Boosting Classifier
- AU-ROC
-
Area Under the Receiver Operating Characteristic Curve
- BC
-
Bagging Classifier
- CRC
-
colorectal cancer
- DT
-
decision tree
- FCA
-
Factorial Component Analysis
- FN
-
False Negative
- FP
-
False Positive
- GBT
-
gradient boosting tree
- GridsearchCV
-
GridSearch Cross Validation
- HLA
-
Human Leukocyte Antigen
- Log ROC
-
Logarithmic Receiver Operating Characteristic
- LR
-
Logistic Regression
- MCFA
-
Multiple Correspondence Factorial Analysis
- ML
-
Machine Learning
- MSE
-
Mean Squared Error
- OS
-
Overall Survival
- PCR
-
Polymerase Chain Reaction
- PCR-RFLP
-
Polymerase Chain Reaction – Restriction Fragment Length Polymorphism
- RF
-
Random Forest
- RMSE
-
Root mean Squared Error
- SGBT
-
Stochastic Gradient Boosting Tree
- SVM
-
Support Vector Machine
- TN
-
True Negative
- TP
-
True Positive
- UTR
-
Untranslated region
Abbreviations
1 Introduction
Human Leukocyte Antigen (HLA)-G, a member of the non-classical HLA class Ib subfamily (Donadi et al., 2011), has a crucial role for establishing immune tolerance. Originally recognized for its immune-tolerance function during pregnancy (Donadi et al., 2011). HLA-G is also involved in many pathologies including cancers, and auto-immunity (Carosella et al., 2008). It is additionally linked to immune cell’s downregulation (Carosella et al., 2008).
The HLA-G gene, located on chromosome 6p21.3 (Donadi et al., 2011), includes the 3′untranslated region (3′UTR) with many polymorphisms such as the HLA-G 14-bp Insertion/Deletion (Ins/Del) (rs371194629) and HLA-G + 3142C/G (rs1063320) polymorphisms. These polymorphic sites significantly influence HLA-G transcription and translation (Donadi et al., 2011, Rousseau et al., 2003, Veit and Chies, 2009). The14-pb deletion stabilizes HLA-G mRNA enhancing both membrane-bound and soluble HLA-G expression while the insertion reduces protein production (Rousseau et al., 2003). For the HLA-G + 3142C/G polymorphism, the G allele enhances the affinity of mRNA transcripts for microRNAs leading to its degradation and lower HLA-G expression (Veit and Chies, 2009).
This aberrant expression of HLA-G has been observed in various digestive cancers and has been associated with advanced stages and poor prognosis (Cao et al., 2011), highlighting its potential as a valuable biomarker for disease prognosis and therapeutic intervention. Further research about the role of HLA-G and its genetic variants in various pathological settings may pave the way for targeted therapy and personalized medicine approaches.
The aim of this study was to use a machine learning (ML) approach to investigate the role of HLA-G gene polymorphisms in the accurate prediction of CRC overall survival (OS) status.
2 Material and methods
2.1 Study population
A total of 266 CRC patients diagnosed between October 2016 and September 2019 at the Salah Azaiez Institute of Tunis (Tunisia) were recruited. The patients’ demographic and tumor-related characteristics are presented in Table 1. OS status was assessed over three years following conventional treatment. Ethical approval was obtained from the Institute’s Ethics Committee (ISA/03/2016). All participants provided written consent. All methods followed relevant guidelines and regulations. CRC: Colorectal cancer. Bold ACM coefficients: significant factor to the construction of factorial axis.
Features
Modality
Total
Survival Status
MFCA contribution Coefficients
Dead
Alive
F1
F2
Age of disease screening
(in years)<50 (early-onset CRC)
68
20
48
≥50 (later-onset CRC)
198
61
137
Gender
Women
130
41
89
0,658
−0,774
Men
136
40
96
−0,658
0,774
Tumor location
Rectum
121
43
78
−2,897
−2,545
Colon
145
38
107
2,897
2,545
Grade
Well
140
41
99
−5,489
0,655
Moderate
85
23
62
−2,924
3,618
Poor
10
8
2
0,403
−10,879
Histological subtypes
Adenocarcinoma
237
68
169
−13,223
5,131
Mucinous carcinoma
17
6
11
2,087
−10,865
Other
9
7
2
14,256
1,516
Stages
I + II
67
5
62
0,031
−5,327
III + IV
190
73
117
−0,031
5,327
HLA-G 14 bp Ins/Del
Ins/Del
104
30
74
2,404
4,031
Del/Del
94
29
65
−0,948
0,212
Ins/Ins
68
22
46
−1,584
−4,257
HLA-G + 3142C/G
C/G
130
43
87
0,884
0,590
G/G
58
11
47
0,634
4,704
C/C
45
15
30
−1,780
−5,746
Survival Statues
Dead
−-
−-
−-
1,243
−7,786
Alive
−-
−-
−-
−1,243
7,786
2.2 Polymorphism genotyping
Genomic DNA extraction and amplification of HLA-G gene polymorphisms were performed as described in Dhouioui et al., 2022. Briefly, PCR was used for the HLA-G 14-bp Ins/Del (rs371194629) polymorphism, and PCR-RFLP for the HLA-G + 3142C/G polymorphism (rs1063320). Based on Dhouioui’s cases-controls study (Dhouioui et al., 2022) on CRC susceptibility, and work by Gagno (2020) and Gusella (2017) (Gagno et al., 2020, Gusella et al., 2017), a risk score was assigned to each genotype: for the HLA-G 14 bp Ins/Del: Ins/Ins = 0, Ins/Del = 1, Del/Del = 2, with Del/Del as the risk genotype (OR = 1.80, 95 % CI = 1.205–2.664, p = 0.003; (Dhouioui et al., 2022)). For HLA-G + 3142C/G: G/G and C/C = 0, C/G = 1; with C/G as the risk genotype (OR = 1.59,95 %CI = 1.106–2.272,p = 0.013; (Dhouioui et al., 2022)).
2.3 Machine learning models
Decision Tree (DT)-based algorithms were used to predict OS. Decision trees were selected for their effectiveness with missing data and mixed data types commonly found in medical datasets, simplifying preparation. This study focused on HLA-G polymorphisms and integrated clinical data for OS prediction.
The proposed methodology, described in Fig. 1, is a two-step approach combining multiple correspondence factorial analysis (MCFA) and a DT variant. MCFA highlighted correlations between HLA-G polymorphisms and the other features (Table 1), helping improve model performance by identifying influential features, stabilizing tree structure, and reducing training time.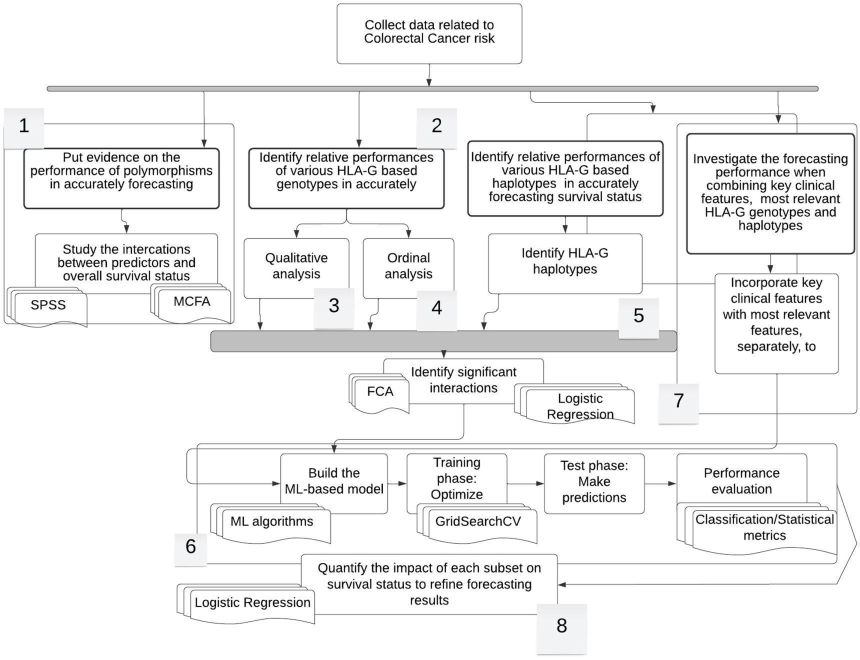
Workflow of the proposed research study. This figure depicts the workflow that was followed throughout the project implementation. The research was conducted through for phases. During the first phase, the most relevant features for predicting survival status along with adequate ML model were identified. In the second phase, a more refined analysis dealing with the impact of genotypes in informing about overall survival status was carried out according to qualitative and ordinal-based methodologies. Afterwards, we explored the importance of haplotypes that result from different combinations of genotypes to ensure the same predictive task. Finally, the study was extended by incorporating several best features that we obtained from the three previous phasis and investigating the performance of the newly obtained set of data in empowering the ability of the RF model in accurately predicting the overall survival status. We also used the Logistic regression model to further refine outputs and develop conclusive results.
We evaluated six tree-based models, selecting the top performer among DT, Random Forest (RF), Bagging Classifier (BC), Gradient Boosting Tree (GBT), Stochastic Gradient Boosting Tree (SGBT) and Adaptive Boosting classifier (Adaboost). Except for DT, these are ensemble models combining weak learners into a strong predictor, with DT-based models supporting repeated feature evaluation and scenario exploration for better decision-making (Abdullah et al., 2017).
We also investigated Support Vector Machine (SVM), a supervised algorithm that is suitable for small datasets, effective for medical applications (Venkatesan et al., 2018), and improves specialized recommender systems (Matthew et al., 2022).
2.4 Hyperparameters optimization and model training
When working with ML models, effective parameter optimization technique is important because the default parameters are not always optimal. The idea is to find the best hyperparameters for the data to achieve the optimal performance. A large number of optimization techniques are available in the biomedical literature, including the GridsearchCV (Liashchynskyi and Liashchynskyi, 2019, Kaushik et al., 2020), the evolutionary algorithm (Koohestani et al., 2019, Abdar et al., 2019), the Practical Swarm Optimization (Zomorodi et al., 2021), the Random Search (Liashchynskyi and Liashchynskyi, 2019), and the Bayesian Optimizer (Hosni et al., 2019). In this study, we used the GridSearch Cross Validation (hereafter GridsearchCV) algorithm to optimize key modeling parameters. GridsearchCV systematically explores predefined hyperparameter grids and uses cross-validation to determine the best combination for the training task.
2.5 Forecasting overall survival status
To explore these results, we focus on the relevance of the use of HLA-G polymorphisms in predicting OS status, and clearly distinguishing between ‘Alive’ (Survival) and ‘Dead’ (Mortality) OS status modalities. This is the goal of the second stage of the proposed framework (Fig. 1, block 7).We performed a comparative study in three scenarios: the first including all predictive features (Table 2-scenario 1), the second is linked to HLA-G polymorphisms and the most relevant features upon MCFA findings (Table2-scenario 2), and the third is restricted to HLA-G polymorphisms (Table2-scenario 3).To ensure the robustness of the results, we emphasize the use of pre-specified ML methods. Adaboost: Adaptive Boosting classifier, GB: Gradient Boosting, SGB: Stochastic Gradient Boosting, DT: Decision Tree classifier, RF: Random Forest, Bagging: Bagging classifier, SVM: Support Vector Machine.
Scenario
Classification Model
Accuracy (%)
Precision (%)
Recall (%)
F1 Score (%)
Log_ROC_AUC
Lowest MSE
All predictive features
Adaboost
56
61
56
58
0,346
0,570
GB
56
68
56
61
0,474
0,660
SGB
88
89
88
85
0,666
0,350
DT
75
75
75
75
0,589
0,500
RF
88
89
88
85
0,666
0,350
Bagging
88
89
88
85
0,525
0,540
SVM
81
66
81
73
0,500
0,430
HLA-G polymorphisms + key clinical features
Adaboost
75
75
75
75
0,589
0,450
GB
75
65
75
70
0,461
0,500
SGB
81
66
81
73
0,500
0,430
DT
81
66
81
73
0,500
0,430
RF
88
89
88
85
0,666
0,350
Bagging
81
66
81
73
0,500
0,430
SVM
82
66
81
73
0,500
0,430
Only HLA-G polymorphisms
Adaboost
75
75
75
75
0,563
0,485
GB
75
65
75
70
0,575
0,407
SGB
81
66
81
73
0,575
0,403
DT
81
66
81
73
0,500
0,408
RF
88
89
88
85
0,575
0,387
Bagging
81
66
81
73
0,500
0,408
SVM
82
66
81
73
0,500
0,3900
2.6 Hyperparameter tuning
We used the GridSearchCV algorithm to optimize four key parameters of the DT model: number of leaf nodes, tree depth, minimum samples per leaf, and minimum number samples needed for a split, while also evaluating the Gini and Entropy split criteria.
The number of leaf nodes prevents overfitting by limiting the terminal nodes, while the minimum samples per leaf ensures sufficient data at each leaf to simplify the tree. The tree depth impacts complexity; a deeper tree captures intricates patterns but risks overfitting. The minimum samples for a split ensures enough data at nodes thus setting the threshold for further divisions.
GridSearchCV helps in testing combinations of « max_leaf_nodes », « min_samples_leaf » and « min_samples_split » from 1 to 20, and « max_depth » from 1 to 10. This determines the optimal condition for the tree structure. The final tree model is created from the best parameter combination with the highest cross-validation score using 70 % of the training data.
2.7 Performance evaluation
2.7.1 Classification metrics
Evaluating the performance of classification prediction systems is challenging, as it requires a multifaceted approach. We consider key metrics for assessing classification models.
First, we defined the output categories. “Positive cases” are the category of interest. In this study, it refers to the patients’ OS status, specifically “Alive”, while “Dead” serves as the negative case.
Predictions are classified into four groups: True Positive (TP), True Negative (TN), False Positive (FP) and False Negative (FN). A true positive is when a positive label is correctly predicted, and a false positive is when a negative label is incorrectly predicted as positive.
To evaluate the obtained results, an accuracy metric is proposed and expressed in the following equation:
Precision measures for the accuracy of positive predictions as shown in equation (2):
The precision was used to highlight the models that minimize the misclassification of «Alive» labels.
However, relying solely on precision can hide performance issues on biased datasets. For example, a model predicting all observations as “Alive” can achieve perfect precision while ignoring the “Dead” category.
The recall assesses how well the model identifies positive cases:
Precision and recall are complementary, needing a balance between them, which can be quantified by F1-score which is the harmonic mean of precision and recall.
AU-ROC is a graphical tool that represents the trade-off between recall and precision. Each point on the curve reflects the True Positive Rate (TPR) versus the False Positive Rate (FPR).
The AU-ROC measures the model’s ability to distinguish between «Alive» and “Dead” status, providing an aggregate performance measure across thresholds.
2.7.2 Statistical-based evaluation metrics
To ensure conclusive results from the classification metric, we used the Root Mean Statistical Error (RMSE) defined as:
This statistical metric was chosen for its comparable results with frequently relevant literature. Furthermore, RMSE is important because it prevents both positive and negative forecast errors, and large and small forecast errors alike.
3 Results
3.1 HLA-G polymorphisms and clinicopathologic features are key predictive features of overall survival status in patients with CRC
The MCFA was used to investigate associations between OS status and the predictive features with a focus on HLA-G variants. The contribution coefficients of each factor used to construct the factorial axis and information on whether they are significant are provided in the F1 and F2 columns of Table 1. The bolded coefficients indicate features that validate the p-value test and assess the statistical significance of a particular feature on the basis of 5 %-error risk. OS status was found to be significant in terms of the second factorial axis along with the following predictive features: HLA-G + 3142C/G-C/C, HLA-G 14bpIns/Del-Del/Del, tumor location-rectum, histological subtypes-Other, histological subtypes adenocarcinoma, HLA-G 14 bp Ins/Del-Ins/Del, HLA-G + 3142C/G-G/G and grade status-Moderate, Stages-I + II and Stages-III + IV. These factors are the origins of the latent factors given by Axis 2. To gain deeper insights, Table 1 presents information about the linkages between each OS status and the remaining significant key features. These linkages are categorized on the basis of their relationship with the OS status modality. Specifically, features linked to OS Status-“Dead” are bolded whereas those associated with OS Status-“Alive” are written in italics. Accordingly, the HLA-G + 3142C/G-C/C variant was the most commonly associated predictive feature, followed closely by OS Status-“Dead” and HLA-G 14 bp Ins/Del-Del/Del. Conversely, concerning OS Status- “Alive”, both HLA-G 14 bp Ins/Del-Ins/Del and + 3142C/G-G/G were closely linked after the histological subtypes-adenocarcinoma feature.
3.2 HLA-G polymorphisms can efficiently predict overallsurvival status via the random forest classifier
We trained the selected ML classifiers on the dataset, while optimizing hyperparameters. The objective was to investigate the role of HLA-G in predicting OS status in CRC patients. We simulated three scenarios: testing classifiers with all available predictive features, using insights from the MCFA findings which highlight feature linkages, and focusing solely on HLA-G polymorphisms.
In the first scenario, all top-performing models were evaluated (Table 2-scenario 1, Fig. 2a). Notably, mixed findings showed that competing classifiers, particularly SGB and BC, demonstrated similar performance.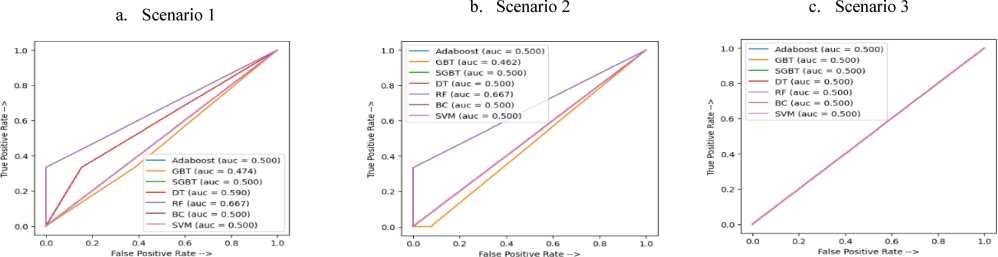
AU-ROC curves for each Machine Learning model. Scenario 1: All predictive features, Scenario 2: HLA-G polymorphisms + most relevant features, Scenario 3: Only HLA-G polymorphisms. The AU-ROC curve measures the discriminatory performance of the machine learning model to correctly predict the right class of patients whether they would grasp living or dead overall survival status, under three different scenarios. As may be noticed from Scenarios 1 and 2, the RF classifier compared more favorable than the remaining peer methods since it yields the nearest score to 1 which suggests that the proportion of true positives is higher than that of false positives. As such, it could be stated that RF enables more effective distinguishing between “Alive” and “Dead” patients compared to that yield by the remaining classifiers. When considering HLA-G polymorphisms as the only set of predictors Scenario 3), the discriminatory performance of the RF decreases to 0.5. This may be explained by the fact that reducing predictive features alters the learning performance of the classifier. The AU-ROC curve is effective in reflecting the discriminatory power of a classifier. However, it should be pointed out that this performance relies upon the interaction between “True positive rate” and “False positive rate” and ignores valuable information yield by the remaining classification metrics “True negative rate” and “False negative”. Thereby, we make use of the confusion matrix to help to capture more comprehensive information. DT: Decision Tree classifier, RF: Random Forest, BC: Bagging Classifier, GBT: Gradient Boosting Tree, SGBT: Stochastic Gradient Boosting Tree, Adaboost: Adaptive Boosting classifier, SVM: Support Vector Machine.
In the second scenario, the RF performs well in both classification and statistical measures (Table 2-scenario 2). The AU-ROC curves in Fig. 2.b highlight significant differences in classification and AU-ROC performance among the remaining classifiers, likely due to their high sensitivity to available features. This raises questions about the robustness of these models, with RF emerging as the most stable option.
Strong predictive performance was achieved using only HLA-G polymorphisms. To explore this, we conducted a third scenario including only HLA-G polymorphisms in the classification model to predict the OS status. This targeted approach allowed us to assess the significance of HLA-G polymorphisms in predicting patients’ OS status. The classification and statistical results in Table 3 are comparable to those in the second scenario. Nevertheless, there are notable differences in the AU-ROC and RMSE indicators (Fig. 2c). We found significant variability across classifiers with slightly reduced performance overall. Nevertheless, the RF classifier remains the most favorable in this context. Best indicators are bolded.
Order
Scenario
Accuracy (%)
Precision
(%)
Recall
(%)
F1 Score
(%)
Log_ROC_
AUC
Lowest MSE
1
All features
54
72
54
52
0.660
0,450
2
Only polymorphisms
42
69
42
34
0.480
0,490
External validation
85
100
50
67
0.500
0.142
3
Polymorphism HLA-G 14 bpIns/Del and key clinical features
55
73
55
62
0,680
0.450
External validation
57
33
50
44
0.550
0.428
4
Genotypes HLA-G 14 bp Ins/Del, HLA-G + 3142C/G and key clinical features
54
72
54
52
0,640
0.460
External validation
80
100
80
66
0.833
0.200
5
Only genotypes HLA-G 14 bp Ins/Deland HLA-G + 3142C/G
48
69
48
44
0.520
0.477
External validation
86
100
67
80
0.840
0.142
6
Only genotypes HLA-G 14 bp Ins/Del
66
43
66
52
0.440
0.480
External validation
85
100
66
80
0.833
0.138
7
Haplotypes
73
72
100
84
0.500
0.270
External validation
80
100
50
67
0.750
0.200
8
Del/Del genotype and key clinical features
75
100
10
18
0.571
0.250
External validation
60
50
50
50
0.583
0.400
9
G/G genotype and key clinical features
75
100
14
25
0.570
0.250
External validation
100
100
100
100
1.000
0.000
10
InsC and DelG haplotypes and key clinical features
83
100
75
86
0.833
0.167
External validation
80
75
100
86
0.800
0.200
11
Risk Factor of HLA-G 14 bpIns/Del (P1) and key clinical features
70
50
14.2
22
0.544
0.292
Finally, the RF model excels in predicting the OS status of CRC patients in terms of both classification and statistical metrics. Throughout the three scenarios involving the most relevant input features, we obtained conclusive findings. These refined scenarios contributed to enhancing the discrimination performance of the classification models. Overall, our study demonstrates the superiority of the RF model and highlights the significance of incorporating relevant input features for more accurate CRC risk assessment.
3.3 Performance of the HLA-G genotypes in accurately predicting global overall survival status
To gain deeper insights into the established performance, we conducted a two-step analysis aimed to uncovering the role of HLA-G genotypes in accurately predicting the OS status of patients (Fig. 1, block 2). This analysis involved a two-step approach:
-
Qualitative analysis: First, we assessed the predictive power of the HLA-G genotypes for accurately predicting OS status by MCFA (Fig. 1, block3). The goal was to identify the most relevant genotypes among the following options Del/Del, Ins/Del, Ins/Ins, C/C, C/G, and G/G. By evaluating the performance of each genotype, we aimed to identify which had a significant role in predicting patients’ OS outcome.
-
Ordinal-based analysis: We assessed the impact of genotype risk factors associated with each HLA-G polymorphism in a process termed “ordinal-based” which involves assigning numerical scores to risk scores and cumulative risk. By quantifying these risk scores, we aimed to gain deeper insights into their contribution to predicting OS status.
3.3.1 Qualitative analysis
3.3.1.1 *Del/Del genotype is highly linked to “Dead” survival status and G/G genotype is highly linked with “Alive” survival status
Fig. 3a depicts the result of applying multiple factorial analysis according to which all features were included along with their modalities.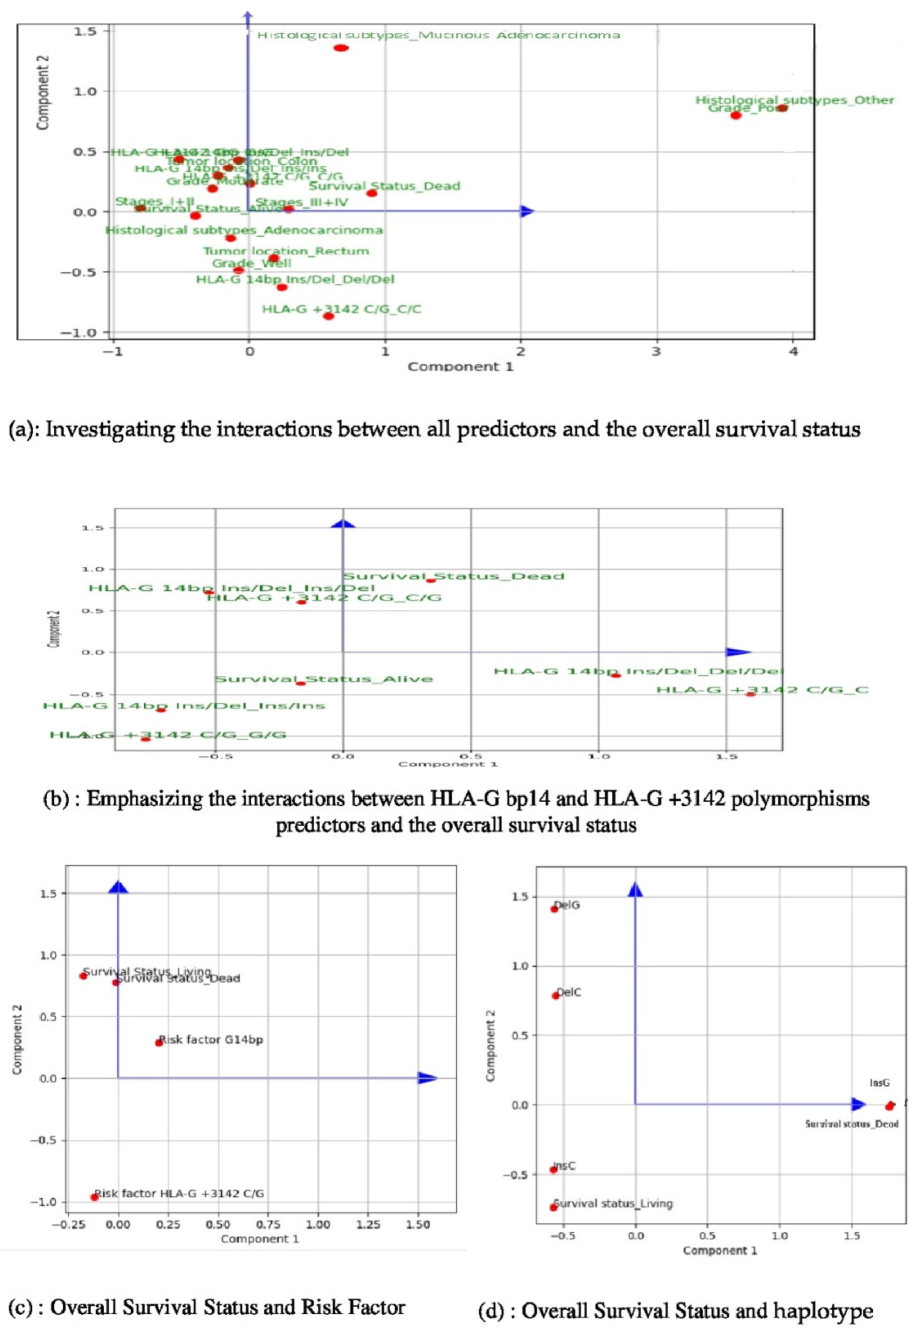
Investigating the interactions between predictors and the overall survival status using the Factorial Component Analysis (FCA). This is a machine learning method for dimensionality reduction that we explored to identify relevant features for accurately predicting survival status. In Fig. 3.a, we present the results considering all predictive features, which reveal a stronger interaction between HLA-G 14pb Ins/Del and survival status. We found that both G/G and Ins/Ins genotypes have a significant correlation with the “Alive” survival status. This observation is supported by the acute angles formed by the vectors of each genotype and the vector representing the living survival status. Conversely, our results indicate that both C/G and Ins/Del genotypes are significantly associated with the OS_Dead mortality. Remarkably, we observed that the HLA-G 14 bp Ins/Del genotype plays a more crucial role in accurately predicting survival status compared to the HLA-G + 3142C/G genotype. This finding is supported by graphical representations, illustrating that the HLA-G 14 bp Ins/Del genotypes are visually closer to the survival status modalities in Fig. 3.b. In Fig. 3.c, we investigate the interactions between Risk factors and overall survival using the FCA analysis. This figure quotes the FCA results that Investigate the interactions between risk factors of each of HLA-G bp14 Ins/Deland HLA-G + 3142C/G polymorphisms predictors and the survival status. A key finding reveals that HLA-G bp14Ins/Del is more linked to survival status. In particular, a rising value of it informs about worse survival status. Fig. 3.d deals with the interaction between haplotype and survival status using FCA analysis. The FCA shows that the Survival Status target feature is better represented by the second principal component, as it exhibits higher coordinates compared to the first principal component. This indicates that exploring this axis could lead to more reliable interpretations. Accordingly, we observed that the DelG haplotype is negatively related to the Survival status, suggesting a possible link to worse survival outcomes. On the contrary, the InsC haplotype appears to be the most distinct from the target feature and may be associated with better survival status.
In particular, the “Dead” OS status is strongly correlated with rectal tumor location, stages III + IV, Del/Del genotype, and C/C genotype, although the latter shows a weaker linkage. The angles formed by the Ins/Del genotype with “Alive” or “Dead” OS status are acute, whereas those formed by the C/G genotype are obtuse. This suggests a more substantial interaction between the Ins/Del genotype and OS status.
The HLA-G 14 bp Ins/Del and HLA-G + 3142C/G polymorphisms are expressed according to their respective genotypes. Interestingly, both principal components capture approximately 44.5 % of the total variance in the dataset, with OS status closely aligned with the first component. This indicates that the principal component 1 effectively summarizes the variations of this variable, and thus all associations with other features are meaningful. Specifically, the OS status “Dead” (Mortality) shows strong correlations with the following features: tumor location-rectum, stages III + IV, the Del/Del genotype and the C/C genotype but with a weakest linkage for this last predictive feature.
We observed that the angles formed by the Ins/Del genotype “Alive” or “Dead” OS status are mostly acute, while those formed by the C/G genotypes are more obtuse. These vectors originate from the center of the factorial plane and point towards their respective variable modalities. This finding suggests a more substantial interaction between HLA-G 14pb Ins/Del and OS status. To test this assumption, we replicate the MCFA analysis considering only genotypes as input variables. Fig. 3.a shows that OS status gains importance in the second principal component with the G/G and Ins/Ins strongly linked to the “Alive” OS status, as indicated by the acute angles formed between their vectors and that of “Alive”. Similarly, we assert the potential linkage between genotype Del/Del and OS status “Dead” as they reveal positively correlated according to the first principal component, while it shows a negative correlation with the “Alive” status.
Conversely, the results show that both genotypes C/G and Ins/Del are significantly associated with the OS status-Dead (Mortality). Interestingly, the HLA-G 14bpIns/Del genotype holds more relevance in predicting the OS status than the HLA-G + 3142C/G genotype. This result is supported by graphical representations in Fig. 3.b, which shows the HLA-G 14bpIns/Del genotypes visually closer to the OS status modalities.
3.3.1.2 *HLA-G 14 bp Ins/Del is a better predictor of survival status than HLA-G + 3142C/G using the Random Forest classifier
We then evaluated the predictive performance of each genotype for accurately predicting OS status (Fig. 1, block 6). By treating each genotype from both HLA-G polymorphisms as independent input features instead of associating them with specific modalities, we could analyze the impact of each individual genotype on outcomes separately, providing a more comprehensive understanding of their predictive power. The experiment was carried out across five different scenarios each varying the set of input features. Lines 1 to 6 from Table 3 summarize the classification performance (accuracy, precision, recall, F1-score) and statistical error performance (Log ROC, MSE) under different scenarios.
Using only genotypes as learning features led to lower performance compared to scenarios with additional predictors, as ML typically perform better with more data features. However, when including HLA-G 14 bp Ins/Del genotypes with other features, it outperformed its peers, showing more favorable results across all classification and statistical metrics. Thus, HLA-G 14 bp Ins/Del genotypes proved to be more significant for forecasting than HLA-G + 3142C/G genotypes. Comparing the effectiveness of HLA-G14 bp-Ins/Del genotypes across different scenarios (Table 4 − scenarios b and c), the statistical AU-ROC was optimal when all predictors, including the genotypes of HLA-G 14 bp Ins/Del were considered together. However, the RF classification model performed best when these genotypes were considered as modalities rather than separate features. Therefore, we recommend integrating HLA-G14 bp Ins/Del polymorphism genotypes with the remaining features to enhance prediction, classification, and AU-ROC performance.
Scenario
Features
Coefficient
in LR Equation
Odds Ratio
A: On the interaction between risk factors of genotypes and Overall Survival Status
Risk factor HLA-G14bp Ins/Del (P1)
0.125
(0.537)
1.130
(1.712)
Risk factor HLA-G + 3142C/G (P2)
−0.594
(−0.724)
0.552
(1.064)
B: On the interaction between haplotype and Survival Status
Haplotype InsC
−0.446
(−0.542)
0.640
(0.508)
Haplotype InsG
−0.220
(−0.308)
0.804
(0.734)
Haplotype DelG
−0.091
(0.234)
0.913
(1.264)
Haplotype DelC
−0.346
(0.408)
0.708
(1.504
C: Combining key clinical features with genotypes Del/Del
Tumor location
−0.501
(−0.448)
0.606
(1.565)
Grade
0.029
(0.102)
1.029
(1.107)
Histological subtypes
0.751
(0.714)
2.118
(0.839)
Stage
1.633
(1.251)
5.121
(3.495)
Genotype Del/Del
0.051
(0.379)
1.053
(1.460)
D: Combining key clinical features with genotype G/G
Tumor location
−0.6059
(−0.051)
0.546
(0.950)
Grade
0.014
(0.242)
1.014
(1.242)
Histological subtypes
0.5664
(0.187)
1.761
(1.828)
Stage
1.264
(1.508)
3.540
(2.436)
Genotype G/G
−0.605
(−0.809)
0.546
(4.519)
E: Combining key clinical features with Haplotypes InsC and DelG
Tumor location
−0.549
(0.003)
0.577
(1.002)
Grade
0.0244
(0.218)
1.020
(1.244)
Histological subtypes
0.811
(−0.159)
2.250
(0.853)
Stage
1.640
(0.778)
5.180
(2.177)
Haplotype InsC
−0.081
(−0.610)
1.174
(0.543)
Haplotype DelG
−0.549
(1.744)
0.923
(1.723)
F: Combining key clinical features with Risk factor P1
Tumor location
−0.516
(−0.100)
0.597
(0.923)
Grade
0.017
(−0.525)
1.020
(0.681)
Histological subtypes
0.784
(−0.155)
2.190
(0.876)
Stage
1.610
(1.851)
5.010
(2.299)
Risk factor P1
−0.107
(−0.011)
0.898
(0.635)
3.3.2 Ordinal-based analysis
*A high-risk score for the HLA-G 14 bp Ins/Del polymorphism may worsen patients’ survival status unlike the HLA-G + 3142C/G polymorphism. To perform the ordinal-based analysis, we implemented two main steps (Fig. 1, Blocks 4 and 6): First, we analyzed the correlations between each risk score and OS status via the correspondence factorial analysis (CFA) method (Fig. 3). This variant of MCFA effectively handles qualitative explanatory variables (risk factors) and the binary nature of the dependent variable (global OS). Then, we used logistic regression (Table 4, Scenario a). These steps provided valuable insight into the influence of each risk score on patient OS outcome. Fig. 3.c illustrates the correlation between the analyzed variables. Our findings indicate that a high-risk score for HLAG 14 bp Ins/Del may negatively impact patients' OS status, unlike HLA-G + 3142C/G. This analysis captures 69.7 % of the variance. Overall, the geometric positions of the risk factors indicate a weak correlation with the target variable. However, HLA-G 14 bp Ins/Del demonstrates a stronger influence on OS status compared with HLA-G + 3142C/G.
The logistic regression indicated a positive coefficient for the HLA-G 14bpIns/Del polymorphism whereas a negative coefficient was associated with the HLA-G + 3142C/G polymorphism (Table 4, Scenario A). This suggests that higher risk scores for the HLA-G 14bpIns/Del increase the likelihood of the target reaching 1 (indicating worse OS status). In contrast, the negative coefficient for HLA-G + 3142C/G indicates a protective effect against poor OS outcomes.
The coefficients highlight that the impact of HLA-G 14bpIns/Del polymorphism is more significant than that of the HLA-G + 3142C/G polymorphism.
For HLA-G 14bpIns/Del, with the positive coefficient suggests an 1.13 odds ratio, meaning each one-unit increase in this predictor raises the probability of worse OS by 13 %. Conversely, the negative coefficient for HLA-G + 3142C/G, with an odds ratio of 0.552 implies that a one-unit increase decreases the likelihood of worse OS status by approximately 44.8 %.
3.4 The InsC haplotype is predictive of favorable overall survival, whereas the DelG haplotypes is associated with a poorer overall survival outcome
This analysis aims to assess the effectiveness of haplotypes derived from HLA-G polymorphisms in predicting the OS status of CRC patients (Fig. 1, Blocks 5 and 6). We used the FCA to explore the correlation between various predictors and the target feature (Fig. 3.d).
We demonstrated that the OS status is best represented by the second principal component, which has higher coordinates than the first principal component does, suggesting that this axis should be explored for more reliable interpretations. The DelG haplotype is closest to the OS status, suggesting that it may be associated with a poor OS status. In contrast, the InsC haplotype appears most distant from the target feature and may indicate a better OS status. To get more rational conclusions about the observed performance, we referred to logistic regression (Table 4, Scenario B). The results show that all haplotypes have negative coefficients, suggesting an inverse relationship with OS status. As the haplotype value increases, the OS status improves.
Notably, the coefficient of the DelG haplotype (−0.09) is smaller than that of InsC (−0.446), and its effect on the log-odds is less significant. The odds ratio for DelG (0.91) is higher than that for InsC (0.64), meaning that the odds of the event decrease more slowly with DelG than with InsC. Thus, an increase in DelG or InsC haplotypes decreases the probability of reaching the target, but the decline is greater for InsC, as it has a larger coefficient.
In conclusion, both the DelG and InsC predictors reduce the likelihood of reaching the target, but the impact of InsC is greater than that of DelG. These findings are consistent with prior with previous results showing that InsC improves OS status, while DelG worsens OS status with its minimal improving effect.
3.5 A combined model integrating clinical features and HLA-G polymorphisms for survival: Del/Del and G/G genotypes associated to key clinical features made correct predictions with 100 % precision score
This section focuses on the benefits of combining each of the top emerging predictive feature with most relevant clinical peers that have been identified through the MCFA analysis within phase 1(Fig. 1). This approach aims to enhance the understanding on the polymorphism’s detection properties and support decision makers in selecting the appropriate prognostic biomarker, including genotypes, associated risk factors or haplotypes. Blocks 6, 7 and 8 in Fig. 1 outline the performed steps. We first designed four scenarios (subset 1–4: Table 4 C-F) given by concatenating the possible combinations between each subset of best polymorphisms and the set of best clinical features: “Grade”, “Stage”, “Tumor location” and “Histological Subtypes”. Subset 1 encompassed the Del/Del genotype of the HLA-G 14 bp Ins/Del polymorphism (Table 4 C). Subset 2 encompassed the G/G genotype of HLA-G + 3142C/G (Table 4D). Subset 3 integrated haplotypes InsC and DelG (Table 4 E). Subset 4 encompassed the risk score associated to HLA-G 14 bp Ins/Del (“Risk factor HLA-G14bp Ins/Del”) (Table 4 F). Afterwards, the RF analysis was conducted using each of the obtained subsets, with results quoted in Table 3 (lines 8, 9, 10 and 11for the respective subsets). The performances for subsets 1, 2 and 3 were similar with a preference to the scenario involving either the Del/Del or G/G genotype. The classification metrics indicated that RF achieved an accuracy of about 75 %, which means it correctly classified around 75 % of the data. Using haplotypes, the accuracy was slightly lower, at around 0.7 %. Interestingly, in the three best scenarios, the RF achieved a 100 % precision score, correctly predicting all positive instances without mislabeling others as “Dead.”. Thus, it could be stated that the RF classifier is perfectly capable of detecting the “Dead” OS status using these combinations of features, without falsely labeling other patients as “Dead”. However, a considerable number of true positives were missed, especially when using the haplotype subset, where only 5.26 % of actual positive instances were identified compared to 14 % for the G/G genotype subset. Overall, we showed incomplete coverage of the “Dead” OS status (Mortality) in both scenarios. Essentially, the weak recall performance reflects the challenge of identifying all patients with a worse OS status, while a high precision indicates that the RF classifier is highly confident in its prediction predicts accuracy when predicting a patient as “Dead”.
The AU-ROC metric indicates the superior discrimination performance of the RF classifier when trained on the subset including Ins/Ins and G/G genotypes compared to competing scenarios. Moreover, this specific combination of features allowed the RF model to achieve the lowest Mean Squared Error (MSE) statistics among all evaluated subsets.
Considering the competing results of the three subsets, we will proceed with a logistic regression analysis to gain additional insights and performance preferences.
Overall, in this context, the trade-off between precision and recall scores is appropriate. Indeed, as we are operating in medical diagnosis context, we are concerned with having trustworthy predictions on “Dead” instances more than merely achieving comprehensive coverage of positive cases.
The high precision score prevents critical situations where false positives could have serious consequences in a clinical practice. The AU-ROC metric enacts that the RF classifier performs better with the Ins/Ins and G/G genotypes, achieving the lowest MSE statistics compared to all remaining peer scenarios. Given the competing results, we performed logistic regression analysis to further explore the performance characteristics and enhance our understanding of how each predictive feature impacts OS status.
The logistic regression model quantifies the impact of each feature on the OS status, with results reported in Table 4 for scenarios C, D, E and F for concatenating subsets 1, 2, 3 and 4 respectively.
The findings reveal a significant linkage of the feature “Stage” to the OS status. Indeed, a-one-unit increase of the “Stage” value brings the odds ratio near the “Dead” OS status by about 443 %.
In scenario “C” the Del/Del genotype is positively associated with the worse OS status with an odds ratio indicating that individuals with this genotype have about 5.3 % higher likelihood of experiencing poor OS. This emphasizes previous findings highlighting the HLA-G 14 bp Ins/Del polymorphism's role in predicting OS, most notably is the linkage of Del/Del and mortality. In scenario “D”, that the G/G is negatively associated with the OS status, with odds ratios indicating that individuals with G/G genotype have about 61.96 % higher likelihood of experiencing better OS status. This supports earlier results regarding the informative properties of the HLA-G + 3142C/G polymorphism.
Scenario “F” combines clinical factors with “Risk factor HLA-G 14 bp Ins/Del”, a risk score inherited from HLA-G 14 bp Ins/Del. Previously, a weak correlation was shown between “Dead” OS status and “Risk factor HLA-G 14 bp Ins/Del”. Logistic regression analysis confirms this with a negative coefficient, suggesting that a one-unit increase in this predictor is associated with approximately 10.2 % odds of experiencing worse OS status.
In scenario “E”, the combination of haplotypes shows that DelG is positively associated with the “Dead” OS status whereas InsC is negatively associated. Particularly, individuals with the DelG haplotype are approximately 17.4 % more likely to experience a worse OS status, whereas those with InsC haplotype have about 8.1 % less likely to experience this OS status. These findings are consistent with previous analyses showing that InsC haplotype tend to be a better predictor of good OS, whereas DelG tends to correlate with worse OS status. Overall, these findings highlight the insights gained in the four phases of our study and clarify the relative impact of each genetic polymorphism. Specifically, the genotype-based study provides the most reliable outcomes as demonstrated by the high odds ratios for Del/Del and G/G. Thus, the predictive properties of these genotypes prove to be the most reliable.
Finally, we highlight that the robustness of our results has been is supported by rigorous external validation procedures, which are shown in Tables 3 and 4 in italics and subsequent to each scenario.
4 Discussion
This study highlights the significant role of Machine Learning (ML) in predicting Overall Survival (OS) in 266 Colorectal cancer (CRC) patients over three years. HLA-G polymorphisms including genotypes, risk scores, and haplotypes, were identified as strong OS predictors, along with tumor stage, grade, subtype, and location with high accuracy and 100 % precision score. Notably, HLA-G 14 bp Ins/Del and HLA-G + 3142C/G polymorphisms predicted OS using the Random Forest (RF) model, validated externally. Patients with the Del/Del genotype have a high probability of death, unlike the G/G genotype that have a high probability of survival. Our results were strengthened by a rigorous external validation procedure that enabled the reproducibility of the prediction tool for other cancers.
Using MCFA, we identified feature correlations with OS, and quantified their impacts using logistic regression. The RF model outperformed other models. It is consistent with previous studies on it’s the reliability of medical prognostics, but underscoring the need for careful data and feature quality. In prior work, we observed that Del/Del and Del alleles are associated with CRC risk (Dhouioui et al., 2022). In this study, RF analysis confirmed the association of Del/Del genotype with mortality and G/G genotype with survival. Our findings are consistent with other studies showing that the Del/Del genotype is associated with poor prognosis in various types of cancers (Rizzo et al., 2014, Vaquero-Yuste et al., 2021). This association can be explained by increased production of sHLA-G (Rousseau et al., 2003, Veit and Chies, 2009).
The DelG haplotype was associated with poorer OS that may be explained by increased sHLA-G production (Rousseau et al., 2003, Veit and Chies, 2009). Additionally, this haplotype may increase the number of extracellular vesicles bearing HLA-G molecules. Based on the known immune tolerance functions of HLA-G, we speculate that overproduction of HLA-G may suppress cytotoxic cell functions and facilitate the induction of regulatory T cells (Treg) and myeloid-derived suppressor cells (MDSC), thereby reducing the anti-tumor response and promoting metastasis.
By integrating clinical and genetic features, the RF model identified Del/Del and G/G genotypes as OS predictive indicators. This study indicates that adding HLA-G polymorphism analysis to clinical indicators may improve OS prediction and personalize treatment strategies. However, maintaining data quality and representativeness is still critical for the effectiveness of ML in clinical practice.
5 Conclusions
We demonstrated the accuracy and performance of HLA-G 14 bp Ins/Del and HLA-G + 3142C/G gene polymorphisms in OS prediction using machine learning-based approach. The proposed survival predictive approach demonstrated high performance in HLA-G-related genetic studies and provides an innovative decision-making tool to identify candidates for personalized therapeutic intervention.
CRediT authorship contribution statement
Marwa Hasni: Writing – original draft, Visualization, Software, Methodology, Investigation, Formal analysis. Sabrine Dhouioui: Writing – review & editing, Visualization, Resources, Investigation, Formal analysis. Nadia Boujelbene: Writing – review & editing, Resources, Conceptualization. Youssef Harrath: Writing – review & editing, Validation. Abdel Halim Harrath: Writing – review & editing, Validation, Methodology, Funding acquisition. Mohamed Ali Ayadi: Writing – review & editing, Resources. Ines Zemni: Writing – review & editing, Resources. Safa Bhar Layeb: Writing – review & editing, Validation, Supervision, Data curation. Ines Zidi: Writing – review & editing, Validation, Supervision, Project administration, Methodology, Funding acquisition, Data curation, Conceptualization, Resources.
Acknowledgments
This study was supported by the Ministry of Higher Education and Scientific Research of Tunisia, and by Dakota State University and South Dakota Board of Regents: The grant “Emerging Research in Artificial Intelligence and Machine Learning Applied Towards National Security and Cybersecurity. The authors extend their appreciation to the Researchers Supporting Project number RSP2024R17, King Saud University, Riyadh, Saudi Arabia. They are grateful to all participants for their valuable contribution in this research.
Declaration of competing interest
The authors declare that they have no known competing financial interests or personal relationships that could have appeared to influence the work reported in this paper.
References
- NE-nu-SVC: a new nested ensemble clinical decision support system for effective diagnosis of coronary artery disease. IEEE Access. 2019;7:167605-167620.
- [Google Scholar]
- Comparing the efficacy of decision tree and its variants using medical data. Indian J. Sci. Technol... 2017;10:1-8.
- [Google Scholar]
- Plasma soluble HLA-G is a potential biomarker for diagnosis of colorectal, gastric, esophageal and lung cancer. Tissue Antigens.. 2011;78:120-128.
- [Google Scholar]
- Association of HLA-G 3′UTR polymorphisms and haplotypes with colorectal cancer susceptibility and prognosis. Hum. Immunol... 2022;83:39-46.
- [Google Scholar]
- Implications of the polymorphism of HLA-G on its function, regulation, evolution and disease association. Cell. Mol. Life Sci... 2011;68:369-395.
- [Google Scholar]
- Pharmacogenetic score predicts overall survival, progression-free survival and platinum sensitivity in ovarian cancer. Pharmacogenomics. 2020;21:995-1010.
- [Google Scholar]
- Genetic prediction of long-term survival after neoadjuvant chemoradiation in locally advanced esophageal cancer. Pharmacogenomics J.. 2017;17:252-257.
- [Google Scholar]
- Reviewing ensemble classification methods in breast cancer. Comput. Methods Programs Biomed... 2019;177:89-112.
- [Google Scholar]
- AI in healthcare: time-series forecasting using statistical, neural, and ensemble architectures. Front. Big Data.. 2020;3
- [Google Scholar]
- Integration of ensemble and evolutionary machine learning algorithms for monitoring diver behavior using physiological signals. IEEE Access.. 2019;7:98971-98992.
- [Google Scholar]
- Liashchynskyi, P. & Liashchynskyi, P. 2019. Grid Search, Random Search, Genetic Algorithm: A Big Comparison for NAS. arXiv, eprint: 1912.06059. https://arxiv.org/abs/1912.06059.
- Matthew, R., Agustriawan, D., Bani, M. D., Sadrawi, M., Ratnasari, N. R. P., Firmansyah, M. & Parikesit, A. A. Year. The Development of A Medical Chatbot Using The SVM Algorithm. In: 2022 4th International Conference on Cybernetics and Intelligent System (ICORIS), 8-9 Oct. 2022 2022. 1-6.
- HLA-G is a component of the chronic lymphocytic leukemia escape repertoire to generate immune suppression: impact of the HLA-G 14 base pair (rs66554220) polymorphism. Haematologica.. 2014;99:888-896.
- [Google Scholar]
- The 14 bp deletion-insertion polymorphism in the 3′ UT region of the HLA-G gene influences HLA-G mRNA stability. Hum. Immunol... 2003;64:1005-1010.
- [Google Scholar]
- HLA-G 3’UTR polymorphisms are linked to susceptibility and survival in spanish gastric adenocarcinoma patients. Front. Immunol... 2021;12
- [Google Scholar]
- Tolerance versus immune response — MicroRNAs as important elements in the regulation of the HLA-G gene expression. Transpl. Immunol... 2009;20:229-231.
- [Google Scholar]
- ECG signal preprocessing and SVM classifier-based abnormality detection in remote healthcare applications. IEEE Access. 2018;6:9767-9773.
- [Google Scholar]
- Hybrid particle swarm optimization for rule discovery in the diagnosis of coronary artery disease. Expert. Syst.. 2021;38:1-17.
- [Google Scholar]
Appendix A
Supplementary data
Supplementary data to this article can be found online at https://doi.org/10.1016/j.jksus.2024.103564.
Appendix A
Supplementary data
The following are the Supplementary data to this article:


