

Translate this page into:
Groundwater quality assessment in western Saudi Arabia using GIS and multivariate analysis
⁎Corresponding author. Falshehria@ksu.edu.sa (Fahad Alshehri)
-
Received: ,
Accepted: ,
This article was originally published by Elsevier and was migrated to Scientific Scholar after the change of Publisher.
Peer review under responsibility of King Saud University.
Abstract
In arid and semi-arid regions, assessment of groundwater quality and potentially toxic elements is essential issue for health of the human being. Groundwaters were collected from sixty-eight wells in Harrat Khaybar, Saudi Arabia to evaluate their suitability for drinking and irrigation purposes and to document the potential sources of contamination. Several contamination indices and inverse distance weighted technique were applied for assessing contamination and generate spatial maps for the potentially toxic elements (PTEs). The results showed that the average values of the ions, Cl–, SO42–, HCO3–, NO3–, Na+, Ca2+, Mg2+, and the total dissolved solids (TDS) were greater than the permissible limit for drinking water while the average values of PTEs were less than the permissible limit, with exceeding limits of Cr, Se, As, Zn, and Pb in some individual samples. Piper diagram indicated that 47.10% of the water samples are of Na-K-SO4-Cl type, 23.51% of Ca-Mg-CO3-HCO3 type, 23.51% of Ca-Mg-SO4-Cl type, and 5.88% of Na-K-CO3-HCO3 type. Based on the groundwater quality index (GWQI), 29 of the groundwater wells were categorized as excellent and good water for drinking purposes, while 29 wells fell under poor, very poor water, and unsuitable for drinking. Additionally, results of heavy metal pollution index (HPI) indicated that all waters fell within the low pollution category, while results of the metal index (MI) indicated that 35 wells fell within very pure, pure, and slightly affected categories, while 33 wells fell in the moderately, strongly, and seriously affected categories. Results of sodium adsorption ratio (SAR), sodium percentage (%Na), and magnesium ratio (MR) revealed that 33.82–98.5 % of the water samples are suitable for irrigation depending on the parameter type. Ions exchange reactions and dissolution of rock forming minerals, as well as industrial and domestic effluents and intensive use of fertilizers and pesticides were the natural and anthropogenic factors controlling the groundwater geochemistry in the study area and PTE contamination in some wells.
Keywords
Potentially toxic elements
Groundwater quality index
Harrat Khaybar
Saudi Arabia

1 Introduction
The quality and quantity of groundwater used for drinking, industrial, agriculture, and domestic uses must be evaluated and monitored to ensure access to water of good quality especially in areas with urban development (Delgado et al. 2010; Alghamdi et al. 2020). Anthropogenic activities close to boreholes and shallow hand dug wells such as domestic practices (waste disposal and poor sanitation), agriculture, mining, industrialization, and urbanization deteriorate the groundwater system (Salifu et al. 2015; Ashehri et al. 2021). The climate, rock weathering, and evapotranspiration were the natural geochemical characteristics affecting groundwater quality, while, sewage disposal, agriculture and industrial wastes were the anthropogenic ones (Singh and Chandel 2006).
The shallow groundwater aquifers near the major cities in Saudi Arabia are becoming polluted due to agriculture and domestic sewerage and industrial effluent discharge (Mallick et al. 2021). Various agricultural farms around Al-Madinah and Khaybar cities conduct important agricultural activities. Shraim et al. (2013) Proven that the nitrate, fluoride, and arsenic levels of the groundwater collected from Al-Madinah Almunawarah were higher than the guideline values of WHO in 65 %, 8 %, and 5 %, of the samples, respectively. The higher nitrate and biological oxygen demand values in groundwater of Al-Madinah city were attributed to industrial and septic tanks (Khan et al. 2020). Excess of different inorganic pollutants in groundwater, such as nitrate, chloride, arsenic, lead, zinc, and cadmium due to overuse of chemical fertilizers causing serious health complications for human being, such as methemoglobinemia in infants, stomach cancer, liver, kidney and skin damage, and high blood pressure (Bryan and Ivy 2015; Al-Hashimi et al. 2021).
Studies dealt with groundwater resources in Harrat Khaybar and their human health risks are very limited. Moreover, numerous villages and residential communities were developed in the area and the nearsurface groundwaters are limited and insufficient for residential consumption and agricultural projects (Alshehri and Abdelrahman 2021). Given that the shallow aquifers were contaminated with agriculture, domestic, and industrial effluents, thus, the main objectives of the present work are: i) to assess the contamination of the major cations and anions, and PTEs in groundwater of the Harrat Khaybar using pollution indices, ii) to document the spatial distribution of PTEs in the study area, and iii) to identify the possible sources of ions and PTE contamination using multivariate analyses. The outcomes provide essential information for decision-makers to manage the aquifer and the suitability of the groundwater for different purposes.
2 Materials and methods
2.1 Geology of the study area
The Harrat Khaybar is situated to the north of Al-Madinah Almunawarah, Saudi Arabia, at 25°44ʹ04″ N and 39°58ʹ51″ E, and covers approximately 14,000 km2 (Fig. 1). It is a Cenozoic lava field which is mainly composed of basaltic lava flows and created during the formation of Red Sea (Pint 2006; Sonbul 2016). Geologically, the following rock units were described from Harrat Khaybar (Fig. 2): Al Ays volcanic and sedimentary group, the Khanzirah complex, Hamra Badi—partly covered by lower Paleozoic sandstone and Cenozoic flood basalt—Cambrian-Ordovician thick-bedded and pink weathering Saq sandstone, Cenozoic Harrat Khayber and Tertiary boulder conglomerates and fissile shales, unconsolidated Quaternary deposits of wadi alluvium, eolian sand, and sabkhah deposits (Kemp 1981; Sonbul 2016).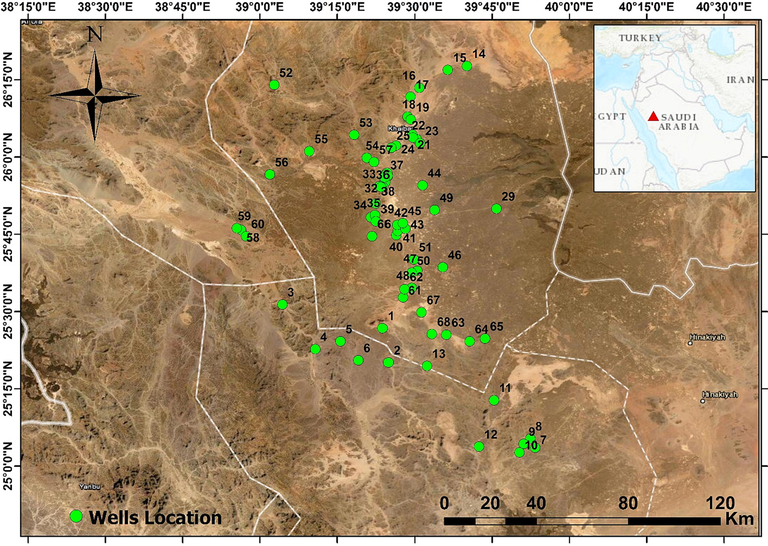
Location map of the groundwater samples at Harrat Khaybar, Saudi Arabia.
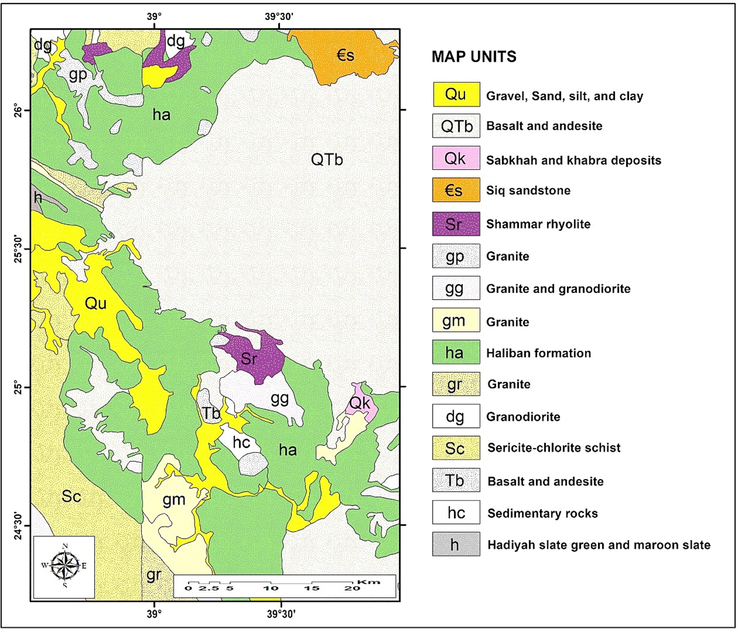
Geologic map of Harrat Khaybar, Saudi Arabia (Modified after Alshehri et al., 2022).
The tuff rings and domes of white felsic rocks are characteristic features of Harrat Khaybar rather than all other harrats in Saudi Arabia (Sonbul 2016). On the eastern edge, there are many villages and small towns, such as Al-Nakheel, Al-Hanaquiyah, Al-Huwait, Al-Hayit, and Ash-Shamly, while Khaybar and Al-Ashash lie on its western edge. The paleoclimate in Harrat Khaybar varies between wet periods during the Pliocene and some parts of the Pleistocene to dry-arid conditions during the Holocene and desert at present (Peel et al. 2007; Sulieman et al. 2021). The Harrat Khayber is considered as an arid region with high temperatures throughout the whole year with high evaporation and relatively less infiltration rates. The major source of any natural water storage is the rainfall. The annual rainfall varied from year to year with high percentage in the winter and spring seasons. The mean of precipitation is<13 mm rainfall per year.
2.2 Sampling, analytical, and multivariate analyses
A total of 68 groundwater samples were sampled in winter, 2020—from 4.2 to 130 m depth dugwells and boreholes in Harrat Khaybar, western Saudi Arabia (Fig. 1). The investigated groundwater is almost used for irrigation through dug wells and boreholes in farms, as well as livestock, domestic, drinking, and industrial benefits. The major source of domestic water is desalinated water that is pumped from Yanbu Power and desalination plant at the Red Sea coast. Data were obtained from the Saudi Ministry of Water and Electricity reports (MoWE, 2015), including hydrogeochemical parameters (pH, EC, and TDS), the ions (Cl–, NO3–, F–, SO42–, HCO3–, Mg2+, Ca2+, K+, and Na+), and PTEs (Hg, Al, Sb, Cu, Cr, B, Pb, Ni, Se, Cd, As, and Zn) (Supplementary Table 1). The anions, HCO3–, NO3–, Cl–, and SO42– were determined using acid titration, phenoldisulfonic acid, silver nitrate titration, and a turbidity procedure, respectively. The cations, K+ and Na+ were determined by a flame photometer (Corning 400), while Mg2+ and Ca2+ were determined using the titration method with ethylenediaminetetraacetic acid. PTEs were determines using Inductively Coupled Plasma-Mass Spectrometer (ICP-MS).
Indices
Procedures of calculation and classifications
Water quality index (WQI)
WQI = ΣSIi
SIi = Wi × qi
qi = (Ci/Si) × 100
Wi = wi/Σ wi
where SIi is the sub index of each parameter and qi is the rating based on concentration of each parameter, Ci and Si are the concentration of each parameter in each water sample and the standard of each parameter in mg/L, respectively (WHO 2017). wi is the weight of each parameter. The quality rating scale (qi) for each parameter is calculated by dividing the parameter concentration in each water sample by its respective standard (WHO 2017) multiplied by 100. The computed WQI values are classified into five categories (Alharbi et al., 2021): WQI < 50 (excellent water), WQI = 50–100.1 (good water), WQI = 100–200.1 (poor water), WQI = 200–300.1 (Very poor water), and WQI > 300 (Unsuitable for drinking purposes).
Heavy metal pollution index (HPI)
Wi = 1/MAC
Qi = Σ (Mi - Ii/Si – Mi) × 100
HPI = ∑WiQi/∑Wi
where Wi and MAC are the relative weight of each parameter and its maximum allowable concentration in drinking water (Table 2). Mi is the monitored value of PTE in the water sample, Si is the highest permissible value for drinking water and Ii is the maximum desirable value for each parameter (WHO 2011). Based on the HPI, the groundwater quality is classified into three categories (Mohan et al. 1996): HPI < 45 (low pollution), HPI = 45–90 (medium pollution), and HPI > 90 (high pollution).
Metal index (MI)
MI =
where C and MAC are the concentration of each element and its maximum allowed concentration, respectively. MI is classified into six categories (Siegel 2002): MI < 0.3 (very pure), MI = 0.3–1.0 (pure), MI = 1.0–2.0 (slightly affected), MI = 2.0–4.0 (moderately affected), MI = 4.0–6.0 (strongly affected), and MI > 6.0 (seriously affected).
Sodium adsorption ratio (SAR)
SAR = Na+/(√ Ca2+ + Mg2+)/2
All concentrations are stated in meq/L. The ratio classifies groundwater quality into four groups (Richards 1954): SAR < 10 (excellent), SAR = 10–18 (good), SAR = 18–26 (doubtful), and SAR > 26 (unsuitable).
Sodium percentage (Na%)
Na% = Na+/(Na++ K++ Ca2++Mg2+) × 100
All the values are expressed in meq/L. All the values are expressed in meq/L. It classifies groundwater quality into five groups (Alharbi et al. 2021): Na% < 20 % (excellent), Na% = 20–40 % (good), Na% = 40–60 % (permissible), Na% = 60–80 % (doubtful), and Na% > 80 % (unsuitable).
Magnesium ratio (MR)
MR = Mg2+/ (Ca2+ + Mg2+) × 100
All the values are expressed in meq/L. It is proposed by Raghunath (1987) and classifies groundwater quality into two groups: MR < 50 % (suitable) and MR 50 % (unsuitable).
Kelly’s ratio (KR)
KR = Na+/(Ca2+ + Mg2+)
The ratio classifies groundwater quality into two groups (Zhang et al. 2021): KR < 1 (safe) and KR > 1 (unsafe).
Herein, the Piper plot is prepared to determine the groundwater facies, and monitoring of groundwater quality and spatial distribution maps have been prepared using ArcGIS 10.7.1. The inverse distance weighted (IDW) technique was used to generate spatial interpolation maps for PTEs (Alshehri et al., 2020). The multivariate statistical techniques were principal component analysis (PCA), Q-mode hierarchical cluster analysis (HCA), and correlation analysis (CA). The GWQI, HPI, and MI were used to document water quality, while SAR, %Na, and MR are used as criteria to identify the characteristics of water used for irrigation (Table 1).
3 Results and discussion
3.1 Groundwater chemistry
The geological and hydrogeological setting of the study area, as well as chemical weathering, and human activities were the main factors affecting the hydrochemistry of groundwater (Wu et al. 2020). Results of pH indicated slightly acidic to slightly basic groundwaters (from 6.54 to 8.07), and fall within the standards prescribed for drinking water (WHO, 2014; 2017). TDS varied from 225 to 8340, with an average of 2165 mg/L, exceeding the acceptable limit (1000 mg/L) of WHO (2017). According to Freeze and Cherry (1979), 24 groundwater samples (35.29 %) fall under the freshwater category (e.g., S14, S15, S46, S52, S63, S64, S65, and S68) with TDS<1000 mg/L, and 44 samples (64.71 %) fall under the brackish to saline water category (e.g., S3, S4, S19, S34, S40, S41, and S54) with TDS>1000 mg/L. Na+ was the most abundant cations (average of 427.90 mg/L), followed by Ca2+ (average of 150.95 mg/L), Mg2+ (average of 99.86 mg/L), and K+ (average of 12.42 mg/L), and B3+ (average of 0.45 mg/L). Cl– was the most abundant anions (average of 635.74 mg/L), followed by SO42– (average of 518.34 mg/L), HCO3– (average of 361 mg/L), NO3– (average of 67.87 mg/L), and F– (average of 0.53 μg/L) (Table 2).
Minimum
Maximum
Average
MAC
Weights (wi)
Relative weight (Wi)
EC (µS/cm)
347
12,870
3333
1500
3
0.073
pH
6.54
8.07
7.44
6.5–8.5
3
0.073
TDS (mg/L)
225
8340
2165
1000
4
0.098
Ca2+ (mg/L)
11.00
746.90
150.95
75
2
0.049
Mg2+ (mg/L)
9.10
711.60
99.86
30
2
0.049
Na+ (mg/L)
9.60
2244.52
427.90
200
2
0.049
K+ (mg/L)
0.20
130.57
12.42
12
2
0.049
Cl–(mg/L)
5.50
3700.00
635.74
250
3
0.073
HCO3–(mg/L)
106.00
876.00
361.00
200
2
0.049
NO3–(mg/L)
1.00
450.00
67.87
50
5
0.122
SO42–(mg/L)
8.00
2200.00
518.34
250
3
0.073
F–(mg/L)
0.01
1.71
0.53
1.5
3
0.073
B (μg/L)
35.87
1888.38
454.33
2400
3
0.073
Al (μg/L)
0.10
266.86
6.47
Cr (μg/L)
0.10
78.93
12.90
50
Mn (μg/L)
0.09
735.85
11.68
Ni (μg/L)
0.10
34.77
4.39
70
Cu (μg/L)
0.13
9.69
1.61
2000
Zn (μg/l)
0.11
123.31
7.51
50
As (μg/L)
0.13
25.39
2.84
10
Se (μg/L)
0.10
110.72
14.27
40
Cd (μg/L)
0.10
0.42
0.11
3
Sb (μg/L)
0.10
0.49
0.11
20
Ba (μg/L)
0.10
311.13
23.76
700
Pb (μg/L)
0.10
18.97
0.40
10
U (μg/L)
0.18
21.20
4.40
30
Fig. 3 illustrates the groundwater types. The triangle diagram of cations shows that sodium and potassium are the leading cations in 52.94 % of the groundwater samples, 32.35 % fall within the no dominant type, and 14.71 % of the samples have cations that are dominated by calcium and magnesium. On the anions plot, 70.59 % of groundwater samples fall under the sulphate and chloride type, while the remaining 29.41 % are of the bicarbonate type, indicating a leading role for bicarbonate in groundwater. The diamond diagram shows that 32 samples (47.10 %) represent the (Na-K)-(SO4-Cl) type, 16 samples (23.51 %) account (Ca-Mg)-(CO3-HCO3) type, 16 samples (23.51 %) represent (Ca-Mg)-(SO4-Cl) type, and 4 samples (5.88 %) represent (Na-K)-(CO3-HCO3) type (Fig. 3). The 24 fresh water samples (e.g., S14–S17, S46, S51, S52, S63, S65, S67, S68) showed the lowest values of TDS and Na+, and Cl– (S15), Mg2+ (S52), K+ and SO42– (S14), F–, and (S67).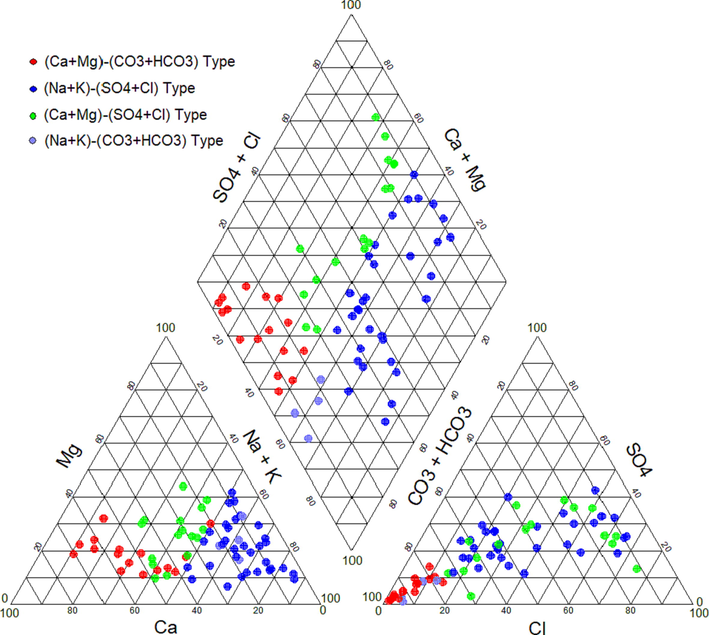
Classification of the groundwater types using Piper diagram.
3.2 Suitability of groundwater for drinking
The average values of Cl–, SO42–, HCO3–, NO3–, Na+, Ca2+, and Mg2+ were greater than the permissible limit for drinking water (Table 1), especially in most of the Na-K-SO4-Cl and Ca-Mg-SO4-Cl water types, indicating ion exchange reactions and dissolution of bearing minerals (Li et al. 2016). Moreover, some of these ions might originate anthropogenically, from overuse of fertilizers, domestic and industrial effluents, and the metal industry (Reimann and Caritat 1998; Alghamdi et al. 2020).
Water samples from wells 1 and 13 showed F– levels that were greater than the permissible limit in drinking water (1.5 mg/L), implying extensive use of phosphatic fertilizers in agricultural areas and leaching of F–-rich minerals (Dissanayake and Chandrajith 2009). Notably, 54.41 % and 48.53 % of the water samples had SO42– and Cl– concentrations greater than the permissible limit (250 mg/L), respectively. Further, 91.18 % and 67.65 % of the water samples had HCO3– and Na+ concentrations greater than the permissible limit (200 mg/L), respectively. Furthermore, 70.59 %, 55.88 %, and 45.59 % had Mg2+, Ca+ and NO3– concentrations greater than the permissible limit (30, 75, 50 mg/L), respectively.
In the present study, GWQI ranged from 24.25 in S15 to 637.20 in S40 (Fig. 4, Supplementary Table 2). Based on the calculated values of the GWQI, 19.12 % of the water samples (13 samples), 23.53 % (16), 35.29 % (24), 5.88 % (4), and 16.18 % (11) were categorized as excellent water, good water, poor water, very poor water, and unsuitable for drinking purposes, respectively. The excellent quality samples (S14–S17, S46, S51–S53, S63–S65, S67, and S68) showed the lowest values of EC, TDS, Na+, and Cl– (S15), Mg2+ (S52), K+ and SO42– (S14), F– (S67), and B3+ (S46). In the other hand, the wells of unsuitable water recorded the highest levels of TDS, Na+, Cl– (S40), TH (S62), Ca2+ (S61), Mg2+ (S34), K+ (S39), NO3– (S54), SO42– and B3+ (S4), and F– (S13).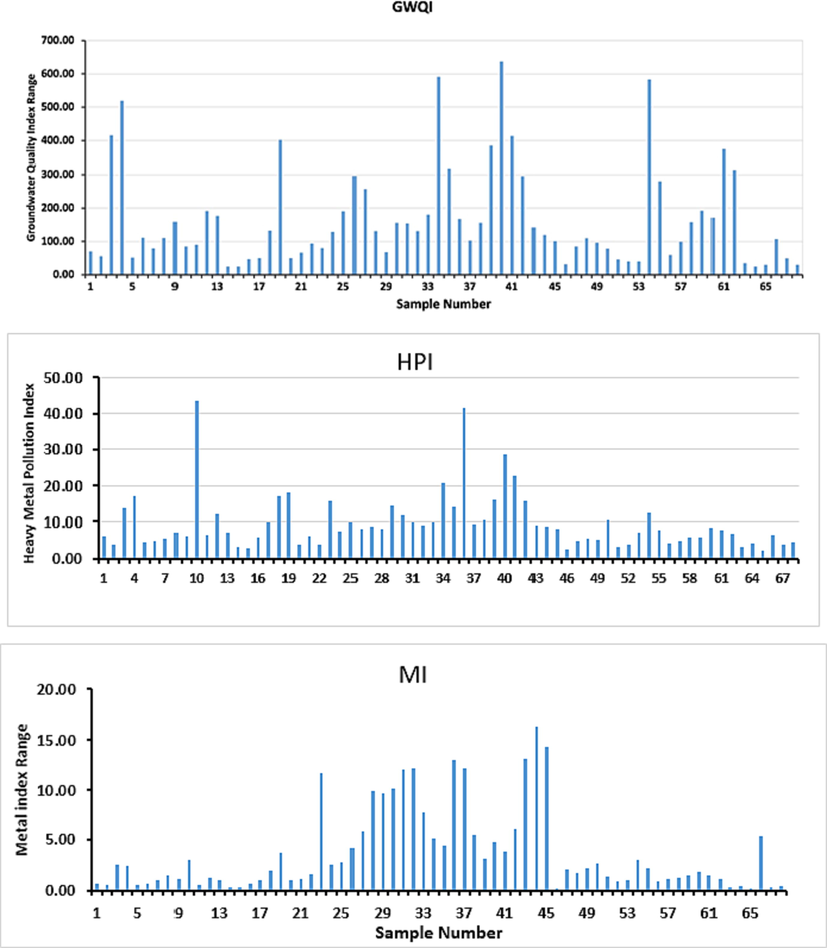
Distribution of GWQI, HPI, and MI in the studied wells.
Groundwater from Harrat Khaybar showed HPI values varied from 2.17 in S65 to 43.55 in S10, with an average of 10.07 (Fig. 4, Supplementary Table 2). Accordingly, all water samples fell within the low pollution category (HPI < 45). The higher levels of HPI in same water samples, e.g., S10 (43.55), S36 (41.37), and S40 (28.67) might be related to exceeding the levels of As (S10), Cr and Pb (S36), and As and Se (S4) in comparison to MAC values of the drinking water (Table 2). MI values varied in the study area from 0.22 in S65 to 16.38 in S44, with an average of 3.83 (Supplementary Table 2). Based on the calculated values of MI, two water samples (S46 and S65) fell within very pure category, 19 samples as pure, 14 samples as slightly affected, 13 samples as moderately affected, 7 samples as strongly affected, and 13 samples as seriously affected. The high concentrations of Se in S23, Cr in S36, S37, and S43–S45, and Pb in S36 could be the reasons for the higher values of MI in these samples.
The average values of the PTEs in the examined wells were less than the permissible limit of WHO standards for drinking water (Table 1), although the values of Cr, Se, As, Zn, and Pb were higher than the permissible limit mentioned in Table 1 in 7, 6, 3, 2, and one water samples, respectively. Leakage of industrial wastewater and the overuse of chemical fertilizers might be the main point source of the pollution with Cr, Se, As, Zn, and Pb in some groundwater wells (Al-Hashimi et al. 2021). Fig. 5 presented the spatial distribution of the PTEs in the groundwater samples.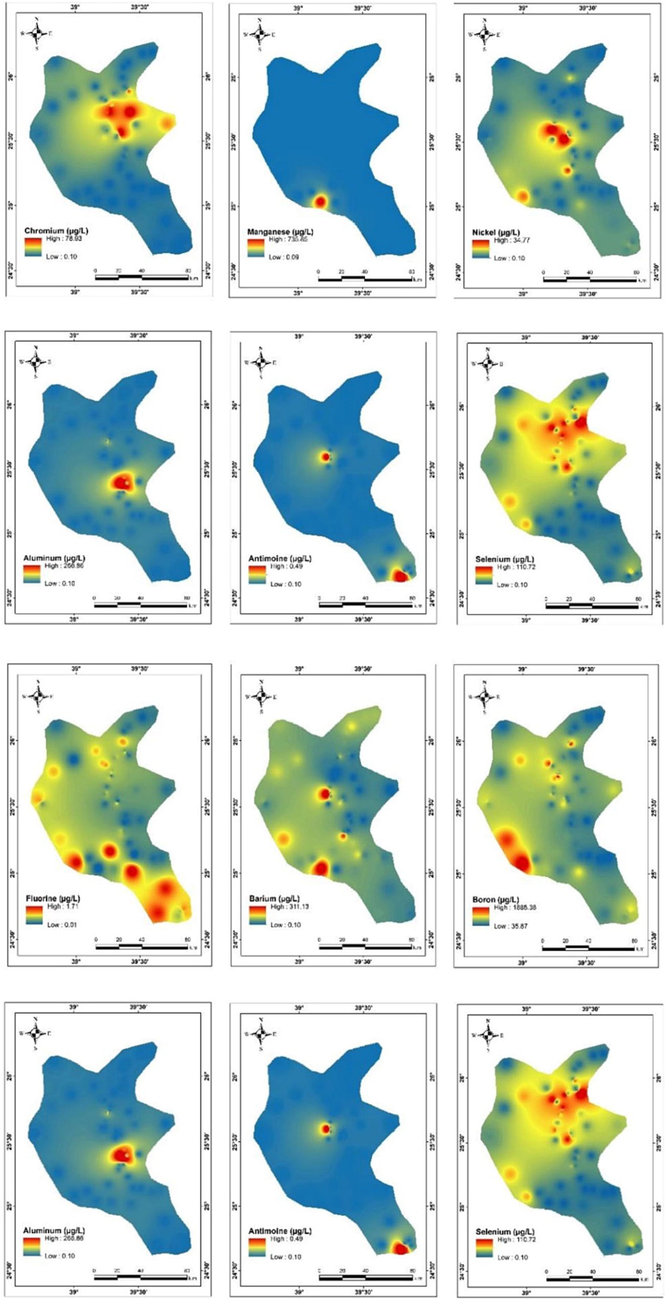
Spatial distribution of PTEs in the groundwater wells at Harrat Khaybar.
3.3 Suitability of groundwater for irrigation
The % Na values indicated the soluble sodium content and ranged from 9.52 to 85.66, with an of average 50.55. Water quality classification based on % Na showed that 51 of the groundwater samples (75 %) were suitable for irrigation, (excellent, good, and permissible categories), and 17 samples (25 %) were doubtful and unsuitable for irrigation (Fig. 6, Supplementary Table 2). The doubtful and unsuitable groundwater samples, e.g., S3, S4, S27, S31, and S40 showed higher levels of Na+. Long-term use of water for irrigation with excessive sodium will destroy the soil structure and permeability, leading to soil compaction and reduction of crop yields (Marghade et al. 2021). Based on SAR results, 85.3 % (58 samples) were categorized as excellent, 9 samples as good, and only one (S53) as doubtful for irrigation. The doubtful for irrigation sample belongs to the Na-K-SO4-Cl water type. MR varied from 16.65 to 84.62 %, with an average of 48.07 %, suggesting that 37 of the water samples (54.41 %) were suitable for irrigation (MR < 50 %) and the remaining 31 samples (45.59 %) were unsuitable for irrigation. The unsuitable water samples for irrigation, e.g., S12, S25–S27, S40–S42, S54, and S60 showed higher concentrations of Mg2+, which might be reduces the crop yield (Dumaru et al. 2021).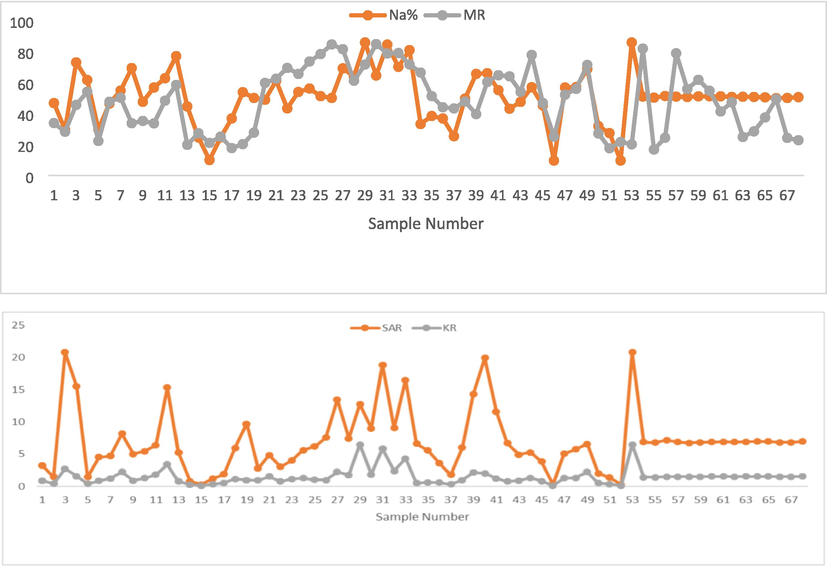
Distribution of Na%, MR, SAR, and KR in the studied wells.
3.4 Multivariate analysis
HCA is an effective tool to divide water samples into different clusters based on groundwater chemistry data (Belkhiri et al. 2010). Q mode HCA categorizes the 68 groundwater samples into three clusters, mainly based on TDS and ion levels (Supplementary Fig. 1). Cluster 1 includes 7 samples (S3, S4, S19, S34, S40, S41, and S54), which account higher levels of TDS (ranged from 5490 to 8340 mg/L, with an average of 6950 mg/L), and the highest values of EC, Na+, Cl–, and Ni (S40), Mg2+, Sb, and Ba (S34), NO3– (S54), SO42– and B (S4), and U (S19). Increasing NO3– might be related to the intensive use of fertilizers and pesticides (Alshahri and El‑Taher 2018). All groundwater samples of cluster 1 belong to Na-K-SO4-Cl type, except sample 34, which belongs to Ca-Mg-SO4-Cl type. Cluster 2 includes 8 samples (S26, S27, S35, S39, S42, S55, S61, and S62), with medium TDS levels (ranged from 3250 to 5250 mg/L, with an average of 4018.75 mg/L). S35, S42, S55, S61, and S62 belong to Ca-Mg-SO4-Cl type, while S26, S27, and S39 belong to Na-K-SO4-Cl type. Cluster 3 includes the remaining 53 samples, accounting the lower values of TDS (ranged from 225 to 2930 mg/L, with an average of 1264.64 mg/L), and the lowest levels of EC, TDS, and Na+ (S15), pH, HCO3–, and U (S66), TH (S30), Ca2+ (S29), Mg2+ (S52), K+, Cl–, SO42–, and Zn (S14), NO3– (S31), F (S6), B (S46), Cr (S2), Mn (S43), Ni (S22), Cu (S11), As (S65), Se (S67), Ba (S44). 23 samples of the cluster 3 belong to Na-K-SO4-Cl type, 16 samples to Ca-Mg-CO3-HCO3 type, 10 samples to Ca-Mg-SO4-Cl type and 4 samples to Na-K-CO3-HCO3 type. 24 groundwater samples of cluster 3 were of freshwater category (TDS<1000 mg/L).
Pearson correlation is a technique used to identify similar sources of major ions and PTEs with good correlation (Yin et al. 2021). The correlation coefficient (r) < 0.5 indicates weak correlation, r = 0.5 to 0.7 indicates moderate correlation, and r > 0.7 indicates strong correlation (Oinam et al. 2012). Table 3 showed strong and moderate correlations between EC and TDS, Ca2+, Mg2+, Na+, Cl–, NO3–, SO42–, B, Ni, Cu (r = 1.00, 0.75, 0.85, 0.94, 0.98, 0.55, 0.93, 0.70, 0.77, and 0.66, respectively), which indicates a similar origin related to rock-water interaction and evaporation (Khan et al. 2020). Ca2+ showed moderate and strong correlations with Mg2+, Na+, Cl–, SO42–, Ni, and Cu (r = 0.64, 0.55, 0.78, 0.69, 0.70, and 0.56, respectively), reflecting the rock–water interaction is possible source of these ions in groundwater (Li et al. 2016; Wu et al., 2020). SO42– is strongly and moderately correlated with Ca2+, Mg2+, Na+, Cl–, and NO3– (r = 0.69, 0.78, 0.89, 0.86, and 0.50, respectively), indicating the possibility of dissolution of halite, gypsum, sulfur-bearing minerals, as well as agricultural and industrial wastewater (Jalali 2010; Zhang et al. 2021). Moreover, Ni and Cu are strongly and moderately correlated with Ca2+, TH, Mg2+, Na+, Cl–, and SO42–. Moreover, Ba is moderately correlated with Mg, Ni, and Sb. Moreover, U is moderately correlated with SO42– and B, suggesting that soluble sulphate minerals and excessive use of phosphate-containing fertilizers are sources of these metals (Alfaifi et al. 2021; Alshehri et al. 2021; Alharbi et al., 2021). **Correlation is significant at the 0.01 level (2-tailed). *Correlation is significant at the 0.05 level (2-tailed).
EC
pH
TDS
TH
Ca
Mg
Na
K
Cl
HCO3
NO3
SO4
F
B
Al
Cr
Mn
Ni
Cu
Zn
As
Se
Cd
Sb
Ba
Pb
U
EC
1
pH
−0.222
1
TDS
1.00**
−0.223
1
TH
0.239*
−0.095
0.239*
1
Ca
0.747**
-0.265*
0.747**
0.362**
1
Mg
0.848**
−0.222
0.848**
0.204
0.640**
1
Na
0.941**
−0.144
0.941**
0.16
0.550**
0.690**
1
K
0.477**
−0.121
0.477**
0.11
0.240*
0.282*
0.555**
1
Cl
0.976**
−0.225
0.976**
0.247*
0.779**
0.827**
0.912**
0.518**
1
HCO3
−0.039
0.158
−0.038
−0.187
-0.332**
−0.002
0.058
−0.049
−0.156
1
NO3
0.546**
0.11
0.545**
0.229
0.364**
0.593**
0.472**
0.298*
0.521**
−0.103
1
SO4
0.932**
−0.202
0.931**
0.235
0.693**
0.776**
0.891**
0.337**
0.861**
−0.05
0.500**
1
F
0.283*
0.163
0.283*
−0.087
0.187
0.12
0.324**
0.051
0.248*
0.225
0.107
0.297*
1
B
0.697**
−0.174
0.696**
0.107
0.424**
0.430**
0.739**
0.219
0.598**
0.233
0.322**
0.747**
0.369**
1
Al
−0.102
−0.108
−0.102
−0.074
−0.021
−0.085
−0.118
0.115
−0.089
−0.055
−0.05
−0.106
−0.144
−0.123
1
Cr
−0.045
−0.232
−0.046
−0.045
−0.172
0.001
−0.024
0.037
−0.114
0.13
0.047
0.033
−0.104
0.08
−0.031
1
Mn
−0.04
0.069
−0.04
−0.11
−0.01
−0.025
−0.045
0.008
−0.031
0.196
−0.087
−0.103
−0.17
0.022
0.006
−0.075
1
Ni
0.772**
-0.428**
0.772**
0.281*
0.703**
0.731**
0.670**
0.591**
0.814**
−0.163
0.291*
0.651**
0.088
0.293*
0.006
−0.097
−0.031
1
Cu
0.661**
-0.305*
0.661**
0.309*
0.564**
0.556**
0.609**
0.236
0.670**
−0.177
0.407**
0.599**
0.22
0.453**
−0.048
−0.028
−0.036
0.489**
1
Zn
−0.012
−0.174
−0.013
−0.11
0.032
−0.061
0.001
0.035
−0.012
−0.053
−0.065
0.016
−0.091
0.071
0.551**
0.023
−0.02
0.002
−0.004
1
As
0.488**
-0.239*
0.489**
0.107
0.380**
0.382**
0.491**
0.368**
0.495**
−0.07
0.106
0.470**
0.148
0.266*
−0.057
−0.178
−0.028
0.583**
0.235
−0.042
1
Se
0.468**
0.042
0.468**
0.095
0.192
0.470**
0.463**
0.184
0.394**
0.156
0.466**
0.507**
−0.01
0.388**
−0.093
0.339**
−0.1
0.247*
0.251*
−0.028
0.081
1
Cd
−0.047
−0.129
−0.047
−0.014
−0.012
−0.073
−0.041
0.094
−0.075
0.095
−0.113
−0.005
0.077
0.179
0.086
0.19
−0.024
−0.035
−0.075
−0.06
0.470**
−0.033
1
Sb
0.216
-0.251*
0.217
−0.036
0.255*
0.427**
0.096
−0.004
0.224
−0.048
0.088
0.171
−0.033
0.044
−0.032
−0.057
−0.02
0.360**
0.128
−0.023
0.618**
0.023
0.404**
1
Ba
0.362**
−0.187
0.363**
−0.039
0.460**
0.547**
0.204
0.048
0.413**
−0.096
0.104
0.224
−0.079
0.08
−0.046
−0.222
0.317**
0.505**
0.241*
−0.058
0.253*
−0.025
−0.093
0.655**
1
Pb
−0.015
0.006
−0.015
0.008
0.031
−0.011
−0.046
0.2
−0.033
0.033
0.013
−0.017
0.048
0.09
0.177
0.236
−0.008
−0.01
−0.03
−0.017
−0.032
0.01
0.624**
−0.022
−0.068
1
U
0.443**
−0.071
0.442**
0.11
0.389**
0.250*
0.452**
0.076
0.346**
0.025
0.085
0.608**
0.264*
0.525**
−0.134
0.036
−0.118
0.308*
0.237
0.01
0.261*
0.316**
−0.056
−0.095
−0.003
−0.005
1
PCA divided the hydrochemical parameters according to the relationship between the different variables (Wen et al. 2019). Nine principal components, accounting for 34.56 %, 9.15 %, 7.80 %, 6.65 %, 5.51 %, 5.41 %, 4.74 %, 4.01 %, and 3.83 % of the total variance, were extracted with eigenvalues>1 (Table 4). PC1 showed high positive loading of EC, TDS, Ca2+, Mg2+, Na+, Cl–, NO3–, SO42–, B, Ni, Cu, and As, and represented the main factor affecting the hydrochemistry of the groundwater in the study area (Rezaei et al. 2017). Moreover, the high positive loading with NO3– indicates an anthropogenic factor from the agricultural activity (Li et al. 2018, 2019). PC3 shows high loading for Pb and Cd, which may be attributed to fertilizers and pesticides through soil leaching (Kukrer and Mutlu 2019). PC5 and PC8 showed high loading for Zn and Mn, respectively, which might originate from mixed anthropogenic and natural factors (Nour et al. 2019; Al-Hashim et al. 2021).
Component
1
2
3
4
5
6
7
8
9
EC
0.984
0.08
−0.032
0.001
0.058
0.016
0.038
0.007
−0.01
pH
−0.279
0.392
−0.188
0.34
0.031
−0.008
0.546
−0.261
0.166
TDS
0.984
0.079
−0.032
0.002
0.058
0.017
0.038
0.007
−0.011
TH
0.287
000
−0.161
−0.233
−0.532
−0.136
0.068
0.265
0.117
Ca
0.781
−0.213
−0.152
−0.102
−0.081
−0.18
−0.011
0.136
0.283
Mg
0.855
−0.119
−0.097
0.07
−0.025
0.301
−0.007
−0.144
0.123
Na
0.911
0.226
0.034
0.023
0.138
−0.037
0.075
0.007
−0.181
K
0.488
−0.027
0.214
−0.247
0.015
0.019
0.495
0.088
−0.549
Cl
0.965
−0.028
−0.103
−0.036
0.027
−0.016
0.113
0.013
−0.04
HCO3
−0.086
0.356
0.3
0.418
0.423
0.264
−0.018
0.053
−0.107
NO3
0.554
0.223
−0.141
−0.092
−0.217
0.324
0.319
−0.315
0.192
SO4
0.928
0.201
0.033
−0.009
0.037
−0.052
−0.122
−0.022
0.056
F
0.273
0.355
0.136
0.353
0.175
−0.478
0.088
−0.156
0.174
B
0.678
0.373
0.261
0.105
0.224
−0.077
−0.159
0.156
0.161
Al
−0.104
−0.217
0.207
−0.633
0.43
−0.017
0.2
−0.174
0.168
Cr
−0.04
0.278
0.446
−0.224
−0.225
0.497
−0.365
0.08
−0.072
Mn
−0.055
−0.185
−0.083
0.238
0.413
0.358
0.228
0.608
0.072
Ni
0.819
−0.336
−0.04
−0.105
−0.018
−0.021
0.037
0.076
−0.26
Cu
0.694
0.016
−0.134
−0.144
−0.09
−0.051
−0.054
0.135
0.212
Zn
−0.017
−0.095
0.104
−0.615
0.566
−0.061
−0.127
−0.204
0.13
As
0.555
−0.412
0.329
0.246
−0.024
−0.268
−0.016
−0.164
−0.308
Se
0.471
0.428
0.102
−0.058
−0.105
0.494
−0.118
−0.226
−0.035
Cd
0.009
−0.239
0.876
0.161
−0.192
−0.114
0.084
0.006
0.132
Sb
0.307
−0.698
0.226
0.346
−0.044
0.148
−0.184
−0.349
0.091
Ba
0.408
−0.634
−0.226
0.289
0.187
0.273
−0.028
0.064
0.214
Pb
−0.003
000
0.696
−0.126
−0.187
0.034
0.359
0.221
0.343
U
0.475
0.36
0.062
0.042
0.09
−0.311
−0.36
0.143
0.026
% of Variance
34.56
9.15
7.8
6.65
5.51
5.41
4.74
4.01
3.83
Cumulative %
34.56
43.7
51.51
58.16
63.67
69.09
73.83
77.84
81.67
4 Conclusions
In this work, several pollution indices, inverse distance weighted technique, and multivariate tools were applied to evaluate the suitability of groundwater in Harrat Khaybar for drinking and irrigation purposes, and determine the potential sources of contamination. The following were the findings:
1. Average concentrations of Cl–, SO42–, HCO3–, NO3–, Na+, Ca2+, Mg2+, and TDS were greater than the permissible limit for drinking water, and concentrations of Cr, Se, As, Zn, and Pb in some individual wells were greater than the permissible limits for these PTEs.
2. Overall, 35.29 % of the groundwater wells fell under the freshwater category and 64.71 % fell under the brackish to saline water category. The freshwater category includes all wells of the Ca-Mg-CO3-HCO3 and Na-K-CO3-HCO3 types, except one sample while most wells of the Ca-Mg-SO4-Cl and the Na-K-SO4-Cl types were of brackish to saline category.
3. GWQI indicated that 42.65 % of the wells fell under excellent and good water for drinking purposes, and 57.15 % fell under poor, very poor water, and unsuitable for drinking. MI results indicated that 51.47 % of the wells fell within very pure, pure, and slightly affected categories and 48.53 % fell under moderately affected, strongly affected, and seriously affected categories. The irrigation criterion revealed that more than half of the groundwater wells were suitable for irrigation.
4. The dissolution of rock forming minerals as well as, leakage of industrial, domestic, and agricultural wastewater, and the overuse of chemical fertilizers might be the main factors that control the geochemistry of groundwater and PTE pollution in some wells in the study area.
Funding
This research was funded by Abdullah Alrushaid Chair for Earth Science Remote Sensing Research, Geology and Geophysics Department, King Saud University, Saudi Arabia.
CRediT authorship contribution statement
Fahad Alshehri: Funding acquisition, Writing – review & editing, Data curation, Resources, Formal analysis, Validation, Conceptualization. Abdelbaset S. El-Sorogy: Supervision, Writing – review & editing, Writing – original draft, Investigation, Validation, Methodology, Conceptualization. Sattam Almadani: Project administration, Visualization, Validation, Software. Mufleh Aldossari: Writing – original draft, Resources, Investigation, Formal analysis.
Acknowledgments
The authors extend their appreciation to Abdullah Alrushaid Chair for Earth Science Remote Sensing Research for funding.
Declaration of Competing Interest
The authors declare that they have no known competing financial interests or personal relationships that could have appeared to influence the work reported in this paper.
References
- Evaluation of heavy metal contamination and groundwater quality along the Red Sea coast, southern Saudi Arabia. Mar. Pollut. Bull.. 2021;163:111975
- [Google Scholar]
- Hydrochemical and quality assessment of groundwater resources in Al-Madinah City, Western Saudi Arabia. Sustainability. 2020;12:3106.
- [CrossRef] [Google Scholar]
- Evaluation of groundwater quality in central Saudi Arabia using hydrogeochemical characteristics and pollution indices. Environ. Sci. Pollut. Res. 2021
- [CrossRef] [Google Scholar]
- Contamination and ecological risk of heavy metals in Al-Uqair coastal sediments, Saudi Arabia. Mar. Pollut. Bull.. 2021;171:112748
- [Google Scholar]
- Comprehensive review for groundwater contamination and remediation: occurrence, migration and adsorption modelling. Molecules. 2021;26:5913.
- [CrossRef] [Google Scholar]
- Assessment of heavy and trace metals in surface soil nearby an oil refinery, Saudi Arabia, using geoaccumulation and pollution indices. Arch. Environ. Contam. Toxicol.. 2018;2018(75):390-401.
- [Google Scholar]
- Groundwater resources exploration of Harrat Khaybar area, northwest Saudi Arabia, using electrical resistivity tomography. J. King Saud Univ. – Sci.. 2021;33:101468
- [Google Scholar]
- Mapping the distribution of shallow groundwater occurrences using remote sensing-based statistical modeling over southwest Saudi Arabia. Remote Sens. (Basel). 2020;12(9):1361.
- [Google Scholar]
- Influence of seawater intrusion and heavy metals contamination on groundwater quality, Red Sea coast, Saudi Arabia. Mar. Pollut. Bull.. 2021;165:112094
- [Google Scholar]
- An integrated approach for the identification of potential shallow groundwater zones in west-central Saudi Arabia. J. King Saud Univ. – Sci.. 2022;34:101915
- [Google Scholar]
- Application of multivariate statistical methods and inverse geochemical modeling for characterization of groundwater-a case study: Ain Azel plain (Algeria) Geoderma. 2010;159(3–4):390-398.
- [Google Scholar]
- Inorganic nitrite and nitrate: evidence to support consideration as dietary nutrients. Nutr. Res.. 2015;35:643-654.
- [Google Scholar]
- Quality of groundwater for irrigation in tropical karst environment: the case of Yucata’n, Mexico. Agric. Water Manag.. 2010;97:1423-1433.
- [Google Scholar]
- Introduction to Medical Geology. Focus on tropical environments: Springer-Verlag, Berlin Heidelberg; 2009. p. :297.
- Spring water assessment for quality and suitability for various uses: the case of Thuligaad watershed, western Nepal. Environmental Earth Sciences. 2021;80:586.
- [CrossRef] [Google Scholar]
- Groundwater. Englewood Cliffs, New Jersey: Prentice-Hall; 1979.
- Application of multivariate analysis to study water chemistry of groundwater in a semi-arid aquifer, Malayer, western Iran. Desalin. Water Treat.. 2010;19(1–3)
- [Google Scholar]
- Kemp, J., 1981. Geologic map of the Wadi al ‘Ays quadrangle, sheet 25 C, Kingdom of Saudi Arabia: Saudi Arabian Deputy Ministry for Mineral Resources Geologic Map GM-53, 39 p.
- Impact of rapid urbanization and tourism on the groundwater quality in Al Madinah city, Saudi Arabia: a monitoring and modeling approach. Arab. J. Geosci.. 2020;13:922.
- [Google Scholar]
- Assessment of surface water quality using water quality index and multivariate statistical analyses in Sarayduzu Dam Lake, Turkey. Environ. Monit. Assess.. 2019;191:71.
- [Google Scholar]
- Diverse mechanisms drive fluoride enrichment in groundwater in two neighboring sites in northern China. Environ. Pollut.. 2018;237:430-441.
- [Google Scholar]
- Hydrochemical appraisal of groundwater quality for drinking and irrigation purposes and the major influencing factors: a case study in and around Hua County, China. Arab. J. Geosci.. 2016;9:15.
- [Google Scholar]
- Spatial groundwater quality and potential health risks due to nitrate ingestion through drinking water: a case study in Yan’an City on the Loess Plateau of northwest China. Human Ecol. Risk Assess 2019
- [CrossRef] [Google Scholar]
- Groundwater quality studies in the Kingdom of Saudi Arabia: prevalent research and management dimensions. Water. 2021;13:1266.
- [Google Scholar]
- Hydrogeochemical evaluation, suitability, and health risk assessment of groundwater in the watershed of Godavari basin, Maharashtra, Central India. Environ. Sci. Pollut. Res.. 2021;28(15):18471-18494.
- [Google Scholar]
- Estimation of heavy metal in drinking water and development of heavy metal pollution index. J. Environ. Sci. Health. 1996;A31:283-289.
- [Google Scholar]
- Detailed water resources studies of the western coastal plain of Saudi Arabia. Ministry of Water and Electricity, Kingdom of Saudi Arabia: Unpublished report; 2015.
- Contamination and ecological risk assessment of heavy metals pollution from the Shalateen coastal sediments, Red Sea, Egypt. Mar. Pollut. Bull.. 2019;144:167-172.
- [Google Scholar]
- Geochemical and statistical evaluation of groundwater in Imphal and Thoubal district of Manipur. India. J. Asian Earth Sci.. 2012;48:136-149.
- [Google Scholar]
- Updated world map of the Köppen- Geiger climate classification. Hydrol. Earth Syst. Sci. disc.. 2007;4(2):439-473.
- [Google Scholar]
- Pint, J.J., 2006. Prospects for Lava-Cave Studies in Harrat Khaybar, Saudi Arabia. AMCS Bulletin 19 / SMES Boletín 7, 197-200.
- Chemical elements in the environment. Berlin: Springer; 1998.
- Rezaei, A., Hassani, H., Jabbari, N., 2017. Evaluation of groundwater quality and assessment of pollution indices for heavy metals in North of Isfahan Province, Iran. Sustain. Water Resour Manag DOI 10.1007/s40899-017-0209-1.
- Salifu, M., Aidoo, F., Hayford, M.S., Adomako, D., Asare, E., 2015. Evaluating the suitability of groundwater for irrigational purposes in some selected districts of the Upper West region of Ghana. Appl Water Sci DOI 10.1007/s13201-015-0277-z.
- Quality assessment of groundwater of Almadinah Almunawarah city. Global NEST J.. 2013;15(3):374-383.
- [Google Scholar]
- Analysis of wastewater of Jaipur city for agricultural use. Res. J. Chem. Environ.. 2006;10(1):30-33.
- [Google Scholar]
- Hydrological and hydrochemical studies of the groundwater aquifer of Harrat Khaybar area, north of Saudi Arabia. Int. J. Sci. Eng. Res.. 2016;7(7):2229-5518.
- [Google Scholar]
- Early indicators of pedogenesis at Harrat Khaybar volcano. Saudi Arabia. Geoderma. 2021;383:114743.
- [CrossRef] [Google Scholar]
- Influence of coastal groundwater salinization on the distribution and risks of heavy metals. Sci. Total Environ.. 2019;652:267-277.
- [Google Scholar]
- World Health Organization, WHO, 2011. Guidelines for drinking-water quality, Geneva, Switzerland
- World Health Organization, WHO, 2014. Guidelines for drinking-water quality, world health organization (3rd ed., Vol. 1, p. 515). Geneva, Recommendations
- World Health Organization, WHO, 2017. Guidelines for drinking-water quality: fourth edition incorporating the first addendum, Geneva. Licence: CC BY-NC-SA 3.0 IGO).
- Wu, J., Li, P., Wang, W., Ren, X., Wei, M., 2020. Statistical and multivariate statistical techniques to trace the sources and affecting factors of groundwater pollution in a rapidly growing city on the Chinese Loess Plateau. Human and Ecological Risk Assessment. 26 (6), 1603–1621.
- Identification of the long-term variations of groundwater and their governing factors based on hydrochemical and isotopic data in a river basin. J. Hydrol.. 2021;592:125604
- [Google Scholar]
- Identification of hydrogeochemical evolution using integrated multivariate statistical and geochemical methods and assessment of groundwater quality in the southwestern Ordos Basin, China. Environ. Sci. Pollut. Res.. 2021;29(2)
- [CrossRef] [Google Scholar]
Appendix A
Supplementary material
Supplementary data to this article can be found online at https://doi.org/10.1016/j.jksus.2023.102586.
Appendix A
Supplementary material
The following are the Supplementary data to this article:


