

Translate this page into:
Global trend assessment of land use and land cover changes: A systematic approach to future research development and planning
⁎Corresponding author at: Department of Geography and Environmental Science, University of Fort Hare, Alice 5700, Eastern Cape Province, South Africa. afuyeabayomi@gmail.com (Gbenga Abayomi Afuye)
-
Received: ,
Accepted: ,
This article was originally published by Elsevier and was migrated to Scientific Scholar after the change of Publisher.
Abstract
The diverse landscape of global land use and land cover (LULC) change studies were evaluated to uncover the current advances in data and future research potential through bibliometrics and the Preferred Reporting Items for Systematic Reviews and Meta-Analyses (PRISMA) approach. A total of 2710 published articles with the search phrase “Land use and Land cover change” OR “Land-use and Land cover change” OR “Land use/Land cover change” OR “Land use and Land cover changes” were retrieved using Scopus, Web of Science (WOS), and ScienceDirect databases from 1993 to 2022. The findings indicated a 24.37% annual growth rate in LULC change studies, reflecting a rapid overall increase in published articles. China and the USA emerged as the most influential countries regarding article numbers, total citations, and single-country publications. Ethiopia, Ghana, and South Africa, among the top 20 global rankings of the most influential countries in LULC change studies, underscore the global importance of this research. However, the disparity in research output between multiple-country publications and the dominant trend of single-country publications highlights a geographical bias in LULC change studies, particularly in the Global South. This finding underscores the need for a more balanced research approach and can stimulate further investigation. The results also revealed that remote sensing, a rapidly growing field utilising advanced computing techniques, is the most prevalent keyword and has significant applications in reducing land degradation. These findings can significantly enhance research, climate policy programs, land management, and forest ecology planning, which are crucial in the face of the growing demand for agriculture and habitable land.
Keywords
Bibliometrics
Land use
Land cover changes
PRISMA
Remote sensing

1 Introduction
Estimating the anticipated loss due to vegetation ecology and forest biodiversity is pivotal in determining global land use and cover dynamics (Afuye et al., 2021a; Duan et al., 2023). Incorporating land use and land cover (LULC) change into urban development strategies and resource planning is essential for ensuring sustainable human settlement areas. LULC plays a multifaceted role in water conservation, erosion control, and the accretion process, and it regulates the availability of sediments to coastal landforms (da Cunha et al., 2022; Nath et al., 2023). The threats posed by LULC changes to global biodiversity loss, increase in soil erosion, and distress in hydrological cycles (Nguyen et al., 2023) demand immediate attention. The environmental change dynamics of global climate change are a growing concern for policymaking and development planning at the local and sub-national levels (Lee et al., 2022). Changes in LULC modify the biogeochemical and earth’s energy balance cycles, leading to changing climate, ecosystem services, and land surface properties. Globally, 62 % of land areas have transformed significantly from naturally vegetated areas to the growing proportion of land use changes to croplands and urban and built-up areas (Afuye et al., 2022; Mpanyaro et al., 2024). The frequency and intensity of disturbances can vary, impacting various environmental components and causing changes in LULC, affecting deforestation, food security, and ecosystem service functions (Ambarwulan et al., 2023).
Several studies revealed the influential factors affecting LULC changes including logging and fires, demographic pressure, infrastructural development, poor drainage, and rapid urbanisation (Selwood et al., 2015; da Cunha et al., 2022; Shehu et al., 2023). Other factors include forest transformations to other lands, alteration of wetlands, soil degradation in croplands, and changes in the productivity of pastoral lands (Sahide & Giessen, 2015; Bhattacharya et al., 2020; Fenetahun et al., 2020). Disaster-prone regions require pre- and post-disaster scenarios to map forest degradation and susceptible areas, buffering high-risk zones, and plan LULC (Aboelnour & Engel, 2018). This is crucial for risk forecasting and determining the loss amount for each LULC type, like forest cover. Satellite imagery, topographic maps, and local terrain characteristics are used to evaluate and assess the accuracy of LULC change detection in disaster management activities (Rashidiyan & Rahimzadegan, 2024). The United Nations (UN) and Food and Agriculture Organization (FAO) report that global land use change, primarily affecting arable land for agriculture, accounts for 37.6 % of the Earth’s surface area and is one of the largest human environmental impacts (FAO, 2016). The observed changes are attributed to human activities such as agriculture, urban land use, and arboriculture, which affect conservation and ecosystem services (Kanianska, 2016). The international intervention frameworks including the Intergovernmental Panel on Climate Change (IPCC), Paris Agreement and Sustainable Development Goals (SDGs), are robust international frameworks that effectively incorporate measures into policies and planning (United Nations, 2017; IPCC, 2022b). These frameworks ensure sustainable land use, promoting climate change and sustainable development. The mitigation potential of land use and land cover changes, particularly in forests and agriculture, is crucial for achieving climate targets in the Paris Agreement forum, emphasising land use. Evaluating trends on LULC change and direction for future research and development planning is critical in supporting these debates. Evaluating trends in LULC change and the direction for future research and development planning is crucial for supporting these debates.
Trend mapping and data advances in LULC change studies depend heavily on the fundamentals of global scientific research history shown by bibliometrics. Bibliometrics was used to evaluate research developments and scientific publication collaboration networks broadly applied in different niche areas (Xie et al., 2020; Nduku et al., 2021). The study comprehensively evaluated LULC changes to identify evolutionary trends and potential areas for future research development and planning. Understanding the dynamic trend of land transition and advances in data in LULC is crucial given the prominence of natural and human disturbances. As such, areas conducting a systematic mapping that provides the evolutionary trends of dominant themes fundamental to contributing to the intellectual domain of land use/ land cover niche areas becomes imperative. Hence, this review study evaluated published documents on LULC change, highlighting their contribution to data advancements and potential for future research development using bibliometrics and the PRISMA approach. These results serve as an important baseline on the knowledge akin to ecological restoration strategies on LULC change and ultimately inform decision-making.
2 Data identification and methodology
2.1 Bibliometric data processing and PRISMA approach
Scopus, ScienceDirect, and WOS databases were utilised to generate bibliometric data from 1993 to 2022. Similar studies have widely used multiple databases for systematic review and bibliometric analysis (Afuye et al., 2021b; Macarringue et al., 2022). This study adopted the PRISMA technique to comprehensively review LULC change studies (Velastegui-Montoya et al., 2022). The search key terms “Land use and Land cover change” OR “Land-use and Land cover change” OR “Land use/Land cover change” OR “Land use and Land cover changes” were used to retrieve all open access and English-written published documents within a niche area. Data screening, cleaning, and processing were applied to remove duplicates and irrelevant documents, reducing the vocabulary dimension (Nduku et al., 2021). The data screening involves skimming and scanning documents using search key terms, including article titles, abstracts, and keywords. It removes irrelevant documents and ensures that the final count of published papers in an Excel spreadsheet matches the search terms. This process helps clean and process irrelevant documents and ensure the final count’s accuracy. The PRISMA tool, Zotero (v6.0.7), RStudio (v4.2.3) and Biblioshiny software were used to filter non-informative words and collate all retrieved published documents (Aria et al., 2022). Open-source environment tools like PRISMA, Zotero, and RStudio provide an easy-to-use comprehensive platform for bibliometric data (Aria et al., 2022). PRISMA offers an overview guide to selecting documents from databases to the point of compilation for analysis. R Studio open-source packages, biblioshiny, and RStudio software facilitate script creation, merging multiple datasets, and removing duplicates. Zotero allows for validation before analysis and visualisation of the entire document collection of bibliometric data.
The study analysed 2710 published articles using bibliometric tools and a web interface to evaluate annual scientific production growth trends, global scientific contributions per article, and citation density. The PRISMA stages were chronological, starting with finding published articles using search keywords. Data screening was performed to identify eligible articles, followed by data processing to merge retrieved articles from Scopus, ScienceDirect, and WOS databases. Data cleansing was performed to remove duplicates and prepare documents for analysis. The density visualisation map of the top author's keyword terms was created using VOSviewer (v1.6.20) and the Research Information Systems (RIS) file format for bibliometric data. The minimum number of keyword occurrences was randomly selected at 50 to achieve high-frequency keywords in LULC change studies. The study measured the average growth rate (AGR), the actual difference between previous and current years, and the number of publications in annual scientific production growth (Ruiz-Rosero et al., 2019) using equations (1) and (2). The citation analysis was retrieved through a built-in formula on the R package repository with the following equation (3). A density visualisation map for top authors' keywords was generated on VOSviewer software.
Formula description:
is a document
cited reference matrix
and
is a non-negative and symmetrical matrix. The PRISMA approach below was used for document selection criteria as shown in Fig. 1.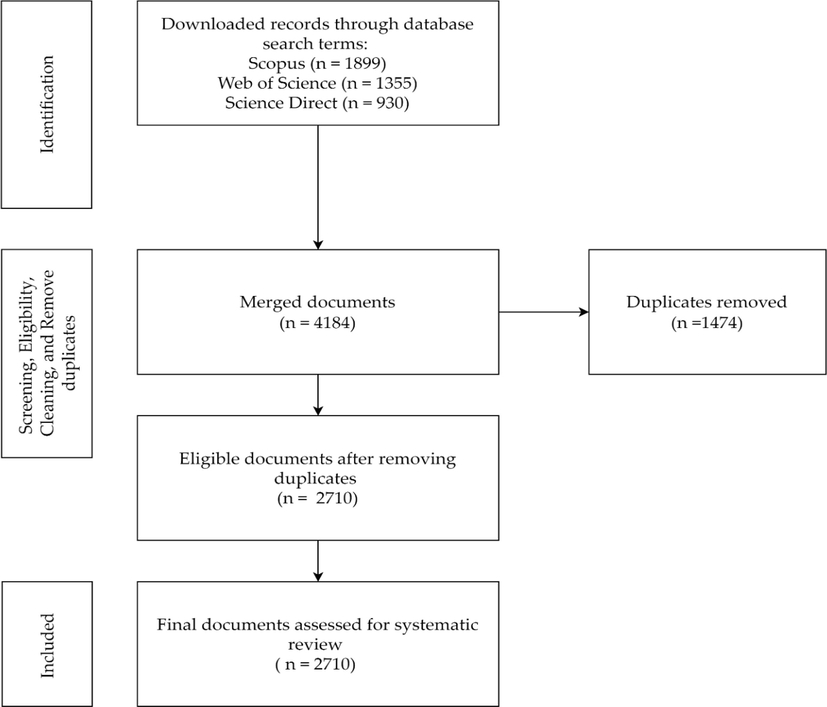
The PRISMA flowchart for document selection criteria.
3 Results
3.1 Scopus, ScienceDirect and WOS extracted bibliometric information
The study analysed 2710 LULC studies from Scopus, ScienceDirect, and WOS databases during the survey period, as shown in Table 1. The bibliometric analysis revealed 1736 articles, 148 proceeding papers, 70 reviews, 16 book chapters, 740 other document types, and 834 sources of journals and books. During the study period, 9999 authors and 4.9 co-authors contributed to strengthening scientific research publication developments on LULC changes. International co-authorships and single-authored documents contributed 1.73 % and 101 authors to published documents in LULC change studies. Between 1993 and 2022, global research on LULC experienced an average annual growth rate of 43.51 %, indicating increased attention to monitoring change detection in recent decades.
Description
Results
Scopus, ScienceDirect, WOS
3
Timespan
1993–2022
Documents
2710
Journals and Books (Sources)
598
Keywords Plus (ID)
8147
Author’s Keywords (DE)
4528
Average citations per document
43.51
Authors
9999
Single-authored documents
101
Co-Authors per Documents
4.99
International co-authorships (%)
1.73
Document Type
Article
1736
Proceedings Paper
148
Review
70
Book Chapter
16
Others (data paper, early access)
740
3.2 Annual scientific trend dynamics on land use and land cover change studies
Fig. 2 shows an annual scientific trend on LULC change studies, with an annual scientific production growth rate of 24.37 %. This indicates consistent global advancement in research outputs, as recorded in published documents. Between 1993 and 2009, there was a low progression in published research output. However, an exponential trend began in 2010, peaking in 2022, indicating more detailed advances in LULC change research. The study reveals significant exponential growth in LULC change studies from 2019 to 2022, aligning with Price law in bibliometric analysis (Price, 1976). This growth is attributed to the high demand for agricultural and habitable land use between 2021 and 2022, with 2022 recording the highest number of publications in this field. The United Nations Environment Programme (UNEP) is working towards sustainable management and restoration of Sustainable Development Goals (SDG15): Life on Land, aiming to ensure the benefits of land-based ecosystems, including sustainable livelihoods for generations (UNEP, 2020). SDG 15 aims to prevent desertification, enhance sustainable practices, reverse biodiversity loss, and manage forest resources effectively to prevent land degradation and biodiversity loss (UNEP, 2020). The research on LULC change studies has gained global attention, contributing to a temporal trend in scholarly output since 2000 (y = 13.078e26.164x), as shown in Fig. 2.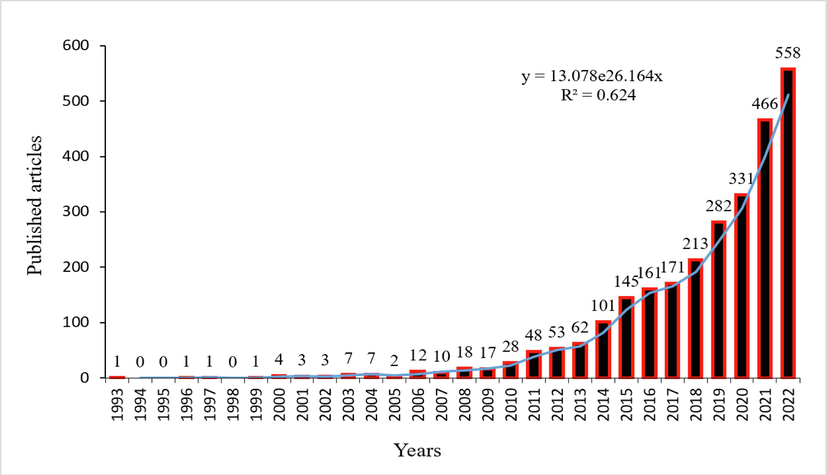
Annual scientific production growth trend from 1993 to 2022.
3.3 Global scientific contributions per article and citation
The research on LULC changes was strengthened by article publications and citations from single and multiple countries as shown in Table 2. China was the most influential country (N = 433), followed by the USA (N = 273) and India (N = 120). The total number of publications, total citations, average article citations, single-country publications (SCP), and multiple-country publications (MCP) varied across countries. The USA (TC = 12153 AAC = 44.50) accounted for the most total citations during the survey period, followed by China (TC = 8628; AAC = 19.90) and Germany (TC = 8628; AAC = 19.90). These countries significantly contributed to SCP and MCP articles in single and joint-authored articles. The results indicate that developed countries, such as Brazil, Indonesia, and Ethiopia, made significant contributions to publications and citations compared to developing nations. The study revealed significant disparities in multiple-country publications in developing nations, primarily due to language barriers, research grants, and autonomous research (Huang et al., 2016). The research field of LULC change is driven by factors such as intra-country contribution and low inter-country international co-authorships, which have a significant effect. The significant effect of the intra-country contribution and low inter-country international co-authorships of 1.73 % were driving factors of LULC change research field. During the survey period, the study revealed that the lack of research grants significantly impacted the collaboration and productivity of researchers across different countries. Total number of publications (N), Total scientific production (TSP), Total citations (TC), Average article citations (ACC), Single-country publication (SCP), and Multiple-country publication (MCP).
Ranking
Country
N
TSP (%)
TC
AAC
SCP
MCP
1
China
433
15.98
8628
19.90
425
8
2
USA
273
10.07
12,153
44.50
269
4
3
India
120
4.43
2517
21
120
0
4
Germany
97
3.58
3442
35.50
90
7
5
Ethiopia
76
2.80
1301
17.10
76
0
6
Brazil
56
2.07
911
16.30
51
5
7
Indonesia
43
1.59
210
4.90
42
1
8
United Kingdom
34
1.25
619
18.20
32
2
9
Canada
30
1.11
747
24.90
28
2
10
France
30
1.11
1103
36.80
29
1
11
Japan
27
0.99
618
22.90
25
2
12
Spain
26
0.96
757
29.10
26
0
13
Malaysia
24
0.89
439
18.30
24
0
14
Italy
23
0.85
549
23.90
23
0
15
Turkey
23
0.85
326
14.20
23
0
16
Ghana
22
0.81
233
10.60
22
0
17
South Africa
21
0.78
310
14.80
19
2
18
Switzerland
21
0.78
593
28.20
19
2
19
Netherlands
20
0.74
1045
52.20
19
1
20
Australia
19
0.70
754
39.70
19
0
3.4 Institutional affiliation contributions
Fig. 3 shows the top 20 contributions per document publications of affiliated institutions in LULC studies. The University of Chinese Academy of Sciences was the most predominant institution, followed by the Institute of Geographic Sciences and Natural Resources Research and Beijing Normal University (n = 73 articles, 2.69 %), (n = 55, 2.03 %) and (n = 49, 1.81 %) published studies respectively. Chinese-affiliated institutions hold the top ranking in publications in scientific studies related to LULC, demonstrating their significant position in the field. Addis Ababa University in Ethiopia ranks fourth among the developing nation’s top 20 affiliations per document, with (n = 23, 1.55 %) publications. Unlike other developed nations, Ethiopia’s exceptional research output suggests that autonomous research funding strengthened its capacity (Fedderke & Goldschmidt, 2015). The study indicates that advancements in research on LULC may have increased the productivity of this field over the study period.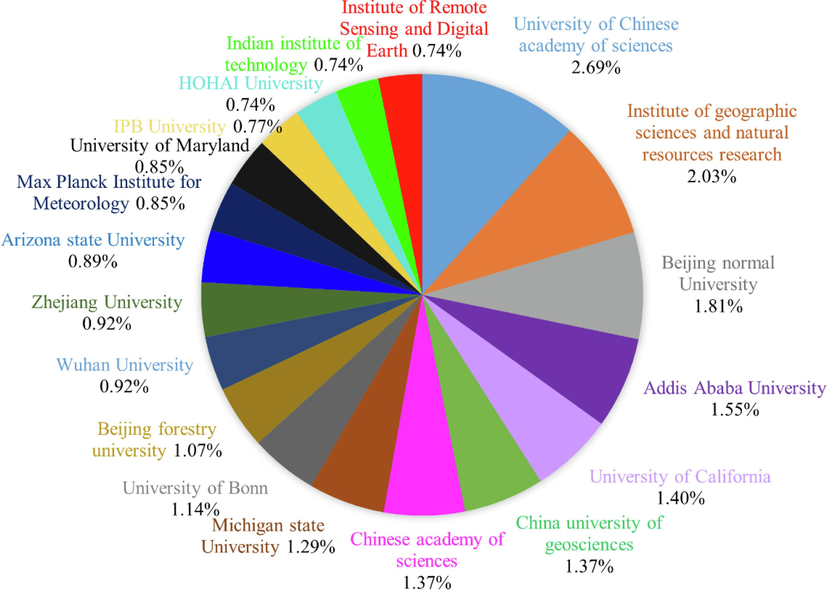
Top 20 institutional affiliations per document publications on LULC change studies.
3.5 Land use and land cover change author's keywords
Table 3 shows the top-ranking author’s keywords (DE) and keywords plus (ID) in the LULC change research field, with 4499 and 8051 calculated based on occurrences and percentages. The list of the top 20 selected author keywords and keywords included approximately 12 common author keywords. “Remote sensing,” “GIS,” “Landsat,” “urbanisation,” “deforestation,” and “agriculture” are critical factors in understanding land use and land cover change, which influences “climate change.” It is worth noting that “remote sensing,” “climate change,” and “land use” were found among the top five authors’ keywords as well as in the keywords plus section. The results show that “remote sensing” (n = 235) ranked highest with most authors’ keywords (DE), while “land use” (n = 935) ranked first with most authors’ keywords plus (ID). Research on LULC change frequently recognises climate change challenges and emphasises the impact of these factors and LULC change responses on the process. The study highlights the impact of both natural and human-made factors on land cover, which can lead to irreversible loss and environmental changes. The interaction between land use patterns and climate change influences the structure of forests, grasslands, and ecosystems (Mndela et al., 2023). The keywords analysis revealed climate change as the third most frequently used term in authors’ keywords (2.9 %) and the fifth most frequently used term (5.8 %) in keywords plus. The study reveals that remote sensing is the primary term for analysing climate change and land use impacts on LULC change studies. Other factors of the author’s keywords (DE) include deforestation, urbanisation, land surface temperatures, and agriculture with low frequency, suggesting more research development in LULC change studies. The study revealed that the keywords plus (ID) were more frequently used than the authors’ (DE) in the survey.
Rank
Author’s keywords (DE)
Frequency
(%)
Rank
Keyword-Plus
(ID)
Frequency
(%)
1
Remote sensing
235 (5.2)
1
Land use
935 (11.6)
2
Land use and land cover change
146 (3.3)
2
Land cover
758 (9.4)
3
Climate change
132 (2.9)
3
Land use change
682 (8.5)
4
GIS
112 (2.5)
4
Remote sensing
481 (5.9)
4
Land use
112 (2.5)
5
Climate change
474 (5.8)
5
Land use/land cover change
91 (2.0)
6
Land use and land cover change
286 (3.5)
6
Landsat
89 (1.9)
7
China
264 (3.2)
7
Land use change
79 (1.8)
8
Deforestation
215 (2.7)
8
Change detection
73 (1.6)
9
Urbanization
196 (2.4)
9
Urbanization
72 (1.6)
10
Satellite imagery
186 (2.3)
10
Deforestation
71 (1.5)
11
Agriculture
183 (2.2)
11
Land cover
69 (1.5)
12
Landsat
176 (2.1)
12
LULC
51 (1.1)
13
Forestry
166 (2.0)
13
Ecosystems services
50 (1.1)
14
Spatiotemporal analysis
148 (1.8)
14
Lands surface temperatures
45 (1.0)
15
Land use/land cover change
140 (1.7)
15
NDVI
44 (0.9)
16
GIS
136 (1.6)
16
Land cover change
40 (0.8)
17
Vegetation
134 (1.6)
17
Agriculture
34 (0.7)
18
Agricultural land
129 (1.6)
18
China
29 (0.6)
19
runoff
119 (1.4)
19
Urban growth
27 (0.6)
20
Biodiversity
117 (1.4)
3.6 Density visualization map of highest-ranking author’s keywords in LULC change dynamics
Fig. 4 shows the density visualisation map of the top 20 authors’ keywords frequently used in LULC change studies, highlighting their scientific contributions to research outputs. Zipf’s law was used to rank frequent authors’ keywords based on research subjects, directions, and niche trends, utilising the principle of the least effort to determine the highest occurrence of the lowest-frequency word (Madrid-Casaca et al., 2021). The predominant author's keywords displayed higher density (light yellow colour), while less frequently used authors' keywords showed lower density (dark purple colour). Moreover, the author’s keywords such as “remote sensing,” “land use and land cover change,” “climate change,” “urbanisation,” “Modis,” and “NDVI” significantly influence the field. Other significant variables like soil erosion, urban sprawl, population, evapotranspiration, cropland, forest transition, runoff, afforestation, and land management had a lower density of keywords. Satellite remote sensing applications are crucial in estimating and detecting land use/land cover changes using multitemporal Modis NDVI data in response to climate change and urban sprawl.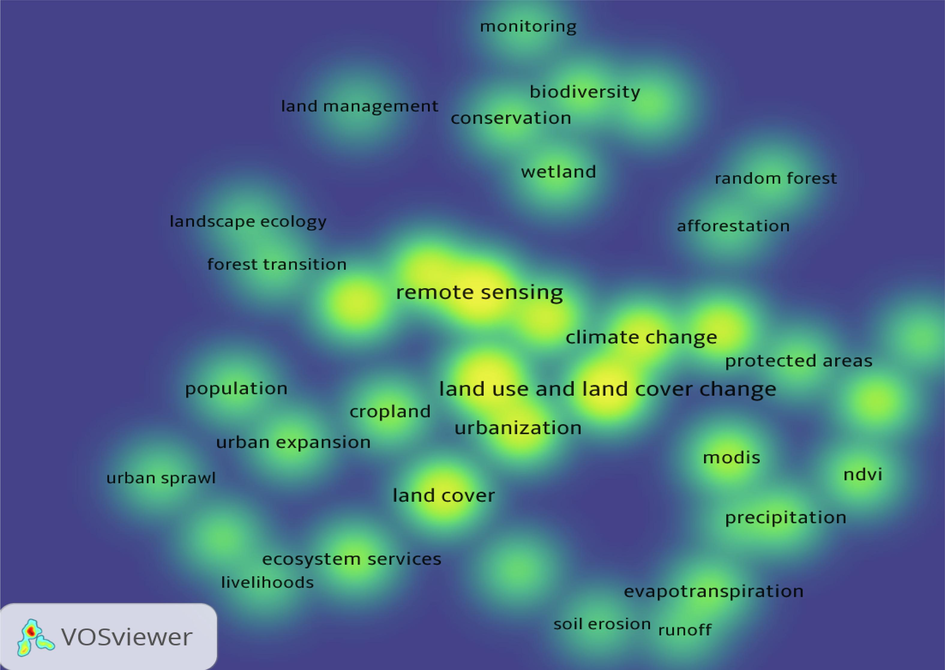
Density visualization map of top author’s keywords co-occurrence.
3.7 Top global cited published documents on LULC change research development
Table 4 presents the most cited international studies on LULC changes, outlining data sources, techniques, and findings for each case study within the research development scope. Most top-cited studies utilise Landsat thematic mapper (TM), consisting of Landsat 4 and 5, with seven spectral bands ranging from 30 to 120 m resolution (Hong et al., 2011; Nurwanda et al., 2016). Studies indicate that maximum likelihood supervised classification outperforms unsupervised classification in accurately predicting LULC change (Kaur et al., 2013; Alloghani et al., 2020). The findings show that supervised classification techniques like maximum likelihood are commonly used to monitor and map land use and cover changes. Climate change, land surface temperature, urbanisation, human-induced degradation, and socioeconomic developments contribute to the long-term dynamics of land use and land cover (Salleh et al., 2013; Purwanto and Kurniawan, 2016). Intervention strategies, such as expanding urban green spaces and creating buffer zones around protected areas, aim to mitigate the severe impacts of land use and land cover changes (Buyadi et al., 2013). Policy decision-making and interventions supporting advanced remote sensing technologies are limited to LULC change research in the Global South (Qingqing et al., 2012; Dlamini et al., 2021). Recent environmental policy interventions are expected to advance, with cited articles in remotely sensed data in LULC changing research trends for future development and mitigation of land degradation (Table 4).
S/N
Data Sources
Methods
Findings/ Research gaps
Year of Total Citation
References
1.
Landsat 7 ETM+,
Landsat 8 OLI/TIRSSupervised classification
Findings show that increasing temperatures are the driving factor of LULC changes in the Malang city study area.
2015
Purwanto and Kurniawan, 2016
2.
Land use map products of Surabaya-Sidoarjo areas
Interviews and images
The results show that the identification of a co-existing dividing line (CDL) is necessary to control the rapid urban project-based housing and homeowner-based housing development for urban land use zoning.
2015
Tutuko & Shen, 2016
3.
Landsat TM, Landsat 7 ETM+
Supervised classification method
The findings showed that the multi-temporal Landsat satellite imagery and digital change detection provide a long temporal scale and feasible tools to understand landscape planning characteristics and patterns of land cover changes.
2015
Nurwanda et al., 2016
4.
Landsat TM images
Classified normalized difference vegetation index (NDVI) using the natural breaks (Jenks) method
Findings revealed long period NDVI maps showed capabilities to indicate land cover changes over time, highlighting the necessity for protection and revegetation of the degraded vegetated areas during urban and economic development.
2015
Aburas et al., 2015
5.
Landsat TM data
LST extraction, Normalized Difference Built-up Index (NDBI), NDVI maps
Findings show that urbanisation (Land use/land cover, LST) and Sea level are contributing factors to the rise and formation of urban heat Islands.
2013
Salleh et al., 2013
6.
Landsat 5 TM
LST and NDVI maps
The findings reveal that the growth of green spaces in urban areas helps to mitigate the effects of urban heat islands and improve the quality of life for urban residents.
2013
Buyadi et al., 2013
7.
ResourceSat-1 (IRS-P6) and Indian Remote Sensing data (IRS-1D)
Supervised classification
The results show that the integration of spatial patterns for major soil and climate parameters into homogeneous agroecological plans improves the sustainability of agricultural land use/cover to ensure yields.
2013
Kaur et al., 2013
8.
Landsat TM optical images
Maximum likelihood algorithm
Findings revealed that the generation of buffer zones using satellite imagery provides a powerful tool for mapping land use activities in protected areas (PAs), which aids in interventions for better management and prevention of the PAs from neighbouring harmful activities.
2012
Ahmad et al., 2012
9.
Landsat MSS, Landsat TM images
Supervised classification and interviews
The findings quantified the interaction of natural environmental changes; social and economic factors contribute to the changes in land use and land cover. Additionally, it is necessary to consider both factors in sustainable development interventions.
2011
Qingqing et al., 2012
10.
Landsat TM and ETM+
Supervised classification and interviews
The results show that human-induced land degradation and urbanization are driving factors for land transformations that affect LULC changes.
2011
Alfiky et al., 2012
11.
Landsat 5 TM
LST, object-based classification
The findings validate Landsat satellite image prospects on the surface heat environment and land use change quantification with LST, which correlate positively with impervious surfaces and negatively with vegetated areas.
2011
Lv and Zhou, 2011
12.
Argentina National Meteorological Service, National Institute of Agricultural Technology in Argentina for the soil productivity, digital elevation model (DEM), and Shuttle Radar Topography Mission (SRTM)
Dynamic land cover simulation model (Dyna-CLUE)
Findings revealed that the Dyna-CLUE spatial simulation model demonstrated satisfactory results of land cover dynamics in different crops, and it can be used to predict anticipated trajectories of land cover changes using current trends to help with sustainable land use planning.
2011
Lourdes et al., 2011
13.
Landsat TM and ASTER images
Supervised classification
The findings show that simultaneously disturbances of both natural and human factors contribute to the witnessed temporal changes in land use characteristics.
2011
Zhang et al., 2011
14.
Landsat-5 TM
Markov model estimation
The findings reveal the feasibility of the Markov model in estimating anticipated increases and decreases in LULC dynamics.
2011
Hong et al., 2011
15.
Advanced Visible and Near Infrared Radiometer type 2 (AVNIR-2), Landsat TM, Field survey, Land use map from FMS DENR – CAR, Philippines
Maximum Likelihood supervised classification
The findings revealed that integrating multiple remote sensing satellite images from this study showed their applicability and effectiveness for monitoring spatiotemporal patterns of LULC changes using the geographic information systems platform.
2011
Estoque and Murayama, 2011
16.
Landsat TM and ETM+
Maximum likelihood classification
The results show that acquired atmospheric images contribute to the classification errors and relatively low accuracy for land use change, which can be improved through using post-classification detection. Post-classification is a heavy workload that requires high classification accuracy.
2011
Shen et al., 2011
17.
NLCD 2001 Land Cover product, Landsat 5 TM images
Maximum likelihood classification algorithm
Findings demonstrate that classifying images into area-class maps using different reference data shows the existence of large impacts of semantic bias. Other, studies should focus on the effect of bias in the reference data to reduce uncertainty and produce more accurate, and quality classification assessments
2011
You & Zhang, 2011
18.
Structured interviews, Orthographic photographs, and vector maps
Landscape metrics
The study shows the feasibility of the landscape metrics method for identifying potential urban green space expansion areas using a suitability checklist and proximity buffering with the help of GIS. This information is useful in site analysis during planning for new development infrastructure
2011
M’Ikiugu et al., 2012
19.
Quickbird data
Supervised classification
Findings demonstrate the ability of high-resolution remote sensing satellite images from Quickbird to be suitable for spatial–temporal monitoring of LULC change. More so, key factors of LULC changes include population growth and economic development.
2011
Erener et al., 2012
20.
Scanned land-use maps of Yongshou with 1:50000 resolutions
Landscape diversity index, Landscape dominance index, Landscape evenness index
The results show that the transfer matrix of the landscape including the landscape diversity index, landscape dominance index, and landscape evenness index depict temporal and spatial analyses of land use dynamics, which explain the increasing and decreasing trends witnessed on different land covers over time.
2011
Lubo et al., 2011
4 Discussion
The study evaluated global research history and current data advancements to identify potential future research developments and planning in the LULC change field. The reviewed publications were indexed in databases such as ScienceDirect, the WOS, and Scopus from 1993 to 2022. The study utilises bibliometrics and the PRISMA method to analyse the LULC change research field, examining trends, institutional contributions, author keywords, and top global cited articles. The review of studies on land use and land cover changes revealed an annual growth rate of 24.37 % per article, indicating a significant trend in global research. This may be attributed to increasing population demands and climate change affecting land use developments (Wu et al., 2021). The study on land use and land cover change revealed an unstable field with inconsistent growth per article. China and the USA were the most influential countries, with more published articles, citations, and collaborative publications. The study suggests limited research in developing countries, especially in the Global South, and advocates for increased funding and independent research to enhance land use/land cover change studies (Fedderke & Goldschmidt, 2015). China, a developing country, has experienced significant land use changes due to rapid urbanisation (Ning et al., 2018), ranking first in publication output. Top Chinese institutions contributed substantially to scientific publications in land use and land cover (LULC) studies. Meanwhile, the USA ranked second in publication output, utilising advanced technological innovations to assess complex land use planning through decision-support systems (Lv et al., 2021). For example, the USA Smart City is a prime example of advanced technology demonstrating significant progress in research and development in land use/land cover change. Consequently, the dominant trend of influential nations per article and citations in single-country publications (SCP) negatively impacts research productivity and scientific openness. The study revealed low international co-authorships in countries like Spain, India, Indonesia, Malaysia, Ethiopia, Ghana, and South Africa, along with lower research output on LULC change studies. Ethiopia ranks among the top 20 African countries in LULC change studies, with numerous publications and citations per country status. Addis Ababa University in Ethiopia ranked fourth among institutions, with 23 publications accounting for 1.55 % of the country’s total. This issue is attributed to the lack of geographical research coverage in African countries. To boost research in the LULC change field, collaboration between single-country publications in China, the USA, Germany, and Brazil and multiple-country publications (MCP), including authors from diverse ethnic groups, is crucial.
The study identified vital themes influencing changes in LULC, such as climate change, urbanisation, cropland, soil erosion, urban expansion, runoff, evapotranspiration, and afforestation. Future research directions include incorporating remote sensing applications into socio-environmentally oriented research and planning programs for land management, biodiversity conservation, and forest ecology. The sparsely quantified keyword terms identified in this study present a unique opportunity to assess the environmental impacts of land use changes, which are essential for informing future planning and management interventions. The top 20 globally cited documents reveal limitations in the application of recent high-resolution satellite sensors, including the European Space Agency (ESA) Sentinel missions. The results from the top 20 globally cited documents revealed the limitations in the application of recent high-resolution satellite sensors, such as European Space Agency (ESA) Sentinel missions, among others. Moreover, the advancements in Sentinel data have demonstrated its potential to enhance the mapping of LULC changes (Nasiri et al., 2022). Sentinel, launched in 2014, initially lacked long-term historical records compared to the Landsat series, which offers better coverage and a longer lifespan (Nasiri et al., 2022). Hence, the empirical evidence supporting the contributions of Earth observation satellites like the Sentinel missions has received limited attention (Steinhausen et al., 2018; Nasiri et al., 2022). The reviewed studies identified current research hotspots and dominant themes based on time-varying trends in LULC changes observed during the study period. The study evaluated its diverse range, significantly influencing current and future research development, planning, and filling a literature gap.
4.1 Limitation and future research prospects on land use and land cover changes
This study’s limitations include its focus on 1993–2022, which restricts its applicability to a broader context and other LULC change domains. The three databases used were chosen due to the early attention paid to LULC change studies in 1993, making it challenging to generate comprehensive datasets. The analysis was condensed to focus on significant research on LULC changes to accommodate the niche area. This suggests that further research using additional databases can help quantify the potential improvements and developments in understanding the relationship between external and internal factors influencing change dynamics. Further analysis is needed to understand the full implications of anthropogenic land use and carbon storage. This will aid in monitoring substantial investments in sustainable land management practices through national and global statistical infrastructure. The study suggests integrating remote sensing-based models like the future land use simulation (FLUS), the Land Change Modeler (LCM), the Cellular Automata-Markov Chain (CA-MC) model, and patch-generating land use simulation (PLUS) to predict future LULC changes. Modelling the effects of land use and land cover changes will provide a robust assessment of spatiotemporal characteristics, trends, drivers, and future predictions.
5 Conclusion
The study evaluated the scientific research history and current data advancements to identify potential areas for future development and planning of LULC change studies from 1993 to 2022. The study reveals research hotspots and central themes in the evolution of land use and land cover change. The reviewed articles highlight “remote sensing” as the primary research theme in LULC and the most commonly used method for creating physical, theoretical, or computer-based models to study land use/land cover change. The keyword terms indicate that maximum likelihood classification is the primary method to address the environmental impacts of land use/land cover changes in the field. The dynamic trends of the top author’s keywords and associated influences on land use/ land cover change may be expressed in four evolutionary paths. These include remotely sensed data monitoring and informed decisions on degraded lands, restoration policy enhancement, and advanced, cutting-edge research in developing nations. The study suggests that developing nations can combat environmental degradation by promoting afforestation, conservation, and climate policy programs and reducing their carbon footprint.
The findings of this study serve as a basis for future research development on land use and land cover change planning initiatives. The study recommends incorporating additional academic databases to enhance research in underrepresented global South regions, thereby addressing geographical research bias. Future research should utilise physical-based models, such as artificial intelligence, deep learning, regression, computational, Google Earth Engine, and machine learning algorithms, to monitor and predict global land use and land cover changes. Industrialised nations have significantly contributed to land use change via agricultural intensification, urbanisation, deforestation, and energy systems, leading to extensive scientific research on LULC changes. In contrast, developing countries have implemented measures for soil conservation and planning initiatives, including adopting nature-based solutions (NBS). NBS is crucial for reducing and reversing the loss of nature and land use changes, addressing global biodiversity loss, and preserving urban green infrastructure. However, in developing nations, little attention is given to the consequences of climate change-related trends in land use change, population expansion, and the conversion of wetlands into arable land and pasture. These changes affect weather and climate, contributing to biodiversity decline. The findings reveal the global research history and current advances in data on LULC change dynamics, increasing our knowledge of landscape restoration strategies. This study contributes to reducing the negative impacts of LULC changes, achieving the planet’s SDGs and IPCC goals, and promoting green area expansion.
CRediT authorship contribution statement
Gbenga Abayomi Afuye: Conceptualization, Data curation, Formal analysis, Funding acquisition, Investigation, Methodology, Software, Writing – original draft. Lwandile Nduku: Conceptualization, Data curation, Methodology, Software, Writing – original draft. Ahmed Mukalazi Kalumba: Conceptualization, Data curation, Methodology, Project administration, Supervision, Writing – review & editing. Celso Augusto Guimarães Santos: Data curation, Investigation, Software, Validation, Visualization, Writing – review & editing. Israel Ropo Orimoloye: Conceptualization, Methodology, Validation, Visualization, Writing – review & editing. Vincent Nduka Ojeh: Conceptualization, Data curation, Software, Validation, Visualization, Writing – review & editing. Kgabo Humphrey Thamaga: Conceptualization, Data curation, Methodology, Validation, Visualization, Writing – review & editing. Phila Sibandze: Conceptualization, Data curation, Software, Validation, Visualization, Writing – review & editing.
Acknowledgements
All thanks to the Govan Mbeki Research Development Center (GMRDC), University of Fort Hare, South Africa, for their support and for creating an enabling environment for research and to the anonymous reviewers for their wonderful insights that strengthened this paper.
Declaration of Competing Interest
All authors declare they have no known competing financial interests or personal relationships that could have appeared to influence the work reported in this paper.
References
- Application of remote sensing techniques and Geographic information systems to analyse land surface temperature in response to land use/land cover change in Greater Cairo Region, Egypt. J. Geogr. Inf. Syst.. 2018;10(1):57-88.
- [Google Scholar]
- Measuring land cover change in Seremban, Malaysia using NDVI index. Proc. Environ. Sci.. 2015;30:238-243.
- [Google Scholar]
- Characterisation of vegetation response to climate change: a review. Sustainability. 2021;13(13):7265.
- [Google Scholar]
- A bibliometric Review of vegetation response to climate change. Environ. Sci. Pollut. Res.. 2021;29(13):18578-18590.
- [Google Scholar]
- Long-term dynamics and response to climate change of different vegetation types using GIMMS NDVI3g data over amathole district in South Africa. Atmos.. 2022;13(4):620.
- [Google Scholar]
- Community activities around protected areas and the impacts on the environment at Krau Wildlife Reserve, Malaysia. Proc. Soc. Behav. Sci.. 2012;68:383-394.
- [Google Scholar]
- Agricultural fragmentation of the Nile Delta; a modelling approach to measuring agricultural land deterioration in Egyptian Nile Delta. Proc. Environ. Sci.. 2012;14:79-97.
- [Google Scholar]
- A systematic review on supervised and unsupervised machine learning algorithms for data science. Supervised Unsupervised Learning Data Sci. 2020:3-21.
- [Google Scholar]
- Modelling land use/land cover projection using different scenarios in the Cisadane Watershed, Indonesia: Implication on deforestation and food security. Egypt. J. Remote Sens. Space Sci.. 2023;26(2):273-283.
- [Google Scholar]
- Thematic analysis as a new culturomic tool: the social media coverage on COVID-19 pandemic in Italy. Sustainability. 2022;14(6):3643.
- [Google Scholar]
- An integrated GIS approach to analyse the impact of land use change and land cover alteration on groundwater potential level: a study in Kangsabati Basin, India. Groundwater Sustainable Dev.. 2020;11:100399
- [Google Scholar]
- Green space’s growth impact on the urban microclimate. Proc. Soc. Behav. Sci.. 2013;105:547-557.
- [Google Scholar]
- Assessment of current and future land use/cover changes in soil erosion in the Rio da Prata basin (Brazil) Sci. Total Environ.. 2022;818:151811
- [Google Scholar]
- A remote sensing-based Approach to investigate changes in land use and land cover in the lower uMfolozi floodplain system, South Africa. Trans. Royal Soc. South Africa. 2021;76(1):13-25.
- [Google Scholar]
- The impact of land use and land cover changes in the landscape pattern and ecosystem service value in the Sanjiangyuan region of the Qinghai-Tibet Plateau. J. Environ. Manag.. 2023;325:116539
- [Google Scholar]
- Evaluating land use/cover change with temporal satellite data and information systems. Proc. Technol.. 2012;1:385-389.
- [Google Scholar]
- Spatio-temporal urban land use/cover change analysis in a hill station: The case of Baguio City, Philippines. Proc. Soc. Behav. Sci.. 2011;21:326-335.
- [Google Scholar]
- Trees, Forests and Land Use in Drylands: The First Global Assessment Preliminary Findings. Rome, Italy: Food and Agriculture Organization of the United Nations; 2016. p. :31.
- Does massive funding support of researchers work?: Evaluating the impact of the South African research chair funding initiative. Research Policy. 2015;44(2):467-482.
- [Google Scholar]
- Dynamics of forage and land cover changes in Teltele district of Borana rangelands, southern Ethiopia: using geospatial and field survey data. BMC Ecol.. 2020;20(1):1-16.
- [Google Scholar]
- Analysis of land use dynamic change and its impact on the water environment in Yunnan plateau lake area––A case study of the Dianchi Lake drainage area. Proc. Environ. Sci.. 2011;10:2709-2717.
- [Google Scholar]
- Mapping the knowledge structure of neonatal hypoxic-ischemic encephalopathy over the past decade: a co-word analysis based on keywords. J. Child Neurol.. 2016;31(6):797-803.
- [Google Scholar]
- IPCC, 2022b. Summary for Policymakers. In: Climate Change 2022: Mitigation of Climate Change. Contribution of Working Group III to the Sixth Assessment Report of the Intergovernmental Panel on Climate Change [P.R. Shukla, J. Skea, R. Slade, A. Al Khourdajie, R. van Diemen, D. McCollum, M. Pathak, S. Some, P. Vyas, R. Fradera, M. Belkacemi, A. Hasija, G. Lisboa, S. Luz, J. Malley, (eds.)]. Cambridge University Press, Cambridge, UK and New York, NY, USA.
- Agriculture and its impact on land use, environment, and ecosystem services. Landscape Ecology-the Influences of Land Use and Anthropogenic Impacts of Landscape Creation 2016:1-26.
- [Google Scholar]
- Biophysical linkage with simulation modelling for sustainable land use and agricultural productivity: a case study in western Uttar Pradesh, India. Proc. Environ. Sci.. 2013;18:818-828.
- [Google Scholar]
- Towards a deeper understanding of barriers to national climate change adaptation policy: A systematic review. Clim. Risk Manag.. 2022;35:100414
- [Google Scholar]
- A dynamic simulation model of land cover in the Dulce Creek Basin, Argentina. Procedia Environ. Sci.. 2011;7:194-199.
- [Google Scholar]
- Spatial and temporal change of landscape pattern in the hilly-gully region of the loess plateau. Procedia Environ. Sci.. 2011;8:103-111.
- [Google Scholar]
- Exploring the Global Research Trends of Land Use Planning Based on a Bibliometric Analysis: Current Status and Future Prospects. Land. 2021;10(3):304.
- [Google Scholar]
- Utility of Landsat image in the study of land cover and land surface temperature change. Procedia Environ. Sci.. 2011;10:1287-1292.
- [Google Scholar]
- Urban green space analysis and identification of its potential expansion areas. Procedia Soc. Behav. Sci.. 2012;35:449-458.
- [Google Scholar]
- Developments in land use and land cover classification techniques in remote sensing: A review. J. Geogr. Inf. Syst.. 2022;14(1):1-28.
- [Google Scholar]
- Functional Trait Responses of C4 Bunchgrasses to Fire Return Intervals in the Semi-Arid Savanna of South Africa. Diversity. 2023;15(12):1201.
- [Google Scholar]
- Mapping and Assessing Riparian Vegetation Response to Drought along the Buffalo River Catchment in the Eastern Cape Province. South Africa. Climate. 2024;12(1):7.
- [Google Scholar]
- Land use and land cover mapping using Sentinel-2, Landsat-8 Satellite Images, and Google Earth Engine: A comparison of two composition methods. Remote Sens. (Basel). 2022;14(9):1977.
- [Google Scholar]
- Assessing Coastal Land Use and Land-cover Change Dynamics Using Geospatial Techniques. Sustainability. 2023;15(9):7398.
- [Google Scholar]
- Earth observation systems and pasture modeling: A bibliometric trend analysis. ISPRS Int. J. Geo Inf.. 2021;10(11):793.
- [Google Scholar]
- Security risks from climate change and environmental degradation: implications for sustainable land use transformation in the Global South. Curr. Opin. Environ. Sustain.. 2023;63:101322
- [Google Scholar]
- Spatiotemporal patterns and characteristics of land-use change in China during 2010–2015. J. Geog. Sci.. 2018;28(5):547-562.
- [Google Scholar]
- Analysis of land cover changes and landscape fragmentation in Batanghari Regency, Jambi Province. Procedia Soc. Behav. Sci.. 2016;227:87-94.
- [Google Scholar]
- A general theory of bibliometric and other cumulative advantage processes. J. Am. Soc. Inf. Sci.. 1976;27(5):292-306.
- [Google Scholar]
- Spatio-temporal analysis trend of land use and land cover change against temperature based on remote sensing data in Malang city. Procedia Soc. Behav. Sci.. 2016;227:232-238.
- [Google Scholar]
- Spatial analysis of land use and land cover changes in the recent 30 years in the Manas River Basin. Procedia Environ. Sci.. 2012;12:906-916.
- [Google Scholar]
- Investigation and Evaluation of Land Use-Land Cover Change Effects on Current and Future Flood Susceptibility. nat. Hazard. Rev.. 2024;25(1):04023049.
- [Google Scholar]
- Software survey: ScientoPy, a scientometric tool for topic trend analysis in scientific publications. Scientometrics. 2019;121(2):1165-1188.
- [Google Scholar]
- The Fragmented Land Use Administration in Indonesia Analysing bureaucratic responsibilities influencing tropical rainforest transformation systems. Land Use Policy. 2015;43:96-110.
- [Google Scholar]
- Factors contributing to the formation of an urban heat island in Putrajaya, Malaysia. Procedia Soc. Behav. Sci.. 2013;105:840-850.
- [Google Scholar]
- The effects of climate change and land-use change on demographic rates and population viability. Biol. Rev.. 2015;90(3):837-853.
- [Google Scholar]
- Monitoring urban growth and changes in land use and land cover: a strategy for sustainable urban development. Int. J. Hum. Cap. Urban Manag. 2023;8:111-126.
- [Google Scholar]
- The Application of Remote Sensing in the Extraction of Urban Land Use Changes. Procedia Environ. Sci.. 2011;10:1589-1594.
- [Google Scholar]
- Combining Sentinel-1 and Sentinel-2 data for improved land use and land cover mapping of monsoon regions. Int. J. Appl. Earth Obs. Geoinf.. 2018;73:595-604.
- [Google Scholar]
- The effect of land use zonings on housing development: the introduction of CDL approach in the border area of Surabaya and Sidoarjo Regency, Indonesia. Procedia Soc. Behav. Sci.. 2016;227:107-111.
- [Google Scholar]
- UNEP, U., 2020. Environment Programme. (2020). Press Release: United in Science report: Climate change has not stopped for COVID-19.
- United Nations (2017). Resolution Adopted by the General Assembly on 6 July 2017, Work of the Statistical Commission Pertaining to the 2030 Agenda for Sustainable Development (A/RES/71/313 Archived 28 November 2020 at the Wayback Machine); General Assembly: New York, NY, USA. Available online: https://undocs.org/A/RES/71/313 (accessed on 10 July 2017).
- Land Use and Land Cover in Tropical Forest: Global Research. Forests. 2022;13(10):1709.
- [Google Scholar]
- Identifying core driving factors of urban land use change from global land cover products and POI data using the random forest method. Int. J. Appl. Earth Obs. Geoinf.. 2021;103:102475
- [Google Scholar]
- A bibliometric analysis on land degradation: Current status, development, and future directions. Land. 2020;9(1):28.
- [Google Scholar]
- Uncertainty Comparison for Area-Class Maps Concerning Different Reference Data. Procedia Environ. Sci.. 2011;10:2075-2082.
- [Google Scholar]
- Research on land use change in Beijing Hanshiqiao Wetland Nature Reserve using remote sensing and GIS. Procedia Environ. Sci.. 2011;10:583-588.
- [Google Scholar]
Appendix A
Supplementary data
Supplementary data to this article can be found online at https://doi.org/10.1016/j.jksus.2024.103262.
Appendix A
Supplementary data
The following are the Supplementary data to this article:


