

Translate this page into:
Glia maturation factor gamma, is a novel diagnostic marker of leukemia, has TAL1 binding sites in its promoter
⁎Corresponding author. ramla_shahid@comsats.edu.pk (Ramla Shahid)
-
Received: ,
Accepted: ,
This article was originally published by Elsevier and was migrated to Scientific Scholar after the change of Publisher.
Peer review under responsibility of King Saud University.
Abstract
Expression of GMFG is induced among leukemic patients. TAL1 and associated transcription factors have binding sites in GMFG promoter. Expression of TAL1 and GMFG coincide among leukemia patients.
Abstract
Glia maturation factor gamma (GMFG) overexpression increases T-cell migration and adhesion. Its high expression in colorectal and ovarian cancer is associated with chemoresistance and adverse prognosis. However, it remains elusive if GMFG plays a role in the development and progression of leukemia. Tissue invasion in leukemia has long been known as the reason for disease progression as leukemic cells accumulates in bone marrow, spleen and lymph nodes. This tissue invasion requires cell motility and migration. The aim of the present study was to find any association of GMFG expression with leukemia and its potential to be a diagnostic marker. For this purpose, we have carried out expression profiling of GMFG among a cohort of leukemia patients. Liquid biopsies were collected and subjected to GMFG expression analysis. We found that GMFG expression was significantly elevated among leukemia patients of all age groups relative to their age match controls. Further promoter analysis of GMFG reveals binding sites for T-cell Acute Lymphocytic Leukemia 1 (TAL1) and associated transcription factors. TAL1 is master transcription factor which, in coordination with other factors like GATA-binding protein 1 (GATA-1) and LIM domain only 2 (LMO2), regulates gene expression in T-cell leukemia. The induced TAL1 expression coincides with upregulated GMFG expression. Together these data suggest that TAL1 may bind to GMFG promoter to increase its expression. GMFG may play a crucial role in the motility of leukemic cells and facilitates their tissue invasion which leads to therapy resistance.
Keywords
Acute lymphoblastic leukemia
Glia maturation factor gamma
Metastasis
Transcriptional complex
TAL1

1 Introduction
Malignant lymphocytes in leukemia infiltrate lymph node, spleen and bone marrow. This invasion provides the microenvironment which helps them escape the treatment and is associated with poor prognosis. Tissue migration is dependent on cell motility and transendothelial migration (Till et al., 2008). In T-cell ALL (T-cell acute lymphoblastic leukemia), blast cells remain motile throughout the bone marrow instead of residing in niches. Directional migration of T-lymphocytes and neutrophils is largely dependent on glia maturation factor, a novel regulator of actin related protein 2/3 (Arp2/3) complex (Aerbajinai et al., 2016). GMFG overexpression mediates monocytes migration and adhesion. High expression of GMFG has been detected in metastatic colon cancer (Wang et al., 2017). Knock down with GMFG siRNA or anti-GMFG antibody decrease cancer cell invasion and migration. As GMFG is required for human T-lymphocytes migration, reduction or loss of its expression either directly elevates integrin expression or indirectly alters dynamics of actin cytoskeleton (Lippert and Wilkins, 2012). It is therefore, generally suggested that GMFG has an essential role in lymphocyte movement. Currently not much is known regarding the role of GMFG in leukemia. TAL1 is a basic helix loop helix (bHLH) transcription factor oncogene that drives leukemogenesis due to aberrant expression in T-cell ALL (Mansour et al., 2014). TAL1 expressed in early hematopoietic lineage commitment and differentiation gets silenced in B and T lymphocytes (Patel et al., 2014). TAL1 forms a regulatory complex with other transcription factors. Transcriptional complex of TAL1 heterodimer with E-proteins (class I bHLH factor), GATA-1, LMO2, and LIM domain-binding protein 1 (LDB1) in erythroid cells is important for regulating hemoglobin subunit alpha genes (HBA) (Wadman et al., 1997). Transcription factors like E26 transformation-specific-1 (ETS-1) and Runt Related Transcription Factor 1 (RUNX1) also coordinate with TAL1 in regulating gene expression (Wilson et al., 2010). GATA protein is a major determinant of TAL1 function, and overrepresentation of GATA binding motifs have been identified in TAL1 binding regions in erythroid cells (Kassouf et al., 2010; Palii et al., 2011). In 40–60% T cell ALL, TAL1 ectopic expression is related with chromosomal translocation and enhancer mutation (Armstrong and Look, 2005; Begley et al., 1989; Breit et al., 1993; Mansour et al., 2014). Co-expression of LMO2 and TAL1 has been identified in 80% cases of T-cell ALL (Ferrando et al., 2002). LMO2 forms a multiprotein complex with GATA-1, TAL1, LDB1 and E47. The coordinated role of TAL1 and LMO2 in driving leukemia is associated with transactivation of genes like cyclin D2, receptor tyrosine phosphatase IA2, transmembrane protein T-cell Acute Lymphoblastic Leukemia-Associated Antigen 1 (TALLA1) (Draheim et al., 2011).
The inherent role of leukemia in metastasis is evident from the leukocytes that cover vast distances in limited span (Trendowski, 2015). Generally, the metastatic property of carcinomas is associated with specific mutations but in leukemia, tumorigenic activity is sufficient to drive metastasis. Lymphoid leukemias after acquiring mutations change into secondary tumors. In the current study, we have focused on identifying the role and regulation of GMFG to understand its function and potential as a new cancer marker of leukemia. We have also investigated the association of its expression with TAL1 which is master transcription factor of leukemia.
2 Methods
2.1 Blood collection
Blood samples of 385 ALL patients with age ranging from 6 months to 54 years were collected with consent from the local hospitals of Lahore and Islamabad. The duration of the study was from April 2015 to June 2016. The study was approved by the ethical committee of department of Biosciences, COMSATS university and respective hospitals and was conducted in accordance with Helsinki Declaration. Patients were classified according to French-American-British (FAB) classification system into B and T cell ALL. Initially diagnosed ALL patients and those in induction, consolidation and maintenance phase were selected for the study. Patients having acute myeloid leukemia (AML), chronic lymphocytic leukemia (CLL), chronic myeloid leukemia (CML), Hodgkin’s and non-Hodgkin’s lymphoma, hepatitis A, B and C, childbearing women and those previously treated for some kind of carcinoma were excluded from the study. Blood samples of 100 healthy subjects that served as control were also collected. Patients and controls were divided into four groups on the basis of the age as group I (6 months–12 years), group II (13–26 years), group III (27–40 years), and group IV (41–54 years) respectively.
2.2 Isolation of RNA
The whole blood collected from patients and controls were subjected to RBCs lysis by adding RBCs lysis buffer (the ratio being 1 ml blood:10 ml lysis buffer). The composition of buffer was 100 mM Tris (Invitrogen, USA) and 500 mM NH4Cl (Sigma, USA). After incubation at room temperature for 30 min, when the blood became translucent, the samples were centrifuged to get transparent leukocyte pellet (Desmeules et al., 2009). The samples were then processed for RNA isolation. RNA was isolated by using trizol reagent (Invitrogen, USA) according to manufacturer’s protocol. After quantifying RNA by nanodrop (IMPLEN, Germany), RNA quality was checked by gel electrophoresis.
2.3 Quantitative real time PCR
cDNA was prepared from 500 ng RNA by using Moloney Murine Leukemia Virus Reverse Transcriptase (MMLV-RT) (Thermo Fisher, USA). The expression analysis of GMFG, TAL1 and β-globin was carried out by using 2X Maxima Syber green qPCR master mix (Thermo Fisher, USA) on ABI StepOne detection system (Thermo Fisher Scientific, USA). β-globin was used as a housekeeping gene. For expression analysis the following primers (Macrogen, South Korea) were used GMFG (Forward): 5′-CAGGTTCGTGGTTTACAGCT-3′, GMFG (Reverse): 5′-TCATCTGTTGTTCCGGCTTG-3′, TAL1 (Forward): 5′-GGCGGAGTGGAGATCCTATT-3′, TAL1 (Reverse): 5′-CCTCTAGCTGGGGGTCACT-3′, β-globin (Forward): 5′-GCTTCTGACACAACTGTGTTCACTAGC-3′, β-globin (Reverse): 5′-CACCAACTTCATCCACGTTCACC- 3′. The thermal cycling conditions were 95 °C initial denaturation for 5 min followed by 40 cycles of 95 °C for 45 s, GMFG (49 °C), TAL1 (46 °C), β-globin (57 °C) for 30 s, 72 °C for 30 s and data acquisition was performed at the extension step. The expression of GMFG and TAL1 relative to endogenous control β-globin gene was analyzed by comparative Ct method.
2.4 Computational analysis
The sequence of GMFG promoter (1 kb upstream from the transcription start site) was retrieved from Ensemble (ENST00000253054) for analyzing binding sites for TAL1 and other transcription factors. ContraV3 bioinformatics tool (Kreft et al., 2017) was used for identification of transcription factors binding sites (TAL1, GATA-1, GATA-2, LMO2, TCF3, ETS-1, RUNX1 and FLI-1) in GMFG promoter region.
2.5 Statistical method
Graph pad prism was used to apply unpaired student’s t test for evaluating statistical significance of GMFG and TAL1 expression between controls and patients for all age groups. The data with p value less than 0.05 was considered statistically significant.
3 Results
3.1 Binding of transcription factors within GMFG promoter region
TAL1 transcription factor regulates hematopoiesis and its overexpression commonly occurs in T-cell leukemia. By using ConTra v3 bioinformatics tool, we identified binding sites of transcription factors including TAL1, GATA-1, GATA-2, LMO2, ETS-1, TCF3, RUNX1 and FLI-1 (Friend leukemia integration 1 transcription factor) within GMFG promoter region (−721 to −691 bps). Several GATA-1 binding sites were identified in the GMFG promoter region at −912, −719, −548, −476 and −121 upstream of transcription start site (TSS) (highlighted) in Fig. 1. As reported earlier, transcriptional complex of TAL1 with GATA-1, LMO2, TCF3 and RUNX1 induces the expression of genes like cell division protein kinase 6 (CDK6), HBA, retinaldehyde dehydrogenase 2 (RALDH2). By using the same bioinformatics tool, we also identified two TAL1 binding sites at −711 and −741 bps in GMFG promoter. Similarly, binding sites of LMO2 transcription factor are also present at −717, −565 and −377 upstream of TSS. Few TCF3 binding sites at −767, −734, −712, −376, −204 and −122 positions were also found (Fig. 1). RUNX1 binding sites had been identified at −818 and −286 bps upstream to start site. GATA-2 (−710 bps), ETS-1 (−721, −692, −657, −616, −552, −389, −125 bps) and FLI-1 (−714 bps) binding sites were also found in promoter region of GMFG. GMFG promoter region from −721 to −691 upstream to TSS appears to be very crucial for its regulation as all the mentioned transcription factors were found to have a binding site within this region. As TAL1 interacts with GATA-1, LMO2, GATA-2, FLI-1, and RUNX1 so presence of TAL1 binding sites in GMFG promoter region indicated the interaction of all these transcription factors like a complex (Fig. 2).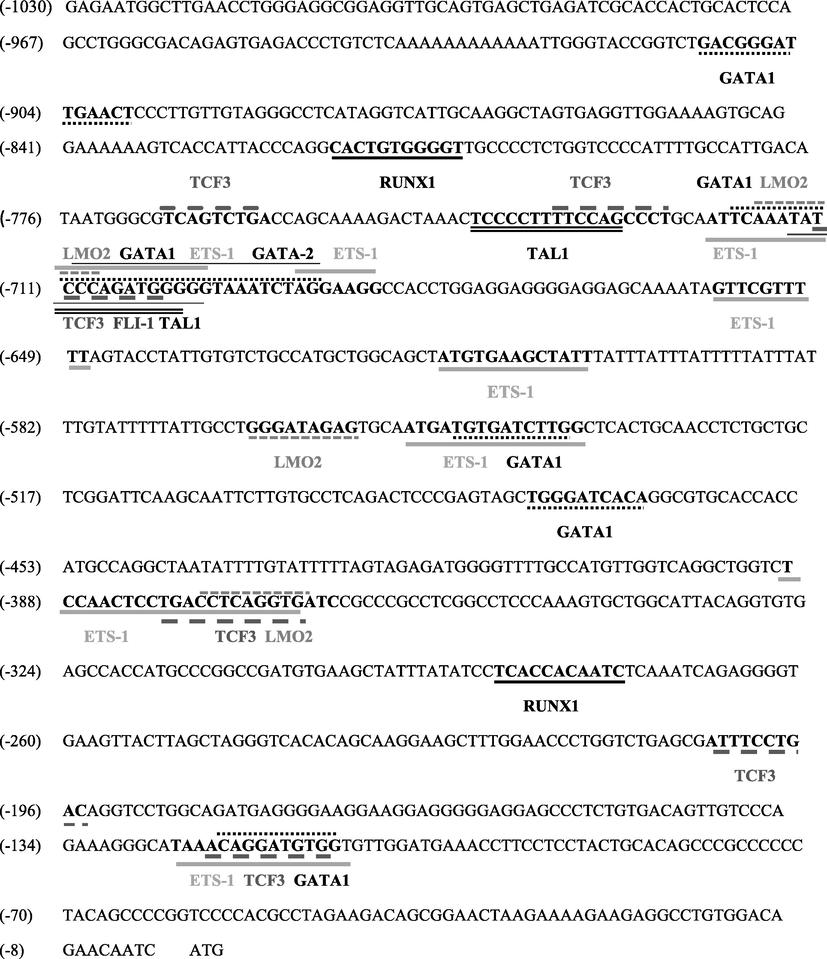
Schematic representation of GMFG promoter region 1 kb upstream of TSS depicting different transcription factor (TAL1, GATA-1, GATA-2, TCF3, LMO2, ETS-1, FLI-1 and RUNX1) binding sites. The binding sites had been underlined and nucleotides were represented in bold. The line style of each transcription factor along with its name was mentioned as:
 TAL1,
TAL1,  GATA-1,
  GATA-2,
  TCF3,
TCF3,  LMO2,
LMO2,  ETS-1,
  FLI-1,
  RUNX1. Two TAL1 binding sites had been identified at −711 and −741 bps position. Transcription factors TAL1 (−711), GATA-1 (−719), GATA-2 (−710), TCF3 (−712), LMO2 (−717), ETS-1 (−721) and FLI-1 (−714) had overlapping binding sites in the region −721 to −691 upstream to TSS.
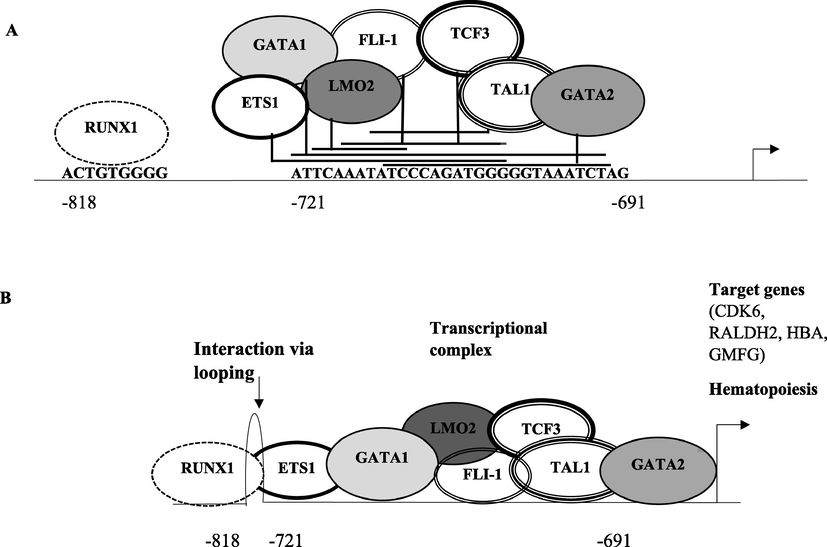
Panel A highlights the binding sites of various transcription factors (TAL1, GATA-1, GATA-2, TCF3, LMO2, ETS-1 and FLI-1) between −721 to −691 bps within the GMFG promoter region. RUNX1 binding site was present at −818 bps upstream to the TSS. Panel B shows looping of the promoter region which brings RUNX1 closer to other transcription factors binding site and formation of transcriptional complex.
3.2 Conserved TAL1 binding sequences
Conserved sequences in the genome indicate their vitality and any change in such sequences are lethal and detrimental for organisms. ConTra v3 has also indicated two TAL1 binding sites within GMFG promoter region (1 kb from TSS) of various species including humans. Both identified TAL1 binding sites have conserved sequences in humans, chimpanzees, gorillas, rhesus, baboon and orangutan (Table 1). This shows TAL1 involvement in hematopoietic lineage commitment in all the species without undergoing any evolutionary change.
Species
Sequence and position of first TAL1 binding site in GMFG promoter (on forward strand)
Sequence and position of second TAL1 binding site in GMFG promoter (on forward strand)
Human (ENST00000253054.12)
CCCATCTGGG (−711 bp)
CTGGAAAAGGGGA (−741 bp)
Chimpanzee (ENSPTRT00000020311.5)
CCCATCTGGG (−705 bp)
CTGGAAAAGGGGA (−735 bp)
Gorilla (ENSGGOT00000045487.1)
CCCATCTGGG (−705 bp)
CTGGAAAAGGGGA (−735 bp)
Rhesus (ENSMMUT00000074374.1)
CCCATCTGGG (−130 bp)
CTGGAAAAGGGGA (−160 bp)
Baboon (ENSPANT00000031926.1)
CCCATCTGGG (−1038 bp)
CTGGAAAAGGGGA (−1068 bp)
Orangutan (ENSPPYT00000011587.2)
CCCATCTGGG (−699 bp)
CTGGAAAAGGGGA (−729 bp)
3.3 GMFG expression in ALL and control subjects:
GMFG expression analysis was carried out in leukemic patients and their age match controls. The expression of GMFG was normalized against β-globin. GMFG expression was induced more than two-fold among ALL patients as compared to their age match controls where as GMFG expression was reduced among pediatric patients (Fig. 3). With age progression the GMFG expression in healthy individuals reduced. This data points towards potential role of GMFG in leukemia in adults. Elevated GMFG expression in leukemia patients may increase cell migration and metastasis by regulating actin remodeling in migrating leukemic cells. Cell migration involves formation of lamellipodia at the leading edge followed by actin polymerization. Altered GMFG expression might help the cells in migration and thus play role in metastasis of leukemic cells.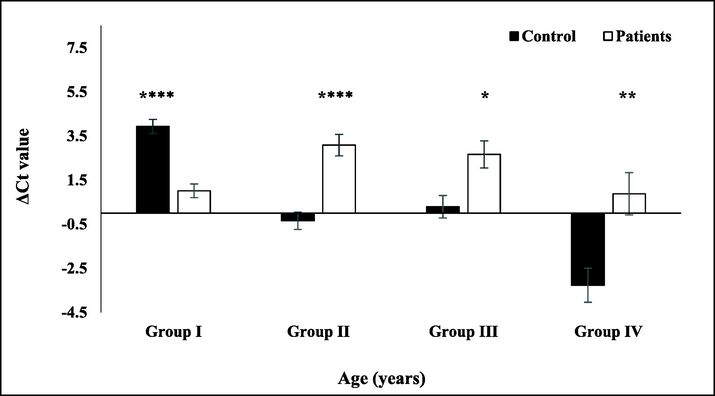
GMFG expression in control and ALL patients. The bar graph shows GMFG ΔCt values normalized against β-globin. Error bars represents standard error of mean. The black bars represent GMFG expression in age match healthy controls while the white bars indicate leukemia patients. Groups distribution on the basis of age were group I (6 months–12 years) and group II (13–26 years, ****p < 0.0001), group III (27–40 years, *p = 0.0215), group IV (41–54 years, **p = 0.0031).
3.4 TAL1 expression in ALL and control groups:
TAL1, master transcription factor of leukemia showed 6–8 folds induced expression in adult ALL patients. TAL1 is considered a T-cell ALL marker and its overexpression among ALL patients has previously been reported in literature (Palomero et al., 2006). In pediatric patients, the TAL1 expression was reduced by 4 folds as compared to their age match healthy control (Fig. 4). The expression pattern of TAL1 coincides with GMFG expression. ALL patients showed similar expression trends for TAL1 and GMFG. The coherent expression of both GMFG and TAL1 in ALL patients of different age groups were represented as ΔΔCt (Fig. 5). Both GMFG and TAL1 expression were reduced in pediatric while induced in adult leukemia patients. As GMFG promoter has various TAL1 binding sites, it seems that TAL1 higher expression may induce the expression of GMFG by binding to its promoter and transcriptionally activating it.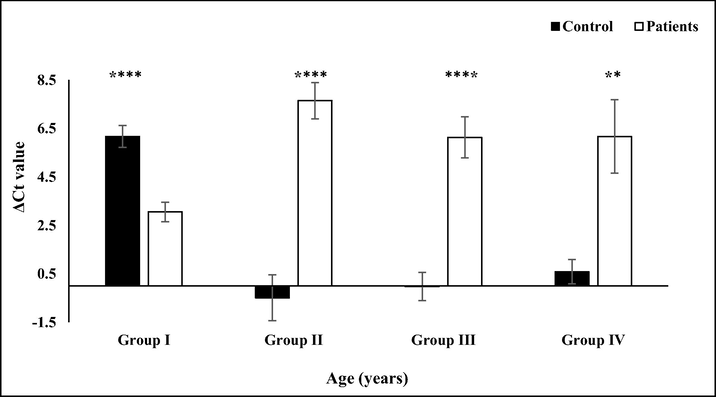
TAL1 expression in control and ALL subjects. The bar graph shows TAL1 ΔCT values normalized against β-globin. The error bars show standard error of mean. The black bars represent GMFG expression in age match healthy controls while white bars indicate expression in leukemia patients. Distribution of groups on the basis of age was group I (6 months–12 years), II (13–26 years), III (27–40 years) (****p < 0.0001), group IV (41–54 years, **p = 0.01).
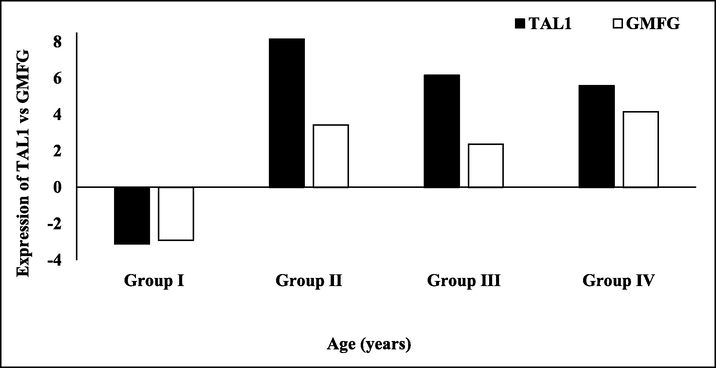
Coherent expression of TAL1 and GMFG. The bar graph shows ΔΔCT values of TAL1 and GMFG in ALL patients normalized by β-globin and age match healthy controls. The black bars represent TAL1 and white bars indicate GMFG expression in leukemia patients. Age distribution was group I (6 months–12 years), II (13–26 years), III (27–40 years) and IV (41–54 years).
We have also observed that GMFG expression was induced by almost four folds in patients who were newly diagnosed and had not undergone any treatment (Fig. 6). Upon treatment, as the patients were in remission, GMFG expression was also reduced. Together these data showed that GMFG expression was induced among adult leukemia patients. The expression was reduced as treatment proceeded and cancer was in remission.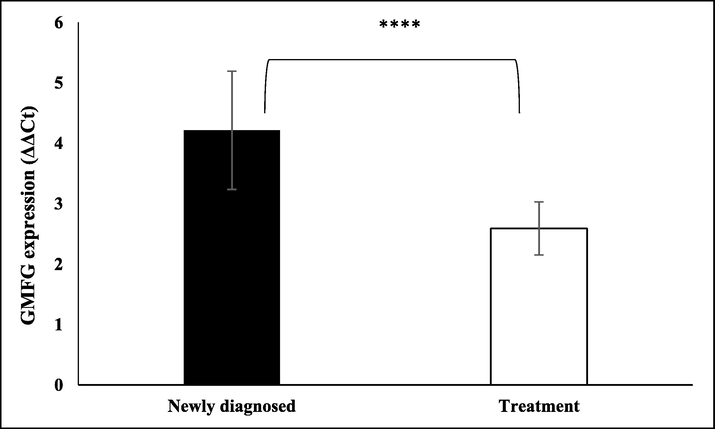
GMFG expression in newly diagnosed and under treatment ALL patients. The bar graph represents ΔΔCt values of GMFG expression normalized by β-globin and healthy controls in newly diagnosed and ALL adult patients (13–54 years) undergoing treatment, (****p = 0.0001). The black bar represents GMFG expression in newly diagnosed patients while white bar indicates GMFG expression in patients under treatment. Error bars represent standard error of mean.
4 Discussion
GMFG mediates actin nucleation by forming a complex with Arp2/3, WASP/WAVE and GTPases and therefore contributes in cell motility and migration. Elevated GMFG expression was reported in inflammatory cells like lymphoblasts, T-lymphocytes, macrophages, lymphoid and myeloid leukemia cell lines (Ikeda et al., 2006; Shi et al., 2006). GMFG overexpression has been co-related with lymph node metastasis in colorectal and tumor progression in ovarian carcinomas. (Wang et al., 2017; Zuo et al., 2014). The current study was aimed at analyzing the GMFG expression among acute lymphoblastic leukemia patients and its possible role as novel diagnostic and prognostic marker. We observed GMFG expression was induced among leukemia patients as compared to their age match controls. GMFG expression pattern also coincides with TAL1 which is master transcription factor in leukemia. Our data also showed that GMFG expression was induced among newly diagnosed patients. Expression was reduced among patients who had undergone treatment and their cancer was in remission. This points that high GMFG expression may act as a diagnostic marker of leukemia. This needs further elucidation to establish GMFG as a diagnostic marker. Bioinformatics analysis has revealed binding sites of TAL1 in GMFG promotor which has been conserved among other species suggesting that it could be one of TAL1 target genes. Kawai et al. (2003) and Shi et al. (2006) identified various hematopoietic specific transcription factors binding sites in GMFG promoter including GATA-1, GATA-2, ETS-1, LMO2, TCF3 and FLI-1. Studies have shown TAL1 forms “HSPC heptad with GATA-2, LMO2, LYL1, RUNX1, ERG (ETS-related gene), FLI-1 and target genes involved in hematopoiesis (Wilson et al., 2010). Mutual TAL1 and GATA-1 binding sites have been identified in erythrocytes, mast cells and megakaryocytes (Tripic et al., 2009). We have identified two TAL1 binding sites in GMFG promoter region shared by several hematopoietic specific transcription factors including GATA-1, GATA-2, ETS-1, LMO2, TCF3 and FLI-1. In erythroid cells, GATA-1 and TAL1 show co-occupancy at several genomic sites (Cheng et al., 2009). ETS-1 and RUNX1 promote binding of TAL1 with the genes involved in T-cell differentiation (Palii et al., 2011). TAL1 also interacts with ETS-1 and RUNX1 bound motifs in murine hematopoietic cell lines (Wilson et al., 2010). In conclusion, we demonstrated that higher GMFG expression was associated with ALL incidence and could act as a diagnostic marker for leukemia. As the GMFG promoter region has hematopoietic transcription factors binding sites like GATA-1, ETS-1, and RUNX1, studies have shown that all these transcription factors facilitate TAL1 binding in the genome. It is therefore, suggested that TAL1 may be involved in transcriptional activation of GMFG expression. An extensive research regarding the regulatory control of GMFG by heptad multiprotein transcriptional complex is needed in various hematological malignancies to establish GMFG as diagnostic marker for leukemia.
Acknowledgments
We highly appreciated the efforts of the local hospitals for leukemia patient’s sample collection.
Conflict of interest
No conflict of interest was declared by authors.
Funding source
The study was supported by the Higher Education Commission, Pakistan and Comsats University, Islamabad, Pakistan.
References
- Glia maturation factor-γ Regulates monocyte migration through modulation of β1-integrin. J. Biol. Chem.. 2016;291(16):8549-8564.
- [CrossRef] [Google Scholar]
- Molecular genetics of acute lymphoblastic leukemia. J. Clin. Oncol.. 2005;23:6306-6315.
- [CrossRef] [Google Scholar]
- Chromosomal translocation in a human leukemic stem-cell line disrupts the T-cell antigen receptor delta-chain diversity region and results in a previously unreported fusion transcript. PNAS. 1989;86(6):2031-2035.
- [CrossRef] [Google Scholar]
- Site-specific deletions involving the tal-1 and sil genes are restricted to cells of the T cell receptor alpha/beta lineage: T cell receptor delta gene deletion mechanism affects multiple genes. J. Exp. Med.. 1993;177:965-977.
- [CrossRef] [Google Scholar]
- Erythroid GATA1 function revealed by genome-wide analysis of transcription factor occupancy, histone modifications, and mRNA expression. Genome Res.. 2009;19:2172-2184.
- [CrossRef] [Google Scholar]
- A rapid flow cytometry assay for the assessment of calcium mobilization in human neutrophils in a small volume of lysed whole-blood. J. Immunol. Methods. 2009;340(2):154-157.
- [CrossRef] [Google Scholar]
- A DNA-binding mutant of TAL1 cooperates with LMO2 to cause T cell leukemia in mice. Oncogene. 2011;30:1252.
- [CrossRef] [Google Scholar]
- Gene expression signatures define novel oncogenic pathways in T cell acute lymphoblastic leukemia. Cancer Cell. 2002;1:75-87.
- [CrossRef] [Google Scholar]
- Glia maturation factor-γ is preferentially expressed in microvascular endothelial and inflammatory cells and modulates actin cytoskeleton reorganization. Circ. Res.. 2006;99:424-433.
- [CrossRef] [Google Scholar]
- Genome-wide identification of TAL1’s functional targets: Insights into its mechanisms of action in primary erythroid cells. Genome Res.. 2010;20:1064-1083.
- [CrossRef] [Google Scholar]
- Structure and promoter activity of the human glia maturation factor-gamma gene: a TATA-less, GC-rich and bidirectional promoter. Biochimica et Biophysica Acta.. 2003;1625:246-252.
- [CrossRef] [Google Scholar]
- ConTra v3: a tool to identify transcription factor binding sites across species, update 2017. Nucleic Acids Res.. 2017;45:490-494.
- [CrossRef] [Google Scholar]
- Glia maturation factor gamma regulates the migration and adherence of human T lymphocytes. BMC Immunol.. 2012;13:21.
- [CrossRef] [Google Scholar]
- An oncogenic super-enhancer formed through somatic mutation of a noncoding intergenic element. Science. 2014;346:1373-1377.
- [CrossRef] [Google Scholar]
- Differential genomic targeting of the transcription factor TAL1 in alternate hematopoietic lineages. EMBO J.. 2011;30:494-509.
- [CrossRef] [Google Scholar]
- Transcriptional regulatory networks downstream of TAL1/SCL in T-cell acute lymphoblastic leukemia. Blood. 2006;108:986-992.
- [CrossRef] [Google Scholar]
- Aberrant TAL1 activation is mediated by an interchromosomal interaction in human T-cell acute lymphoblastic leukemia. Leukemia. 2014;28:349-361.
- [CrossRef] [Google Scholar]
- Glia Maturation Factor Gamma (GMFG): A cytokine-responsive protein during hematopoietic lineage development and its functional genomics analysis. Genomics, Proteomics Bioinf.. 2006;4:145-155.
- [CrossRef] [Google Scholar]
- Cell motility in chronic lymphocytic leukemia: defective Rap1 and αLβ2 activation by chemokine. Cancer Res.. 2008;68(20):8429-8436.
- [CrossRef] [Google Scholar]
- The inherent metastasis of leukaemia and its exploitation by sonodynamic therapy. Critical Rev. Oncol. Hematol.. 2015;94:149-163.
- [CrossRef] [Google Scholar]
- SCL and associated proteins distinguish active from repressive GATA transcription factor complexes. Blood. 2009;113:2191-2201.
- [CrossRef] [Google Scholar]
- The LIM-only protein Lmo2 is a bridging molecule assembling an erythroid, DNA-binding complex which includes the TAL1, E47, GATA-1 and Ldb1/NLI proteins. EMBO J.. 1997;16:3145-3157.
- [CrossRef] [Google Scholar]
- Expression of glia maturation factor γ is associated with colorectal cancer metastasis and its downregulation suppresses colorectal cancer cell migration and invasion in vitro. Oncol. Rep.. 2017;37:929-936.
- [CrossRef] [Google Scholar]
- Combinatorial transcriptional control in blood stem/progenitor cells: genome-wide analysis of ten major transcriptional regulators. Cell Stem Cell. 2010;7:532-544.
- [CrossRef] [Google Scholar]
- High GMFG expression correlates with poor prognosis and promotes cell migration and invasion in epithelial ovarian cancer. Gynecol. Oncol.. 2014;132:745-751.
- [CrossRef] [Google Scholar]


