

Translate this page into:
Geo-spatial mapping and simulation of the sea level rise influence on groundwater head and upward land subsidence at the Rosetta coastal zone, Nile Delta, Egypt
⁎Corresponding author. martina.zelenakova@tuke.sk (Martina Zeleňáková)
-
Received: ,
Accepted: ,
This article was originally published by Elsevier and was migrated to Scientific Scholar after the change of Publisher.
Peer review under responsibility of King Saud University.
Abstract
The coastal zone has been experiencing population growth and incomparable developments that are in discordance with the dynamic nature of the coastal system. The present study focused on the Groundwater Head (GWH) changes and upward land subsidence as a result of Sea Level Rise (SLR). Consequently, the numerical model of SEAWAT is applied to the Nile Delta Aquifer (NDA) at the outlet of the Nile Rosetta branch to simulate the (GWH) for the current situation and the future scenarios of SLR. It was estimated as 5.67, 14.51 and 26.71 cm at the years 2020, 2040 and 2060, respectively. The resulted of GWH are ranged between 0 to 0.40, 0 to 0.45 and 0 to 0.55 cm at the years 2020, 2040 and 2060 respectively. The GWH were then used to predict the future upward land subsidence by applying high least square linear regression analysis. An inverse relationship was found between the GWH and the upward land subsidence with correlation coefficients (r2 = 0.87). Where the hydraulic head increased as a result of sea level rise the rate of upward land subsidence decreased through the years 2020, 2040 and 2060 respectively. The geospatial mapping of the upward land subsidence shows a general increase to the northern part at the Rosetta Promontory, which has the highest thickness and accumulation rates of the Holocene deposits.
Keywords
Sea level rise
Groundwater
Numerical modelling
Nile Delta Aquifer
Subsidence

- GWH
-
Groundwater Head
- SLR
-
Sea Level Rise
- ND
-
Nile Delta
- MODFLOW
-
Three-Dimensional Groundwater Flow
- MT3DMS
-
Modular Transport Three-Dimensional Multi-Species
- SEAWAT
-
Three-Dimensional Variable-Density Groundwater Flow
- MSL
-
Mean Sea Level
- EPK
-
Empirical Bayesian Kriging method
- GIS
-
Geographic Information System
- VDF
-
Variable-Density Flow
- IMT
-
Integrated MT3DMS Transport
- RMS
-
Root Mean Square
Abbreviations
1 Introduction
The Nile Delta (ND) coastal zone, a highly dynamic and complex environment, has important economic implications to governments and coastal managers. The ND of Egypt is threatened by numerous environmental problems, such as SLR, upward land subsidence and groundwater salinization (Abdeltawab et al., 2013; Attwa and El Shinawi, 2014; Stanley and Clemente, 2017). The population growth, coupled with the rate and pace of development along the coast has been incomparable (Merkens et al., 2016; Hagenlocher et al., 2018). In addition, the coastal dynamic nature represents an obstacle for much of these developments (El-Shinawi and Naymushina, 2015; Kramarenko et al., 2016, Martinez et al., 2017; Naymushina et al., 2010). The coastal zone is connected to terrestrial, marine sites and changes in these sites can adjust coastal processes (Ruttenberg and Granek, 2011). The Nile delta wave, fan-shaped, subject deltaic composition is the largely depo-center in the Mediterranean Sea (Chen et al., 1992). Consequently, the ND coast dynamic nature was as a result of discharge of Nile river sediments into the Mediterranean Sea (Stanley, 1988) which later silted up and replaced by the present branches (Fig. 1). In general, the ND is separated by East-West hinge line and uplift zone, the simulation shows that the northern N D will be inundated by seawater and the land deformation plays a major role in the inland progression of seawater (Gebremichael et al., 2018a,b; Elham et al., 2016). Egypt is considered one of the top five countries expected to be most impacted by a 1 m SLR in the world (Dasgupta et al., 2009). Also, the Egyptian shores show high socioeconomic vulnerability ratings, with a score of 4.80–4.90. In addition the arid coasts in North African such as Egypt show the highest risk score of vulnerability indices 70% to SLR. Recently, the simulation of future GWH in the ND under the effect of SLR was done by Negm et al. (2018); Abd-Elaty et al. (2014, 2019, 2020, 2021), Abd-Elhamid et al. (2016, 2019). The areas of highest vulnerability were identified in the ND and attributed to anthropogenic factors such as urbanization, damming and, correlated with the rapid increase in coastal urban populations by 62.6%, over the last decades (Abderraouf Hzami et al., 2021). Hence, the main coastal problems are reduction of sediment supply, (SLR), upward land subsidence. Upward land subsidence in the ND area is attributed to numerous reasons; the discharge cycle of the River Nile that influences deformation rates of the ND (Rateb and Abotalib, 2020). Subsidence of the Holocene sediments, which has been caused by different sedimentation cycles since the Miocene era to the present (Stanley and Warne, 1993; El Shinawi et al., 2021). Over-pumping for groundwater, gas and oil, also has its contribution for the upward land subsidence (Galloway et al., 1998). Accordingly, the previous studies discussed the impact of sea level rise on drawdown, land subsidence and shore erosion, but still there is a gap in understanding the impact on the upward land subsidence and its relation with drawdown. Consequently this research aimed to determining the impact of SLR on the GHW and the upward land subsidence in the north western Nile Delta. This is applied by the integration of M ODFLOW, MT3DMS Flow, solute transport model SEAWAT-2000, GIS and statistical regression analysis. Additionally, applying simulation of the future scenarios to predict the future changes in the GWH and upward land subsidence for the years 2040 and 2060. The applied integration will give an early warning to maintain the groundwater storage and manage the pumping rates in the Nile Delta coastal aquifer.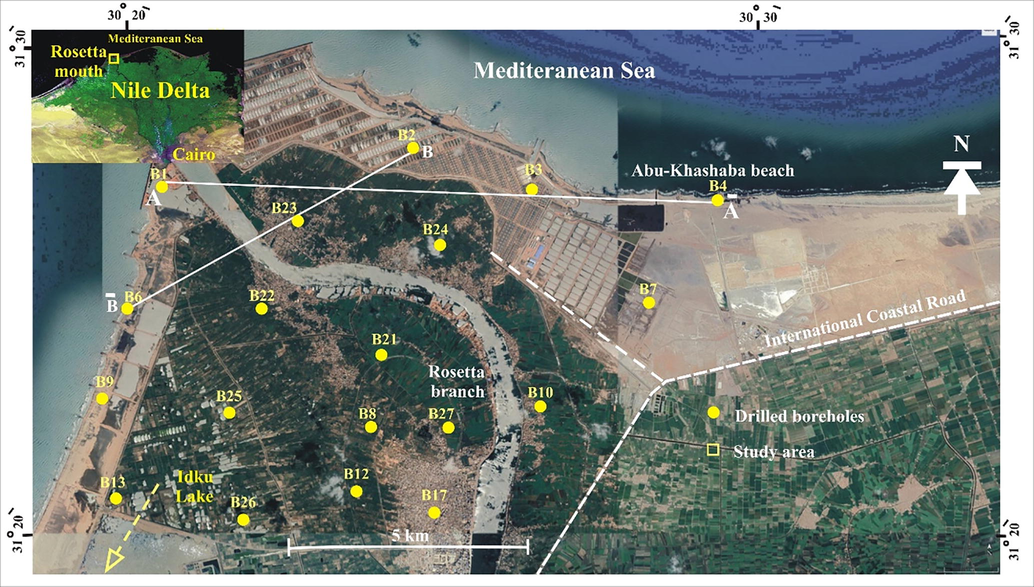
Location map of the study area, boreholes (Smithsonian's Nile Delta Project, Chen et al., 1992).
2 Geologic setting
The general late Miocene uplift formed the Nile River and it was accomplished in the Early Pliocene (Attia, 1954). Moreover, its channel drowned in the Mid-Pliocene as a result of Mediterranean Sea transgression. The Nile deposits were accumulated in large quantities which lead to form the ND. The diluvial deposits in Pleistocene and overlaid by alluvial deposits, comprising the recognized Holocene heavy minerals (Higazy and Naguib, 1985). These sediments are believed to be of the Quaternary age (El Shazly et al., 1975). The Rosetta promontory, a triangular-shaped landform that currently extends – 14 km north-north-westward into the sea, is the most distinctive geomorphic feature in the study area. The strand plain, composed of accreted beach ridges that mark the position of former shorelines, has developed mainly along the east coast of the Rosetta promontory (Fig. 1). These shallow backshore depressions, which are generally below sea level (to −1 m), are periodically inundated by marine water, particularly during the winter storm season. The northern sector is restricted by the El-Sahel drain and from the south by the international highway and is characterized by a light tone and rich in clay and organic matter. Alluvial to shallow marine sands and some stiff muds accumulated during the last Pleistocene sea-level high stand and last major eustatic lowering and the early phases of the subsequent, very rapid SLR. Fluvial overbank muds were placed in rapid SLR conditions. Marine transgressive sands were accumulated as sea level continued to rapidly rise. This rapid rise caused the coastline to retrograde the Nile Delta shoreline. The SLR rate was decelerated, sediment rate input began to predominate over SLR rate. Consequently, aggradation and progradation of Holocene ND sediments on to the unconformity concerned. The delta muds, silts and sands, nearshore marine coast sands accumulated in the Rosetta Promontory (Abdel Wahab and Stanley, 1991). Thus, the overall change from alluvial to marine coastal deposits records the change from a major sea level low-stand to high stand. For instance, the overall change from late Pleistocene alluvial to Holocene marine and coastal deposits records the change from a major sea level low-stand to a high-stand.
3 Materials and methods
3.1 Study site
The study area is located in the north western part of the ND around the Rosetta River Nile branch (Fig. 1). It is a part of the northern coastal area of the ND and exposed shore erosion, seawater intrusion and land subsidence (Nosair et al., 2021; El Shinawi et al., 2022). The Rosetta promontory extends 17.5 km into the sea in a triangular-shaped landform as the main distinguish geomorphic feature and transport 70% of River Nile sediments to the coast in seaward. The sediment supply reduced to zero at the coast as a result of irrigation projects. In contrast, the Rosetta Promontory has retrograde more than 5 km over the last decades correlated with the rapid increase in coastal urban populations by 62.6% (Abderraouf Hzami et al., 2021). Moreover, the shoreline extensive erosion rates accelerated and the coastal zone of the ND deformation is organized by Holocene sediments due to eustatic sea level changes with rapid retro-gradation up to 100 m/year (Frihy, 2017). Additionally, the eroded sediments were accumulated to each side of the Rosetta Promontory increase pro-gradation of neighbouring beaches and backshores and shown as shallow depressions, with −1.0 m below sea level, occasionally drowned by saltwater, predominantly during the winter storm season.
3.2 Geo-spatial mapping
The datasets includes average values of thickness, accumulation rates, subsidence and the head of the groundwater aquifer. These data are derived from various literature sources (Chen et al., 1992; Fanos, 1995; Marriner et al., 2013; Stanely and Crowin, 2013; Frihy, 2017), unpublished reports that detail aspects for civil engineering and hydrologic investigations were used to compile a database of Holocene sediments of the present study. Locations of borehole sites (30) are given in (Fig. 1) these have been benchmarked relative to present and also the future scenarios. Thirty boreholes in Quaternary sediments from the late Pleistocene to the late Holocene were used (for location see Fig. 1) with total depth of borings ranges from 20 to 30 m. Subsequently, the subsurface profile was studied from the litho-stratigraphic cross-sections through eastern and western sides of Rosetta Promontory, and litho-stratigraphic cross section through Rosetta mouth showing the distribution of Quaternary sediments in the study area. The boreholes data was processed with the ArcGIS 10.1 software (Esri, 2007) in form of geographical database. Then the data were georeferenced, digitized and converted into shapefile format, after that it was interpolated to produce spatial maps for the different parameters in a raster format. These maps were generated by using the Empirical Bayesian Kriging method (EPK) in the GIS Geostatistical Analyst Tool. EBK is an interpolation process that automates the most difficult features of building a valid kriging model (Magesh and Elango, 2019; ESRI, 2020b). It differs from traditional kriging methods by accounting for the interpolation error introduced by estimating the semivariogram model (Krivoruchko, 2012). These maps are occasionally used to explore the general tendency for all parameters in the study area as an attempt to co-operate these parameters with the GWH in the same locations particularly the upward land subsidence.
3.3 Numerical simulation
The coupled groundwater flow and solute transport model of SEAWAT are used to simulate the current study area. The code integrated the density-dependent flow and the solute transport equation. The equation governing the variable-density flow process (VDF) in terms of the freshwater head as used in SEAWAT (Guo and Langevin, 2002) while the integrated MT3DMS transport (IMT) process solves the following form of the advection–dispersion equation (Zheng and Wang, 1999):
3.3.1 Model geometry
The study area was digitized using SEAWAT code by 144 rows and 240 columns for active and inactive cells, the dimensions of each cell is 1 km x1 km with an average depth of 850 m. The model domain is divided into 7 layers; the first one is clay cap layer with an average thickness of 25 m which is partially confines the quaternary aquifer by semi confined, the layers from the second to the fifth have equal depths of 100 m while the last two layers have 200 m thickness. Fig. 2a shows the two vertical cross-sections in x-direction from the east to west and in y-direction from the north to the south.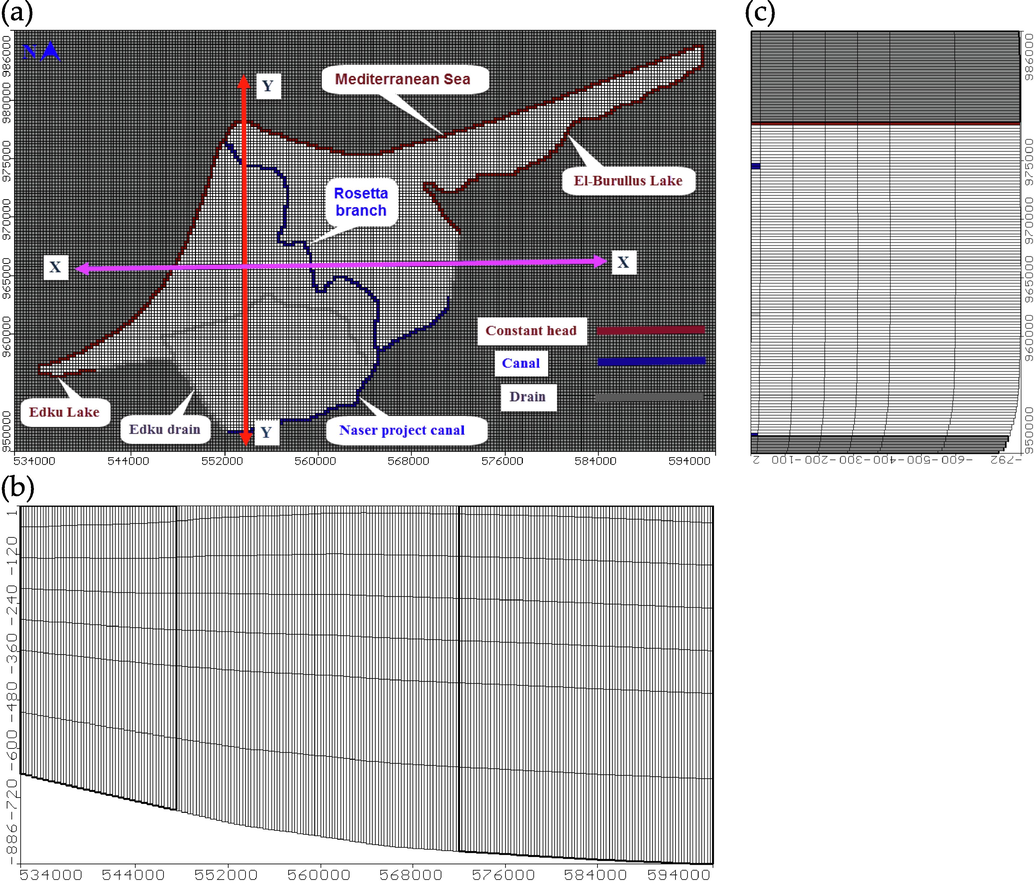
Model of the study area a) Geometry with boundary conditions; b) Cross section in X – direction and (c) Cross section in Y – direction.
3.3.2 Model boundary conditions, physical and hydraulic parameters
The model boundary is assigned by the constant head of zero head above mean sea level (msl) along the Mediterranean shoreline and El-Burullus Lake, which is a coastal lagoon, located in the central ND with a total area 462 km2, maximum length 60 km, average depth between 75 and 100 cm and maximum width from 6 to 21 km. The east south boundary is assigned by Nemera1 drain and, the east west boundary is assigned by Naser project canal, Edku drain and Edku Lake which have area of 62.78 square kilometers with depth between 50 and 200 cm, also the two cross section in the study area in x and y direction are presented in Fig. 2b and 2c respectively. The model hydraulic parameters for each layer including the hydraulic conductivity in horizontal (Kh) and vertical (Kv) direction, specific storage (Ss), specific yield (Sy), effective (ne) and total porosity (nT) are shown in Table 1. The aquifer recharge is depended on the excess water from the irrigation process, canals seepage and rainfall. The recharge rates in the current study area are about 0.25 mm/day (Morsy, 2009 and (Abd-Elaty et al., 2014). Finally, the regression analysis was performed and the relations were established especially between the groundwater heads GWH and the upward land subsidence by a new regression equation. Also, the prediction of future upward land subsidence was estimated from future GWH as a result of SLR in NDA.
Hydraulic Parameters
Value
unit
Confined layer
Vertical hydraulic conductivity (Kv)
0.01–0.025
(m day−1)
Horizontal hydraulic conductivity (Kh)
0.10–0.25
(m day−1)
Specific storage (Ss)
10–7
m−1
Effective porosity (ne)
40–50
%
Total porosity(nT)
50–55
%
Quaternary aquifer
Vertical hydraulic conductivity (Kv)
0.50–10
(m day−1)
Horizontal hydraulic conductivity (Kh)
5–100
(mday−1)
Specific storage (Ss)
5 × 10⁻³-–0.001
m−1
Specific yield (Sy)
0.15–0.20
–
Effective porosity (ne)
20–30
%
Total porosity(nT)
25–40
%
Longitudinal dispersivity (αL)
250
m
Transversal dispersivity (αT)
25
m
Diffusion coefficient (D*)
10−4
m2day−1
Storativity
0.01–0.001
–
3.4 Model calibration
The difference between the calculated heads by the finite element model and measured heads in field observation well was calculated (Fig. 3a). A total number of 12 observation wells were used in the calibration, the figure indicates the residual range between 0.007 and 0.025 m with root mean square (RMS) is 0.02 m and normalization root mean square is 6.365% where the absolute residual mean is 0.019 m. The GWH and velocity is presented in Fig. 3 b. The calculated GWH in the study area varies from 0.35 m above MSL in the south to zero in the north. According to the basic concept of the direction of groundwater flow from high water head to low ones, the direction of groundwater flow from the south to the north. The minimum velocity at the clay cap layer equals 0.0062 m/day, while the average velocity at the NDA is 0.015 m day−1. One of the important results from the model calibration is water balance for the aquifer to determine the situation of groundwater system, the main components of groundwater system is the constant head, general head, well extraction, river, drain, recharge, lake seepage, stream leakage and change in aquifer storage. The limitations of the current study are the numbers of borehole data and observation wells for the soil investigation and the groundwater monitoring, also the measurements locations for the land subsidence.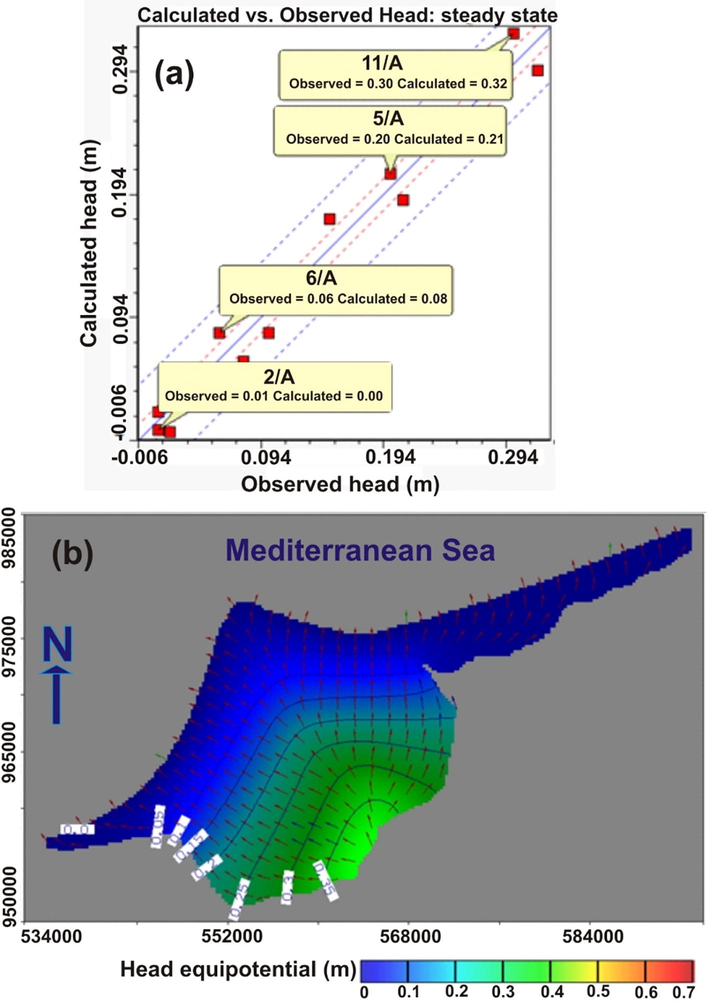
Groundwater results in the study area at base case (2008) for (a) the differences between the observed and calculated heads and (b) Areal view of flow direction.
4 Results and discussion
4.1 Subsurface profile
The Holocene lithofacies are laterally variable, open marine facies are more prominent in the western sector; marsh deposits in the eastern part; delta-front and nearshore/coastal facies in Rosetta promontory (Fig. 4a). Delta front Muds, silts and sands are composed of Yellowish grey to dark grey interbedded muds, silts and sands (B2, B3, B4, B6, B13, and B23 for locations (see Fig. 1).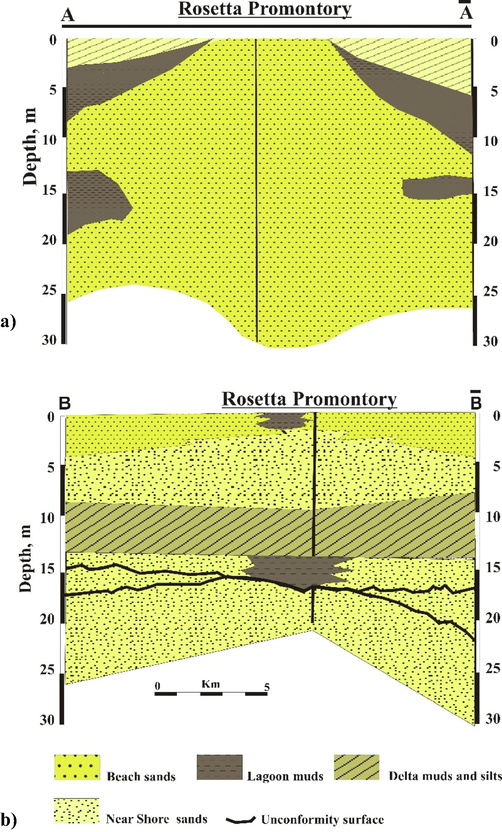
a) Litho-stratigraphic cross section through eastern and western sides of Rosetta Promontory, (for location see Fig. 1) and b) Litho-stratigraphic Cross section through Rosetta mouth showing the quaternary sediments in the study area from the boreholes (B2, B3, B4, B6, B13, and B23) for borehole locations see Fig. 1.
On the other hand, the thickness of lagoon deposits ranges from 2 to 6 m. Silt plain silts are encountered in greyish brown muddy silts. The thickness of silt-plain facies ranges from 2 to 9 m, this facies and considered as overbank deposits. However, Nearshore Marine to Beach sands are composed of yellowish-grey mostly fine to medium-grained sands and ranges from 5 to 36 m in thickness (Fig. 4b).
4.2 Geo-spatial mapping
The study area is dominated mainly by the Holocene sediments, which varied in thickness from 6 m to 40 m with an accumulation rate ranged between 0.0.12 and 0.61 cm/year (Fig. 5a and b). The accumulation rate and thickness of the Holocene sediments are increased from the southern to the northern parts at the Rosetta promontory (Table 2). These increased trends are related to SLR, isostatic upward land subsidence and (or) fault-controlled displacement (Chen et al., 1992). The Holocene thicknesses generally are subparallel to the present-day coast and gradually thicken seaward up to 40 m (Fig. 5a).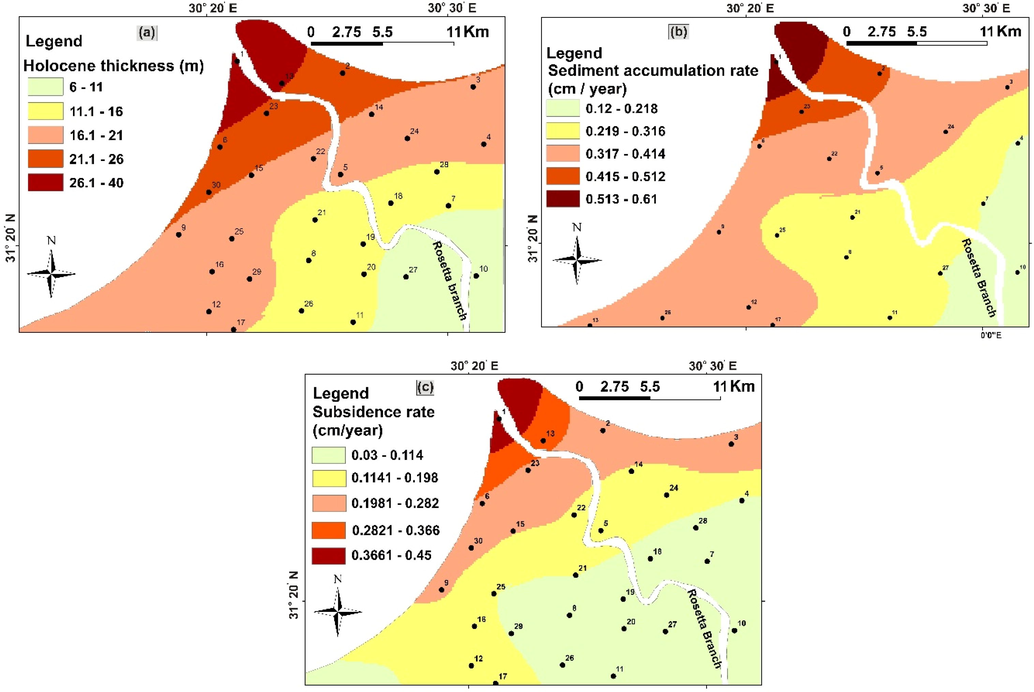
Study area parameters for a) Holocene thickness distribution geo-spatial map, b) Sediment accumulation distribution geo-spatial map, and c) Upward land subsidence distribution geo-spatial map.
Well
Groundwater Head, (m)
Accumulation
(Cm/year)Thickness (m)
Subsidence (cm/year)
Base
2020
2040
2060
Base
2020
2040
2060
1
0.05
0.10
0.18
0.30
0.61
40.00
0.45
0.10
0.10
0.06
2
0.10
0.15
0.23
0.34
0.29
23.00
0.13
0.10
0.08
0.04
3
0.15
0.19
0.27
0.37
0.24
19.00
0.12
0.09
0.07
0.03
4
0.23
0.27
0.33
0.42
0.22
17.00
0.07
0.07
0.04
0.01
5
0.28
0.33
0.39
0.47
0.22
17.00
0.06
0.05
0.02
−0.01
6
0.10
0.15
0.23
0.34
0.25
25.00
0.15
0.10
0.08
0.04
7
0.34
0.38
0.44
0.51
0.15
8.00
0.04
0.03
0.01
−0.02
8
0.29
0.33
0.39
0.47
0.19
14.00
0.07
0.05
0.02
−0.01
9
0.12
0.17
0.24
0.34
0.25
20.00
0.11
0.10
0.08
0.04
10
0.39
0.43
0.48
0.55
0.15
8.00
0.04
0.01
−0.01
−0.04
11
0.36
0.40
0.45
0.52
0.17
12.00
0.05
0.02
0.00
−0.03
12
0.23
0.27
0.34
0.42
0.25
17.00
0.08
0.07
0.04
0.01
13
0.10
0.15
0.23
0.34
0.28
26.00
0.14
0.10
0.08
0.04
14
0.19
0.23
0.31
0.40
0.24
18.00
0.09
0.08
0.05
0.02
15
0.18
0.22
0.30
0.39
0.23
17.00
0.09
0.08
0.06
0.02
16
0.20
0.25
0.31
0.40
0.25
16.00
0.09
0.08
0.05
0.02
17
0.25
0.29
0.35
0.43
0.23
16.00
0.08
0.06
0.04
0.01
18
0.33
0.37
0.43
0.50
0.19
13.00
0.04
0.03
0.01
−0.02
19
0.34
0.38
0.43
0.51
0.18
13.00
0.03
0.03
0.01
−0.02
20
0.35
0.39
0.44
0.51
0.14
12.00
0.03
0.02
0.00
−0.02
21
0.28
0.32
0.38
0.46
0.17
11.00
0.05
0.05
0.03
0.00
22
0.22
0.27
0.33
0.42
0.24
18.00
0.10
0.07
0.04
0.01
23
0.13
0.18
0.26
0.36
0.27
25.00
0.14
0.10
0.07
0.03
24
0.22
0.26
0.33
0.42
0.22
16.00
0.07
0.07
0.04
0.01
25
0.20
0.24
0.31
0.40
0.22
14.50
0.08
0.08
0.05
0.02
26
0.30
0.34
0.39
0.47
0.16
12.00
0.05
0.04
0.02
−0.01
27
0.42
0.46
0.51
0.58
0.12
6.00
0.03
0.00
−0.02
−0.05
28
0.27
0.31
0.37
0.46
0.17
13.00
0.06
0.05
0.03
0.00
29
0.23
0.28
0.34
0.42
0.20
12.00
0.06
0.06
0.04
0.01
30
0.14
0.19
0.26
0.36
0.24
23.00
0.13
0.10
0.07
0.03
The geospatial distribution map of the upward land subsidence shows a general increase to the northern part at the Rosetta Promontory, which has the highest thickness and accumulation rates of the Holocene deposits. Accordingly, the land subsidence rates in the study area varied between 0.03 and 0.45 cm/y with an average value of 0.09 cm/y (Fig. 5c). The land subsidence in the study area (a part of the Mediterranean coastal margins) is caused by the compaction of the Holocene sediments and marine deposits and removal of hydrocarbons and groundwater (Stanley, 1988; Ericson et al., 2006). It is also may be attributed to the decline of the Nile flow because of the climate change and hydrological shift of the Holocene (Marriner et al., 2013). Stanley and Clemente (2017) stated the increased number of the constructed dams through the last two centuries has a direct relation to the subsidence rate in the ND coastal area. Groundwater abstraction is also one of the reasons for upward land subsidence in the coastal area.
4.3 Regression analysis
The relationship between the groundwater head and the upward land subsidence shows the highest correlation coefficients (r2 = 0.87) and with an inverse relationship as shown in Fig. 6a. Also inverse relationship was founded between the GWH and the sediment accumulation rate with high correlation coefficients ((r2 = 0.83), but less than with the upward land subsidence (Fig. 6b). Likewise, the high inverse relationship was detected between the GWH and the thickness of these sediments where the correlation coefficient was ((r2 = 0.82) as shown in (Fig. 6c). These correlation coefficients (r2) show strong relationships especially in the case of upward land subsidence values with the following equations:
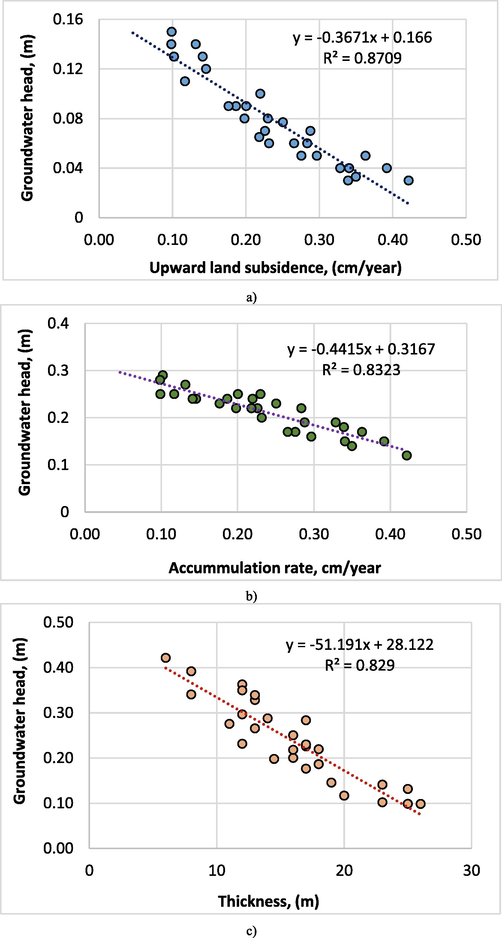
Relationships between the GWH and a) upward land subsidence, b) sediment accumulation rate, and c) the Holocene thickness.
Precisely, these relationships with high least-square linear regression analysis will help to predict the upward land subsidence values for future scenarios GWH values with high confidence by using the above equations.
4.4 Impact of SLR on groundwater head
This scenario is applied by increasing the sea level by 5.67, 14.51 and 26.71 cm for year 2020, 2040 and 2060, where the expected values are calculated based on the published value by Abd-elaty et al. (2019). Fig. 7 shows the results of these scenarios, which indicated that increased sea levels corresponds to increased GWH. The heads of groundwater ranged between 0 to +0.40, 0 to +0.45 and 0 to +0.55 cm for 2020, 2040 and 2060 respectively. The spatial distribution of the predicted upward land subsidence rates in the study area shows a general increasing trend toward the coastline through the three predicted periods (2020, 2040 and 2060), with the highest values recorded at the Rosetta promontory. It is also observed that the rate of subsidence decreased from the year 2020 to the year 2060, ranging from +0.00 to 0.1, −0.02 to 0.1 and −0.05089 to 0.0610 for years 2020, 2040 and 2060 respectively (Fig. 8).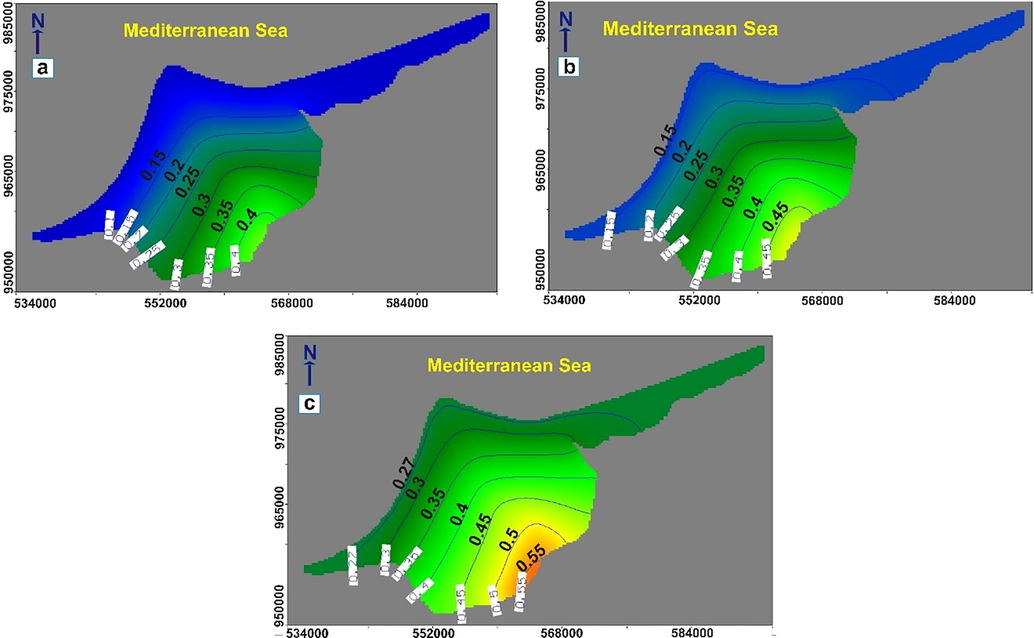
Prediction groundwater heads in the study area with the future Scenarios for years 2020, 2040 and 2060.
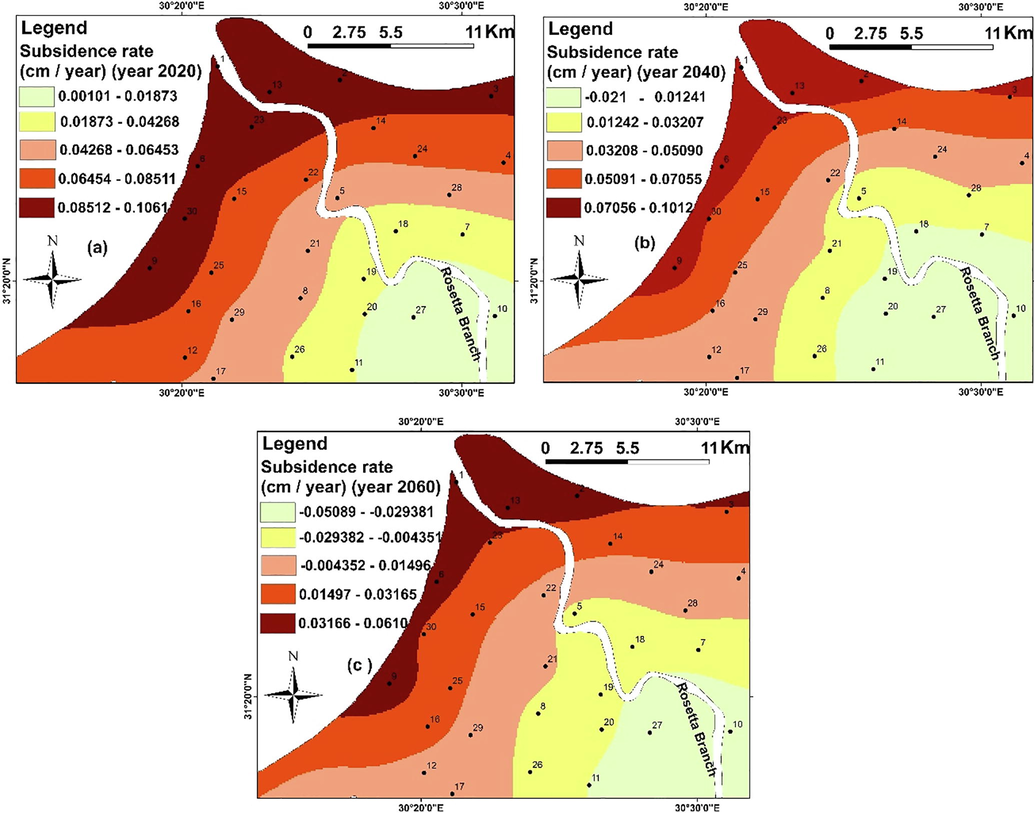
Geo-spatial distribution for the predicted upward land subsidence rates in the study area by the regression equation; a) year 2020; b) year 2040 and c) year 2060.
However, reverse relation was observed between the predicted hydraulic head and the predicted subsidence rates in the study area, where the hydraulic head increase as a result of sea level, rise the rate of subsidence decreased.
5 Conclusion
Land subsidence in coastal areas due to sea level rise is natural hazard facing the development of infrastructures waterways networks, irrigation structures, drainage networks, roads and building. This study used utilized the upward land subsidence according to the current heads of groundwater to estimate the future upward land subsidence based on the expected change of groundwater heads as a result of the possible impact of SLR. The numerical model of SEAWAT is applied for the Nile delta aquifer at the outlet of the Nile Rosetta branch to simulate the GWH for the current situation and the future scenarios of SLR. The expected SLR is by 5.67, 14.51 and 26.71 cm for year 2020, 2040 and 2060 respectively. The results showed that rise in sea levels increased the GWH in the study area. The expected rises in GWH are used in estimating the future upward land subsidence using the developed regression analysis. The predicted upward land subsidence rates for the years 2020, 2040 and 2060 increased from the southern to the northern parts of the study area at Rosetta promontory. A decreasing trend was observed for the predicated upward land subsidence values with increasing groundwater heads due to SLR. Occasionally, the obtained equations with high correlation coefficients will help to predict the upward land subsidence values for future scenarios groundwater head with high confidence. The GWH were then used to predict the future upward land subsidence by applying high least square linear regression analysis. Finally, estimation of the upward land subsidence due to SLR can be consider for the future management and planning of the infrastructures and helps the decision and designer makers in the future development.
Declaration of Competing Interest
The authors declare that they have no known competing financial interests or personal relationships that could have appeared to influence the work reported in this paper.
References
- Simulation-based solutions reducing soil and groundwater contamination from fertilizers in Arid and Semi-Arid regions: case study the Eastern Nile Delta, Egypt. Int. J. Environ. Res. Public Health. 2020;17(24):9373.
- [CrossRef] [Google Scholar]
- Clay mineralogy and the recent evolution of the north-central Nile delta, Egypt. J. Coast. Res.. 1991;7:317-329.
- [Google Scholar]
- Study of impact climate change and other on groundwater system in Nile Delta Aquifer. Egypt. J. Eng. Sci. Technol., Zagazig University, Faculty of Engineering. 2014;17(4):2061-2079.
- [Google Scholar]
- Effects of climate change on the design of subsurface drainage systems in coastal aquifers in arid/semi-arid regions: Case study of the Nile delta”. Sci. Total Environ. J.. 2019;672:283-295.
- [Google Scholar]
- Analytical solution of saltwater intrusion in coastal aquifers considering climate changes and different boundary conditions. Water. 2021;13:7.
- [CrossRef] [Google Scholar]
- Evaluation of potential impact of Grand Ethiopian Renaissance Dam on Seawater Intrusion in the Nile Delta Aquifer. Int. J. Environ. Sci. Technol.. 2019;16:2321-2332.
- [CrossRef] [Google Scholar]
- Simulation of seawater intrusion in the Nile Delta aquifer under the conditions of climate change. Hydrol. Res.. 2016;47(6):1198-1210.
- [CrossRef] [Google Scholar]
- Geoengineering properties of calcareous and quartzite sand collected from west Alexandria coastal line and abo rawash quarry area. Int. J. Sci. Eng. Res.. 2013;4(11):934-943.
- [Google Scholar]
- Deposits in the Nile Valley and the Delta. Government Press, Cairo Geological Survey of Egypt; 1954. p. :311.
- Geoelectrical and geotechnical investigations at tenth of Ramadan city, Egypt - A structure- Based (SB) model application. In: Near Surface Geoscience 2014–20th European Meeting of Environmental and Engineering Geophysics. 2014.
- [Google Scholar]
- Late quaternary evolution of the Northwestern Nile Delta between the Rosetta Promontory and Alexandria, Egypt. J. Coast. Res.. 1992;8(3):527-561.
- [Google Scholar]
- The impact of sea level rise on developing countries: a comparative analysis. Clim. Change. 2009;93(3-4):379-388.
- [CrossRef] [Google Scholar]
- Geologic Interpretation of Satellite Images for West Nile Delta Area, Egypt. Cairo, Egypt: Remote Sensing Research Project. Academy of Scientific Research and Technology; 1975.
- Land subsidence and environmental threats in coastal aquifers under sea level rise and over-pumping stress. J. Hydrol.. 2022;608:127607.
- [CrossRef] [Google Scholar]
- Appraisal for the environment, weathering and provenance of upper cretaceous-lower tertiary shales, western desert, Egypt. Acta Mont. Slovaca. 2021;26(1):171-184.
- [Google Scholar]
- Geotechnical aspects of flood plain deposits in south east Aswan City, Egypt. ARPN J. Eng. Appl. Sci.. 2015;10(8):3490-3497.
- [Google Scholar]
- Effective Sea-level Rise and Deltas: Causes of Change and Human Dimension Implications. Global Planet. Change. 2006;50(1-2):63-82.
- [Google Scholar]
- ESRI (2007). ArcGIS 10.1 Software and user manual. Environmental Systems Research Institute, Redlands, CA. http://www.esri.com.
- ESRI, (2020b). What is empirical bayesian kriging?—ArcGIS Pro. Accessed. https://pro.arcgis.com/en/pro-app/help/analysis/geostatistical-analyst/what-is-empirical-bayesian-kriging-.htm.
- The impact of human activities on the erosion and accretion of the Nile Delta coast. J. Coastal Res.. 1995;11:821-833.
- [Google Scholar]
- Evaluation of future land-use planning initiatives to shoreline stability of Egypt’s northern Nile delta. Arab. J. Geosci.. 2017;10:109.
- [CrossRef] [Google Scholar]
- Detection of aquifer system compaction and land subsidence using interferometric synthetic aperture radar, Antelope Valley, Mojave Desert, California. Water Resour. Res.. 1998;34(10):2573-2585.
- [Google Scholar]
- Assessing land deformation and sea encroachment in the Nile Delta: A radar interferometric and inundation modeling approach. J. Geophys. Res. Solid Earth. 2018;123(4):3208-3224.
- [CrossRef] [Google Scholar]
- Assessing land deformation and sea encroachment in the Nile Delta: a radar interfer-ometric and inundation modeling approach. J. Geophys. Res.-Solid Earth. 2018;123(4):3208-3224.
- [Google Scholar]
- Guo W, Langevin C (2002) User’s Guide to SEAWAT: A Computer Program for Simulation of Three-Dimensional Variable-Density Groundwater Flow. Techniques of Water-Resources Investigations Book 6, Chapter 7, P 77.
- Vulnerability and risk of deltaic social-ecological systems exposed to multiple hazards. Sci. Total Environ.. 2018;631–632:71-80.
- [CrossRef] [Google Scholar]
- Higazy R, Naguib A(1985) in Proc. U.N. 2nd Int. Conf. Peaceful Uses of Atomic Energy, Geneva, September 2, pp. 658-662.
- Alarming coastal vulnerability of the deltaic and sandy beaches of North Africa. Sci. Rep.. 2021;11:2320.
- [CrossRef] [Google Scholar]
- Clay swelling of Quaternary and Paleogene deposits in the south-eastern flanks of West Siberian iron ore basin. IOP Conf. Series: Earth Environ. Sci.. 2016;33(1):012041
- [CrossRef] [Google Scholar]
- Krivoruchko K. (2012). Modeling contamination using empirical bayesian kriging, ArcUser Fall 2012.
- Spatio-temporal variations of fluoride in the groundwater of Dindigul district, Tamil Nadu, India: a comparative assessment using two interpolation techniques. In: Venkatramanan S., Viswanathan P.M., Chung S.Y., eds. GIS and Geostatistical Techniques for Groundwater Science. Amsterdam: Elsevier; 2019. p. :283-296.
- [Google Scholar]
- Tracking Nile Delta vulnerability to Holocene change. PLoS ONE. 2013;8(7)
- [CrossRef] [Google Scholar]
- Human impact on coastal resilience along the coast of Veracruz, Mexico. J. Coastal Res.. 2017;77:143-153.
- [Google Scholar]
- Gridded population projections for the coastal zone under the Shared Socioeconomic pathways. Glob. Planet. Change. 2016;145:57-66.
- [Google Scholar]
- Environmental Management to Groundwater Resources for Nile Delta Region. Egypt: Faculty of Engineering, Cairo University; 2009. PhD Thesis
- Naymushina O., Shvartsev S., Zdvizhkov M., El-Shinawi A. (2010). Chemical characteristics of swamp waters: A case study in the Tom River basin, Russia. Water-Rock Interaction - Proceedings of the 13th International Conference on Water-Rock Interaction, WRI-13: 955–958.
- Negm A, Sakr S, Abd-Elaty I, Abd-Elhamid H (2018) An overview of groundwater resources in Nile Delta Aquifer. In: Negm A. (eds) Groundwater in the Nile Delta. The Handbook of Environmental Chemistry, vol 73. Springer, Cham. https://doi.org/10.1007/698_2017_193.
- Bridging the marine– terrestrial disconnect to improve marine coastal zone science and management. Mar. Ecol. Prog. Ser.. 2011;434:203-212.
- [Google Scholar]
- Subsidence in the northeastern Nile Delta: rapid rates, possible causes and consequences. Science. 1988;240(4851):497-500.
- [Google Scholar]
- Sea level and initiation of predynastic culture in the Nile Delta. Nature. 1993;363:435-438.
- [CrossRef] [Google Scholar]
- Increased land subsidence and sea-level rise are sub-merging Egypt’s Nile Delta coastal margin. GSA Today. 2017;27:4-11.
- [Google Scholar]
- MT3DMS A modular Three-Dimensional Multi Species Transport Model for Simulation of Advection, Dispersion and Chemical Reactions of Contaminants in Groundwater Systems: Documentation and user’s guide. In: U.S. Army Engineer Research and Development Center Contract Report SERDP-99-1, Vicksburg, MS. 1999.
- [Google Scholar]


