

Translate this page into:
Genomic insights into the diversity of mango cultivars in Saudi Arabia: Fluorescent SSR marker analysis
-
Received: ,
Accepted: ,
This article was originally published by Elsevier and was migrated to Scientific Scholar after the change of Publisher.
Abstract
Objectives
This study presents a comprehensive genetic analysis of twelve mango cultivars from Saudi Arabia, investigating their genetic diversity, population structure, and potential loci under selection.
Methods
Utilizing ten SSR loci, we conducted a thorough assessment of allele variation, revealing diverse patterns across loci and defined genetic diversity among cultivars.
Results
Notably, certain loci exhibited extensive allele diversity, with Loci M02 and M06 displaying five and seven alleles, respectively, while others showed more limited profiles, such as Locus M01 with only two alleles. Surprisingly, clustering patterns based on genetic relatedness did not consistently align with anticipated geographic groupings, suggesting additional factors influencing genetic structure beyond geography. Further analysis of allele sharing provided insights into the genetic relatedness among cultivars, highlighting both close genetic affinities and significant divergence. Subsequent Allele Sharing Matrix analysis unveiled sub-clustering within clusters, revealing finer-scale genetic structures within the population. Assessment of genetic differentiation using Analysis of Molecular Variance demonstrated significant variations among clusters and individuals, with variations among clusters ranging from 3% to 53%. Additionally, testing for loci under selection identified potential markers, such as locus M11, with observed heterozygosity greater than expected (1.024) and a relatively low observed FST value of 0.2695.
Conclusions
Overall, our findings contribute to the characterization of mango genetic resources in Saudi Arabia, providing crucial information for breeding programs, germplasm conservation efforts, and agricultural practices. By leveraging advanced genomic technologies and interdisciplinary collaborations, future research can delve deeper into the genetic basis of adaptive traits and agronomic characteristics, paving the way for innovative strategies to enhance mango production and sustainability in Saudi Arabia.
Keywords
Mango cultivars
Saudi Arabia
Fluorescent SSR markers
Genetic diversity
Population structure
Germplasm conservation

Data availability
Data will be made available on request.
1 Introduction
Molecular marker-based techniques offer efficient tools for genetic analysis, enabling precise identification, characterization, and conservation of genetic resources (Salgotra and Chauhan, 2023). Simple Sequence Repeat (SSR) markers, also known as microsatellites, represent highly informative molecular tools extensively employed for genetic analysis due to their abundance, co-dominance, reproducibility, and high polymorphism (He et al., 2021; Xing Li et al., 2022; Srivastav et al., 2021). Recent advancements in molecular marker technology, particularly fluorescent Simple Sequence Repeat (SSR) markers, have revolutionized genetic analysis and variety identification across a wide range of plant species, facilitating high throughput genotyping and multiplexing (Azizi et al., 2021; Testolin et al., 2023). By harnessing these techniques, researchers have gained deeper insights into the genetic makeup of various crops, including grapevine, cherry, and maize, underscoring the effectiveness of fluorescent SSR markers in genetic analysis and variety identification (Azizi et al., 2021; Castellana et al., 2020; Gómez-Rodríguez et al., 2021; Kumar et al., 2020). Furthermore, the versatility of SSR markers has been demonstrated across diverse crops such as sugarcane, mango, sorghum, and rice (He et al., 2021; Iqbal et al., 2023; Xiaxia Li et al., 2022).
Researchers have highlighted the significance of employing DNA molecular fingerprints constructed with fluorescent SSR markers as an effective means of probing genetic diversity and identifying cultivars in crops (Basile et al., 2023; Ramesh et al., 2020). The capacity for high-throughput genotyping offered by fluorescent SSR markers has been particularly emphasized, showcasing the potential for efficient and accurate analysis of extensive germplasm collections in crops such as Michelia and melon (Gómez-Rodríguez et al., 2021; Mishra et al., 2019; Ordidge et al., 2021). Moreover, the integration of capillary electrophoresis with fluorescent-labeled SSR markers has proven highly effective in identifying and analyzing cherry cultivars and sugarcane genotypes (Safhi et al., 2023; Hu et al., 2023; Xing Li et al., 2022, p. 202; Zhao et al., 2020).
One of the key roles of alleles and loci in genetic analysis is in their contribution to the phenotypic properties of plant species. Alleles are different forms of a gene that arise by mutation, and loci refer to the specific locations of genes on chromosomes. In mango cultivars, different alleles at SSR loci can influence traits such as fruit size, shape, flavor, and resistance to diseases. The diversity of alleles across loci enables breeders to select for desirable traits in breeding programs (Bura et al., 2023; Sah et al., 2023).
The existing literature substantiates the utility of fluorescent SSR fingerprinting for genetic analysis and variety identification in plant species, making it a suitable approach for investigating cultivated mango cultivars in Saudi Arabia (Zahid et al., 2022). By leveraging the insights and methodologies gleaned from prior studies, research on mango cultivars can benefit from established protocols and best practices in the application of fluorescent SSR markers (Bura et al., 2023; Sah et al., 2023). Mango, scientifically known as Mangifera indica L., represents a tropical fruit tree extensively cultivated for its high nutritional value and economic significance within the Anacardiaceae family (Lebaka et al., 2021). Although native to South Asia, mango has been successfully introduced and adapted to various tropical and subtropical regions worldwide (Wang et al., 2020). Despite Saudi Arabia's arid climate, the country has emerged as a key mango producer, owing to advanced agricultural practices, irrigation techniques, and the introduction of well-suited cultivars. The cultivation of mangoes in Saudi Arabia has witnessed diversification with the introduction of various mango cultivars from different geographical regions (A. A. Hussein et al., 2023; Abdelbaki and Alzahrani, 2024). However, accurate identification and characterization of mango cultivars often pose challenges due to morphological variations influenced by environmental factors and cultural practices.
In this study, our aim was to investigate the genetic diversity and relationships among twelve cultivated mango cultivars in Saudi Arabia utilizing fluorescent SSR fingerprinting. By employing a panel of ten SSR markers, our objective was to elucidate the genetic structure of these cultivars and provide valuable insights for mango breeding programs, germplasm conservation, and sustainable mango production in Saudi Arabia. The selection of mango cultivars for this study was based on their economic importance and potential for genetic improvement. The adoption of fluorescent SSR fingerprinting streamlines the process of detecting genetic variation in mango cultivars by expediting the speed and precision of SSR analysis.
2 Material and methods
2.1 Plant Material and DNA extraction
Leaf samples were collected from twelve cultivated mango cultivars grown in different regions of Saudi Arabia. These cultivars were selected based on their economic importance, geographical distribution, and representation of genetic diversity within Saudi mango cultivars. According to local names, the sampled cultivars included Pakistani (S01), Tommy Atkins (S02), Sudanese (S03), Timor – Yemen (S04), Honey Pakistani (S05), Sindhri – Pakistan (S06), Awaisi Egyptian (S07), Indian (S08), Thai (S09), Langra − Indian (S10), Zebda Egyptian (S11), and Fons American (S12) mango cultivars.
To test the effect of the cultivar origin on the detected diversity, these cultivars were grouped into two categories based on their hypothesized-by-name geographic origin: Group 1 – Asian Cultivars (S01, S5-S6, and S8-S10), Group 2 – Middle Eastern Cultivars (S03-S4, S7, and S11), and Group 3 – North American Cultivars (S2, and S12).
Genomic DNA was extracted from the collected leaf samples using a modified CTAB (cetyltrimethylammonium bromide) method (Doyle, 1991). The quality of the extracted DNA was assessed using 1.5% agarose gel electrophoresis.
2.2 Genotyping with fluorescent SSR fingerprinting
2.2.1 SSR marker selection
A panel of 15 fluorescently labeled SSR loci was selected for genotyping the mango cultivars (Table 1; (Schnell et al., 2005)). The SSR markers were chosen based on their polymorphic nature and previously reported utility in mango genetic studies (Arumuganathan and Earle, 1991; Hu et al., 2023; Xiaxia Li et al., 2022; Ordidge et al., 2021; Zietkiewicz et al., 1994).
Marker code
Original name
Direction
5′-Sequence-3′
Repeat
Tm
Fluorochrome
Expected allele size
M01
MiSHRS-1
F
TAACAGCTTTGCTTGCCTCC
(CT/AG)14
50
CY3
191–207
R
TCCGCCGATAAACATCAGAC
M02
MiSHRS-4
F
CCACGAATATCAACTGCTGCC
(CT/AG)11
57
HEX
121–131
R
TCTGACACTGCTCTTCCACC
M03
MiSHRS-18
F
AAACGAGGAAACAGAGCAC
(AAC/GTT)8
50
CY3
90–111
R
CAAGTACCTGCTGCAACTAG
M04
MiSHRS-23
F
AGGTCTTTTATCTTCGGCCC
(TATG/CATA)7
65
HEX
199–203
R
AAACGAAAAAGCAGCCCA
M05
MiSHRS-26
F
TGTAGTCTCTGTTTGCTTC
(GTT/AAC)6
57
6-FAM
260–275
R
TTCTGTGTCGTCAAACTC
M06
MiSHRS-29
F
CAACTTGGCAACATAGAC
(TG/CA)9
46
6-FAM
174–182
R
ATACAGGAATCCAGCTTC
M07
MiSHRS-30
F
AGAATAAAGGGGACACCAGAC
(GTTGTGT/
ACACAAC)3
51
CY3
222
R
CCATCATCGCCCACTCAG
M08
MiSHRS-32
F
TTGATGCAACTTTCTGCC
(CA/TG)9
53
HEX
200–224
R
ATGTGATTGTTAGAATGAACTT
M09
MiSHRS-33
F
CGAGGAAGAGGAAGATTATGAC
(CGG/CCT)7
46
HEX
236–248
R
CGAATACCATCCAGCAAAATAC
M10
MiSHRS-34
F
TGTGAAATGGAAGGTTGAG
(GTT)5GCA(GTT)5
46
6-FAM
228
R
ACAGCAATCGTTGCATTC
M11
MiSHRS-36
F
GTTTTCATTCTCAAAATGTGTG
(CT/AG)15
50
CY3
174–190
R
CTTTCATGTTCATAGATGCAA
M12
MiSHRS-37
F
CTCGCATTTCTCGCAGTC
(AG/CT)9
46
CY3
127–132
R
TCCCTCCATTTAACCCTCC
M13
MiSHRS-39
F
GAACGAGAAATCGGGAAC
(GTT/AAC)8
53
HEX
348–369
R
GCAGCCATTGAATACAGAG
M14
MiSHRS-44
F
AACCCATCTAGCCAACCC
(TC/GA)11(TA)10
(CA/TG)9
(TA)3(CA/TG)3
57
6-FAM
253–260
R
TTGACAGTTACCAAACCAGAC
M15
MiSHRS-48
F
TTTACCAAGCTAGGGTCA
(GA/TC)15
57
6-FAM
201–226
R
CACTCTTAAACTATTCAACCA
2.2.2 PCR amplification and detection
PCR amplification of the selected SSR loci was performed using the extracted genomic DNA as a template. PCR reactions were conducted in a total volume of 20 μL containing 50 ng of DNA, 0.2 μM of each primer, 200 μM of each dNTP, 1.5 mM MgCl2, 1x PCR buffer, and 1 unit of Taq DNA polymerase. The PCR cycling conditions consisted of an initial denaturation at 94°C for 5 min, followed by 35 cycles of denaturation at 94°C for 30 s, annealing at 60°C for 30 s, extension at 72°C for 45 s, and a final extension at 72°C for 7 min. Following this, 2 µL of each PCR product was prepared in a dilution of 1:20 in distilled water and added to 12.5 µL of Hi-Di™ formamide and 0.25 µL of Genescan™ − 500 LIZ™ size standard. Fragment analysis was carried out using capillary electrophoresis on an automated DNA sequencer (ABI 3730xl).
2.2.3 Data analysis
Allele sizes obtained from the fluorescent SSR fingerprinting were scored using Peakscanner software. The resulting data matrix containing allele sizes for each SSR locus in each mango variety was used for further analysis. Genetic diversity parameters, including the number of alleles per locus, observed heterozygosity, expected heterozygosity, and polymorphism information content (PIC), were calculated using GenAlEx (Peakall and Smouse, 2012) software. Structure analysis and population assignment were used to infer the potential clustering of the 12 cultivars into homogeneous groups using STRUCTURE (Hubisz et al., 2009) and GenAlEx, respectively. Correlation heatmap was performed using ClustVis website. Analysis of Molecular Variance (AMOVA) presented in form of percentage of genetic variation among clusters, sub-clusters, and individuals within mango cultivars across ten SSR loci was performed using GenAlEx.
3 Results
3.1 Genetic diversity analysis
Genetic diversity analysis was conducted to assess the variation present among the twelve mango cultivars based on ten loci that were successfully amplified out of the 15 SSR loci. Each locus demonstrates a distinct pattern of genetic diversity, with varying numbers of alleles detected. For instance, Loci M02 and M06 exhibit higher levels of genetic diversity, with five and seven alleles detected, respectively. In Locus M02, allele 182 stands out with the highest frequency (0.41), while in Locus M06, allele 261 dominates with a frequency of 0.33. Conversely, Locus M01 shows relatively lower genetic diversity, harboring only two alleles, with allele 195 being the most frequent (0.75). Loci M14 and M09 also display limited diversity, with three alleles each, and alleles 250 (0.66) and 381 (0.50) exhibiting the highest frequencies, respectively. Notably, Loci M08 and M13 demonstrate considerable genetic variability, each with six and four alleles detected, respectively. Allele 240 prevails in Locus M08 (0.58), while allele 406 dominates Locus M13 (0.58) (Fig. 1).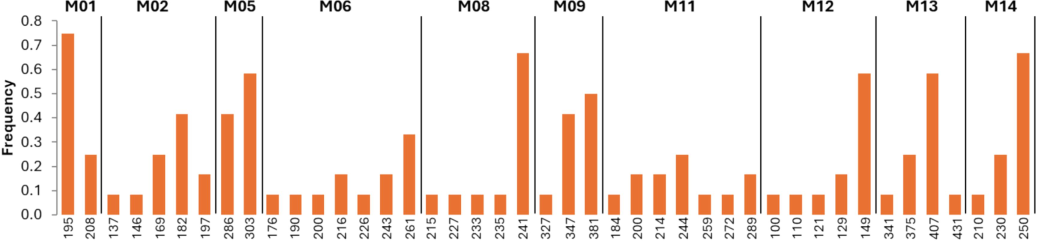
Allele frequency per loci among the 12 mango cultivars.
The 12 mango cultivars were analyzed across ten loci. The unbiased expected heterozygosity across all loci was calculated to be 0.64, with a standard deviation of 0.048, indicating moderate genetic diversity within the population. The observed heterozygosity was recorded as 0.00 across all loci, suggesting an absence of heterozygosity within the sampled individuals for the ten SSR loci. The number of alleles detected across all loci averaged 4.40, with a standard deviation of 1.90, indicating moderate allelic diversity.
The heterozygosity and Polymorphic Information Content (PIC) values across ten SSR loci were estimated among the twelve mango cultivars. Expected heterozygosity measures the likelihood of finding different alleles at a given locus, with higher values indicating greater genetic diversity. Locus M11 exhibits the highest expected heterozygosity (0.87), suggesting extensive allele variation. Conversely, Loci M01, M02, M05, M06, M08, M09, M12, M13, and M14 display lower expected heterozygosities, indicating relatively limited allele diversity. PIC values represent the informativeness of each locus in distinguishing alleles, with higher values indicating greater discriminatory power. Locus M11 again emerges as the most informative locus, with a PIC value of 0.811921296. In contrast, Locus M14 exhibits the lowest PIC value (0.43), suggesting lower discriminatory ability. Observed heterozygosities reflect the proportion of individuals in the population that are heterozygous at a given locus. Surprisingly, all loci show observed heterozygosity values of zero, indicating that no individuals within the population exhibit heterozygosity at these loci (Fig. 2).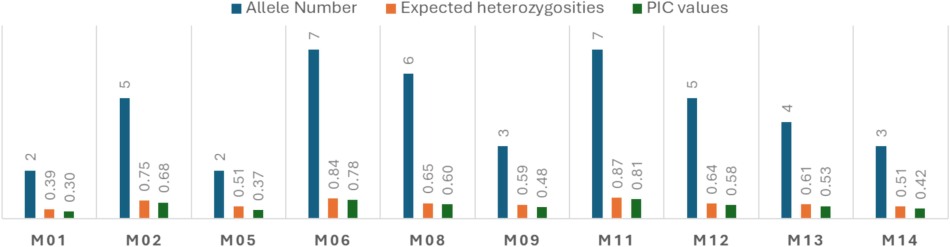
Allele Number, expected heterozygosity, and PIC values estimated for each of the genotyped SSR locus.
3.2 Population structure and relationship among mango cultivars
3.2.1 Distance-based clustering
Population structure analysis was conducted to assess the genetic relatedness among mango cultivars, revealing distinct clustering patterns based on their genetic similarities. Principal Coordinate Analysis (PCoA) further delineated the population structure and genetic differentiation among the cultivars. Notably, the PCoA, with the highest explained variation percentages (axis 1 = 30.34% and axis 2 = 14.71%), indicated the proximity of certain cultivars, such as S1 to S5, S3 to S4, and S6 to S9, while S2 appeared as an outlier (Fig. 3A). Surprisingly, these clustering patterns did not align with the assumed geographical grouping based on the common names of the 12 mango cultivars. Subsequently, STRUCTURE simulation without admixture ancestral models, particularly at k = 2, demonstrated the highest Ln Probability (−141.2) and lowest variance (40.5) among different k values. Cluster 1 (Population 1) comprised samples S1 to S5, whereas cluster 2 (Population 2) included samples S6 to S12 (Fig. 3B). Despite the distinct clusters identified, this grouping did not correspond with the anticipated geographical distribution. Moreover, a population assignment test was performed based on the STRUCTURE outputs, corroborated by the PCoA, which indicated variation explained by axis 1 (30.34%) and axis 3 (11.35%) (Fig. 3C). Interestingly, the confirmed clustering pattern diverged from the expected geographical grouping as well.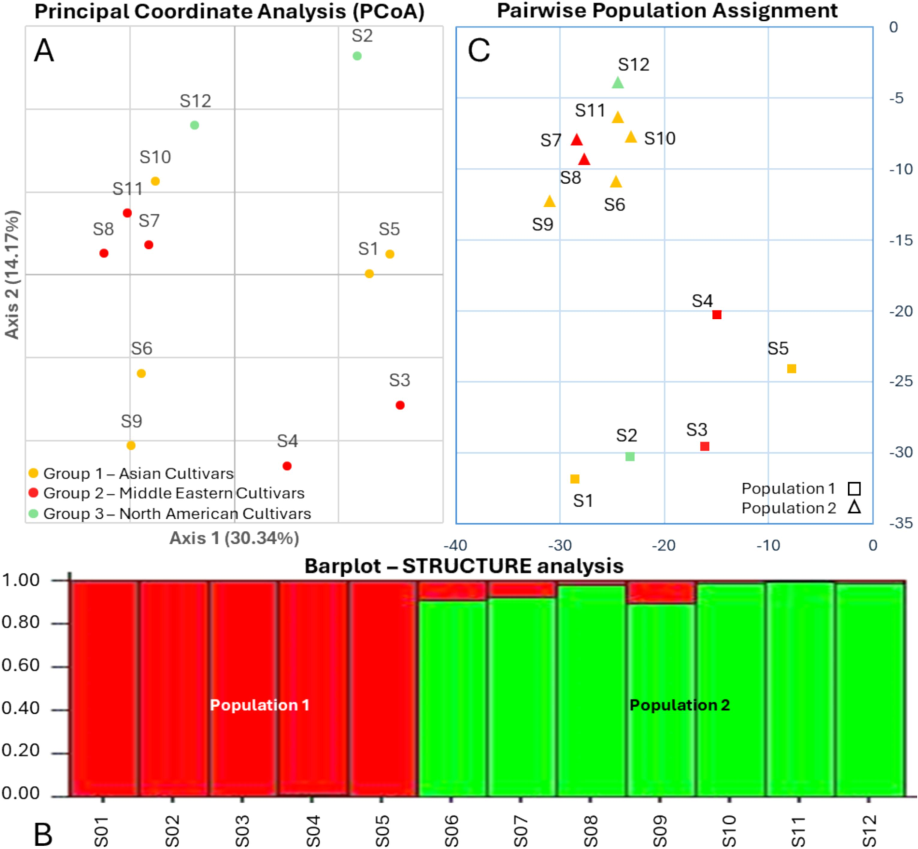
Genetic clustering patterns of mango cultivars based on population structure analysis. (A) Principal Coordinate Analysis (PCoA) plot illustrating the genetic relationships among mango cultivars, with axis 1 explaining 30.34 % and axis 2 explaining 14.71 % of the variation. (B) STRUCTURE simulation at k = 2 revealing two distinct clusters: Cluster 1 (Population 1) comprising samples S1 to S5 and Cluster 2 (Population 2) including samples S6 to S12. (C) Population assignment test based on STRUCTURE outputs.
3.2.2 Allele sharing-based clustering
The Allele Sharing Matrix (ASM) delineates the genetic relatedness among pairs of samples within the studied population, unveiling intriguing patterns of allele sharing. For instance, Sample 1 (S1) shares 100% of alleles with itself, mirroring a pattern observed across all individuals. Conversely, at the opposite end of the spectrum, pairs of samples with the lowest sharing values denote the farthest genetic relatedness. The Allele Sharing Matrix (ASM) analysis reveals distinct patterns of allele sharing among the 12 mango cultivars, indicative of their genetic relatedness. Low shared allele values, denoting minimal genetic similarity, are evident between several cultivar pairs, including S1 and S8, S5 and S9, and S9 and S11. These cultivar pairs exhibit shared allele values close to 0, reflecting significant genetic divergence or distinct genetic lineages. Conversely, high shared allele values, signifying pronounced genetic similarity, are observed in certain cultivar pairs, such as S10 and S11, and S11 and S12, which display shared allele values of 0.9. These findings suggest a close genetic affinity or potential kinship between these cultivars. The contrasting levels of allele sharing underscore the genetic diversity within the mango cultivars, with some cultivars exhibiting close genetic relatedness while others are more genetically distinct. Such insights into allele sharing provide valuable information for breeding programs, germplasm conservation efforts, and elucidating the evolutionary history of mango cultivars. The correlation heatmap based on the ASM data showed the same clustering demonstrated by the distance-based method, however, with additional sub-clustering within each cluster. In the case of cluster 1, the cultivars S1, S2 and S4 were subclustered from the cultivars S3 and S5. While in cluster 2, the cultivars S6-S9 were sub-clustered from the cultivars S10-S12 (Fig. 4).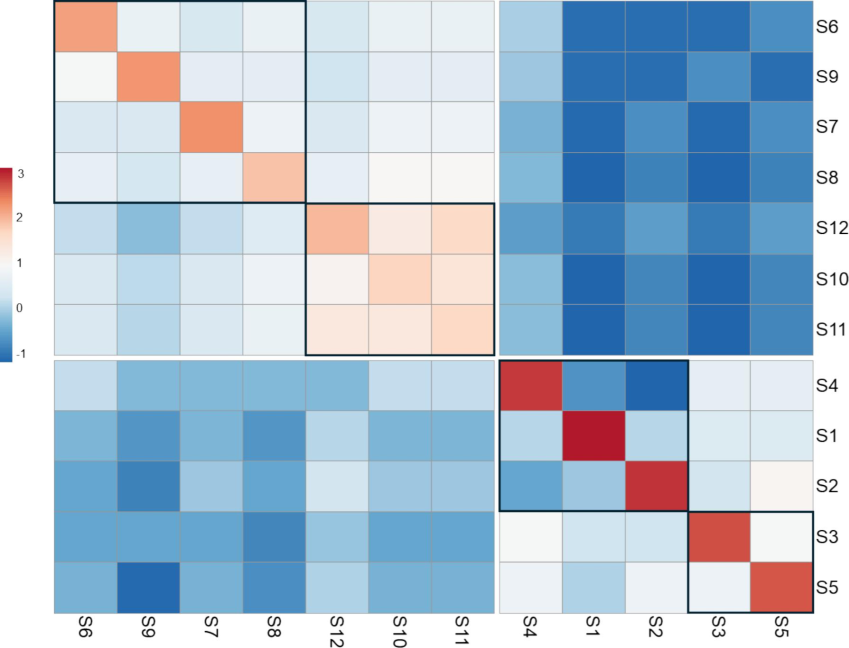
Correlation heatmap based on allele sharing matrix among the 12 mango cultivars. Subclusters are boxed.
3.3 Allelic variation across mango cultivars
The provided allele frequency table offers detailed insights into the genetic composition of 12 mango cultivars across the two distinct populations (Pop1 and Pop2), as delineated by clustering analysis. Observing allele frequencies reveals intriguing patterns of genetic differentiation and shared genetic traits between the populations. Notably, certain alleles exhibit pronounced differences in frequency between Pop1 and Pop2, underscoring population differentiation. In Pop1, allele 195 at Locus M01 was present at a frequency of 100%, contrasting with allele 208, absent in this population but present in Pop2 at 42.9%. Locus M02 displayed allele 137 at 20% in Pop1 and was absent in Pop2. Allele 286 dominated Locus M05 in Pop1 with an 80% frequency, while allele 303 was exclusive to Pop2 at 85.7%. Locus M06 showcased diverse alleles with allele 182 unique to Pop2 (71.4%) and allele 261 primarily in Pop2 (57.1%). In Pop1, allele 215 was found at Locus M08 (20%), while allele 241 dominated at 40% in Pop2. Allele 381 at Locus M09 was exclusive to Pop2 (85.7%). Locus M11 presented varied alleles, including allele 184 in Pop1 (20%) and alleles 244 and 289 unique to Pop2 (42.9% and 28.6%, respectively). Locus M12 featured allele 149 solely in Pop2 (100%). For Locus13, alleles 341 and 375 were distributed in Pop1 (20% and 60%, respectively), whereas allele 407 was exclusive to Pop2 (85.7%). Finally, Locus M14 displayed alleles 230 and 250, with allele 250 dominating Pop2 (85.7%). These distinct allele distributions highlight the genetic diversity and population-specific characteristics among the 12 mango cultivars (Fig. 5).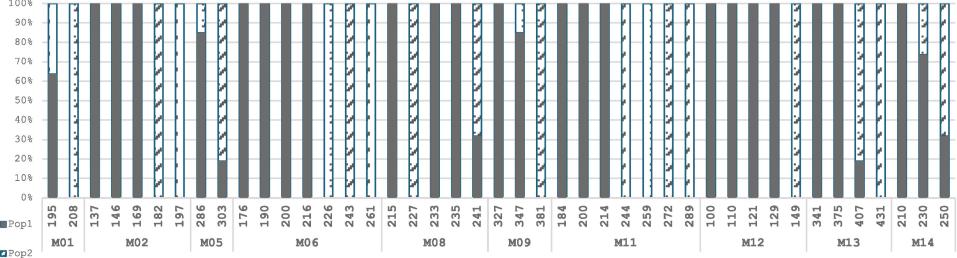
Allele distribution across two populations of mango cultivars. The graph illustrates the allele distribution across the two clusters, Pop1 and Pop2, for 10 loci among mango cultivars. Each locus is represented by specific alleles, with their respective frequencies (%) in each population indicated.
3.4 Genetic differentiation among groups
3.4.1 Analysis of molecular variance by loci
The AMOVA results provide insights into the genetic structure and variation among mango cultivars across different loci. Overall, when considering all loci collectively (Total), a significant portion of the genetic variation is observed among clusters, accounting for 30% of the total variance. This proves the presence of distinct genetic clusters or groups among the mango cultivars.
Delving into individual loci, variations among clusters range from 3% to 53%, with Locus M12 showing the highest variation (53%) among clusters (populations), suggesting pronounced genetic differentiation. Regarding variations among sub-clusters, which could represent finer-scale genetic subdivisions within clusters, the percentages range from 0% to 20%. Loci M09 and M12 exhibit the highest variation among sub-clusters at 20%, indicating some degree of genetic diversity within these clusters. Moreover, variations among individuals within clusters contribute significantly to the total genetic variation, ranging from 27% to 82% across loci. Loci M06 and M14 show the highest variation among individuals within clusters at 73% and 82%, respectively, suggesting substantial genetic diversity within individual cultivars or subgroups. No genetic variation is observed within individuals for all loci, indicating genetic homogeneity within individual mango cultivars. These results collectively highlight the complex genetic structure and diversity among mango cultivars, with significant variations observed both between and within clusters and individual cultivars across different loci (Fig. 6).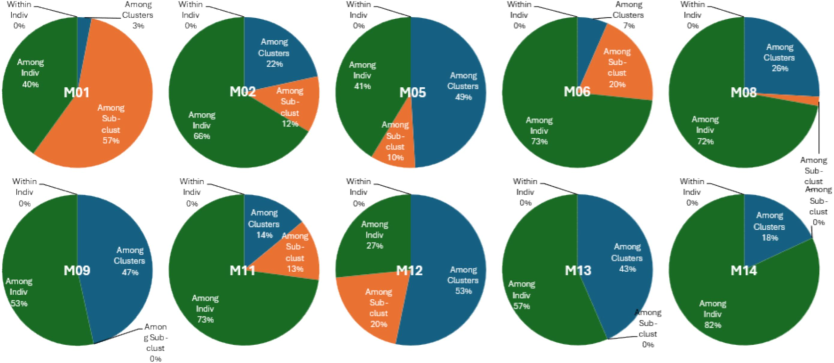
Analysis of Molecular Variance (AMOVA) per loci. Pie charts showing the percentage of genetic variation among clusters, sub-clusters, and individuals within mango cultivars across ten SSR loci.
3.4.2 Analysis of molecular variance by grouping
To assess whether the observed genetic diversity among the 12 mango cultivars correlates with their geographical origins, we conducted AMOVA using three hierarchical schemes: groups hypothesized based on geographic origin, clusters simulated by STRUCTURE software, and clusters/sub-clusters defined by the ASM correlation heatmap. The three AMOVA pie charts illustrate the partitioning of genetic variation among different levels of population structure determined by these methods (Fig. 7). The chart based on hypothesized cultivar groups from their names suggests 18% of total genetic variation lies among these groups, with the majority (82%) within individuals. For clustering estimated by STRUCTURE software, 34% of genetic variation occurs among clusters, indicating substantial differentiation, with 66% within individuals. Considering clusters and sub-clusters from the ASM correlation heatmap, 30% of variation is among regions, 9% among populations, and the majority (61%) within individuals.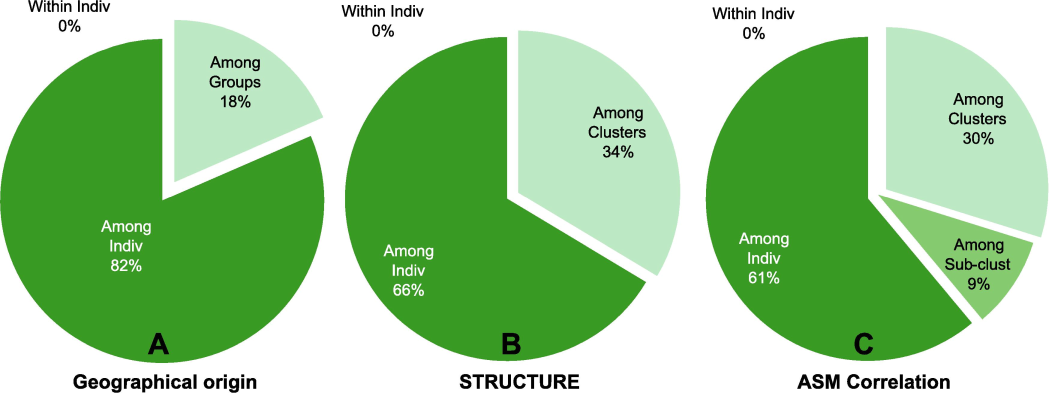
Pie charts representing the proportion of genetic variation within and among individuals for three grouping schemes. (A) based on hypothesized geographic origins; (B) utilizing STRUCTURE software clustering; and (C) considering clusters and sub-clusters detected by ASM correlation heatmap.
Comparatively, AMOVA based on hypothesized cultivar groups shows 82% of genetic variation among individuals within groups, indicating high diversity within named groups. This suggests less homogeneity within groups, questioning the effectiveness of this geographic origin-based grouping scheme. In contrast, clustering estimated by STRUCTURE software reveals a lower proportion of variation among individuals within groups (66%), suggesting capturing underlying genetic structure, leading to more homogenized groups. However, considering clusters and sub-clusters from the ASM correlation heatmap shows even lower variation within individuals (61%). This suggests a higher degree of homogeneity within groups, supporting the notion that this grouping scheme effectively reflects genetic structure. Thus, clustering based on the ASM correlation heatmap provides a more robust and reliable grouping compared to other methods, resulting in less variation within individuals and indicating better-defined and more genetically homogeneous groups irrespective of geographical origin.
3.5 SSR loci under selection
From the Arlequin output, we tested for loci under selection using F-statistics based on a finite island model with 100 simulated demes and 1000 coalescent simulations performed. The analysis was conducted on a single genetic structure with two populations (clusters). The observed heterozygosity and the observed FST values were computed for each locus, along with their corresponding p-values. Loci with FST values significantly different from the neutral expectation (p < 0.05) may indicate potential loci under selection. Among the ten loci tested, several showed notable deviations from neutral expectations. For example, M02 exhibited a highly observed heterozygosity (0.9888) and an observed FST value of 0.4785. However, its FST p-value (0.4908) did not reach statistical significance, suggesting that this locus may not be under selection. In contrast, locus M11 demonstrated an observed heterozygosity greater than expected (1.024) and a relatively low observed FST value of 0.2695. Notably, its FST p-value (0.0471) approached statistical significance, indicating a possible signature of selection at this locus. The observation of significant genetic differentiation at locus M11 could indicate that this locus contributes significantly to the overall genetic variation observed among the populations.
4 Discussion
The genetic analysis conducted on twelve mango cultivars from Saudi Arabia provides critical insights into their genetic diversity, population structure, and potential loci under selection. This study demonstrates the value of fluorescent SSR marker analysis in distinguishing genetic variation and identifying key genetic markers for mango breeding and germplasm conservation (A. A. Hussein et al., 2023; Dawabah et al., 2020; El-Shenawy Ghounim et al., 2022).
The successful amplification of ten SSR loci highlights the robustness of these markers for genetic diversity studies in mango (Schnell et al., 2005), particularly in this geographic region. Despite some loci not amplifying, the markers proved reliable and effective, with potential to be further optimized for more comprehensive genetic studies (A. A. Hussein et al., 2023; Srivastav et al., 2021). These markers represent a valuable tool for future genetic studies and the selection of traits relevant to mango improvement.
The study's findings reveal considerable genetic diversity among the twelve cultivars, with varying numbers of alleles detected across the ten SSR loci. This variability provides a rich genetic resource for mango breeding programs. For instance, loci M02 and M06 showed high allele diversity, which is critical for breeding programs focused on enhancing genetic variability (Iqbal et al., 2023). This diversity underscores the importance of maintaining and exploiting this genetic variation to improve traits such as yield, disease resistance, and environmental adaptability.
Focusing on heterozygosity and the Polymorphic Information Content (PIC) values, Locus M11 emerged as particularly informative. Its high heterozygosity and PIC value suggest it may be under selective pressure, making it a strong candidate for marker-assisted selection (MAS) in mango breeding programs. While other loci exhibited lower heterozygosity, their utility in genetic differentiation and diversity studies remains significant, particularly in facilitating the identification of distinct cultivars. Surprisingly, all loci showed observed heterozygosity values of zero, indicating that no individuals within the population exhibited heterozygosity at these loci (Enyew et al., 2022). These findings indicate the potential application of these markers in breeding programs aimed at increasing genetic diversity and improving the phenotypic traits of mango cultivars.
The study also explored the genetic relationships among the mango cultivars, using Principal Coordinate Analysis (PCoA) to reveal clustering patterns that reflect shared genetic ancestry and differentiation. Interestingly, these patterns did not consistently align with geographic origins, suggesting that factors beyond geography, such as breeding practices and historical cultivation methods, play a role in shaping the genetic structure of these cultivars (Palacio-Mejía et al., 2021). This highlights the importance of considering non-geographic factors when evaluating the genetic diversity and relationships among mango populations.
Analysis of allelic variation across the mango cultivars identifies shared and unique alleles within the population. Shared alleles indicate genetic exchange among cultivars, possibly due to historical migration or breeding practices (A. A. Hussein et al., 2023). The presence of unique alleles in several cultivars emphasizes the need to preserve these distinct genetic traits, which could play an important role in breeding programs and germplasm conservation (Hu et al., 2023; Iqbal et al., 2023). The presence of unique alleles for each detected population highlights the importance of preserving each variety's genetic integrity and forming a nucleus for breeding programs (Alzahrani et al., 2023). The application value of these findings is significant, as they provide a foundation for future research focused on understanding how genetic diversity can be harnessed to improve mango cultivation practices in Saudi Arabia.
The identification of Locus M11 as a locus potentially under selection is particularly noteworthy. The deviation of this locus from neutral expectations suggests that it may be subject to evolutionary pressures or adaptive processes (Magdy et al., 2016). This locus represents a potential target for further investigation into adaptive traits that could be critical for improving mango resilience and productivity in the face of environmental challenges. As such, this study provides an important contribution to the understanding of the genetic mechanisms that drive adaptation and evolution in mango populations (Di Santo, 2022).
This study highlights the application value of fluorescent SSR marker analysis in revealing genetic diversity and relationships among mango cultivars in Saudi Arabia. The ability of these markers to differentiate cultivars and identify key loci under selection underscores their importance for breeding and germplasm conservation efforts. The genetic relationships identified in this study provide a roadmap for future breeding programs, enabling the selection of genetically diverse and resilient cultivars that are better suited to the environmental and agricultural conditions of the region (A. A. Hussein et al., 2023; Alghanem et al., 2023; Iqbal et al., 2023). The identification of distinct genetic clusters facilitates targeted germplasm propagation efforts, ensuring the preservation of unique genetic resources (Flowers et al., 2022).
Future research may focus on exploring the genetic basis of adaptive traits and agronomic characteristics associated with locus M11. Whole-genome sequencing and genomic selection approaches can provide comprehensive insights into the genetic architecture of complex traits, facilitating genotype-phenotype associations for targeted trait improvement (Alghanem et al., 2023). By leveraging advanced genomic technologies and integrating multidisciplinary expertise, future research can drive innovation and sustainability in Saudi mango production, contributing to food security, economic development, and environmental conservation.
5 Conclusion
In conclusion, this study provides a comprehensive analysis of the genetic diversity and population structure of twelve mango cultivars from Saudi Arabia, utilizing fluorescent SSR marker analysis. The results reveal considerable genetic variability among the cultivars, with some loci showing high levels of allele diversity, providing valuable insights for mango breeding and germplasm conservation. The identification of Locus M11 as a potential marker under selection is particularly significant, as it may be associated with adaptive traits that could be important for future breeding programs.
By leveraging fluorescent SSR markers, this study demonstrates the application value of these molecular tools for distinguishing genetic diversity, identifying key genetic markers, and understanding the genetic relationships among mango cultivars. The results of this study provide a foundation for breeding programs aimed at improving the genetic diversity, resilience, and productivity of mango cultivars in Saudi Arabia. Moreover, the identification of shared and unique alleles among cultivars highlights the importance of preserving genetic diversity for future breeding efforts.
Future research should focus on further exploring the genetic mechanisms underlying the adaptive traits associated with Locus M11 and other key loci. Whole-genome sequencing and genomic selection approaches could provide deeper insights into the genetic architecture of important agronomic traits, facilitating the development of improved mango cultivars. This research contributes to the growing body of knowledge on mango genetic resources and has practical implications for breeding, germplasm conservation, and sustainable agricultural practices in Saudi Arabia.
CRediT authorship contribution statement
Fatmah Ahmed Safhi: Writing – review & editing, Writing – original draft, Visualization, Validation, Supervision, Software, Resources, Project administration, Methodology, Investigation, Funding acquisition, Formal analysis, Data curation, Conceptualization.
Funding
This research was funded by Princess Nourah bint Abdulrahman University Researchers Supporting Project number (PNURSP2024R318), Princess Nourah bint Abdulrahman University, Riyadh, Saudi Arabia.
Acknowledgment
The author would like to thank Princess Nourah bint Abdulrahman University Researchers Supporting Project number (PNURSP2024R318), Princess Nourah bint Abdulrahman University, Riyadh, Saudi Arabia.
Declaration of competing interest
The authors declare that they have no known competing financial interests or personal relationships that could have appeared to influence the work reported in this paper.
References
- Gradually optimization of cropping pattern in Saudi Arabia for sustainable agricultural development until 2030. Ain Shams Eng. J.. 2024;102624
- [CrossRef] [Google Scholar]
- Genome-wide identification and characterization of the dof gene family in mango (Mangifera indica L.) Genet. Resour. Crop Evol. 2023:1-17.
- [Google Scholar]
- Evaluation of genetic diversity among Saudi Arabian and Egyptian cultivars of alfalfa (Medicago sativa L.) using ISSR and SCoT markers. J. Taibah Univ. Sci.. 2023;17:2194187.
- [CrossRef] [Google Scholar]
- Nuclear DNA content of some important plant species. Plant Mol Biol Rep. 1991;9:208-218.
- [CrossRef] [Google Scholar]
- Integration of advanced technologies for plant variety and cultivar identification. J Biosci. 2021;46:91.
- [CrossRef] [Google Scholar]
- Genotypic diversity and population structure of the apricot landraces of the Campania region (Southern Italy) based on fluorescent SSRs. Genet Resour Crop Evol. 2023;70:125-134.
- [CrossRef] [Google Scholar]
- Recent Advances in Breeding of Mango (Mangifera indica): A Review. IJECC. 2023;13:521-538.
- [CrossRef] [Google Scholar]
- Genetic characterization and molecular fingerprint of traditional Umbrian tomato (Solanum lycopersicum L.) landraces through SSR markers and application for varietal identification. Genet Resour Crop Evol. 2020;67:1807-1820.
- [CrossRef] [Google Scholar]
- First report with morphometrics and molecular characterization of phtyonematodes associating mango trees in the tropics of Saudi Arabia. Saudi J. Biol. Sci.. 2020;27:202-209.
- [CrossRef] [Google Scholar]
- Evolutionary and Ecological Processes in Conservation and Preservation of Plant Adaptive Potential (PhD Thesis). North Dakota State University; 2022.
- Doyle, J., 1991. DNA Protocols for Plants, in: Hewitt, G.M., Johnston, A.W.B., Young, J.P.W. (Eds.), Molecular Techniques in Taxonomy. Springer Berlin Heidelberg, Berlin, Heidelberg, pp. 283–293. DOI: 10.1007/978-3-642-83962-7_18.
- Molecular evaluation of selected mango genotypes grown in Egypt using SCoT and ISSR markers. Hortic. Sci.. 2022;49:213-224.
- [CrossRef] [Google Scholar]
- Genetic diversity and population structure of sorghum [Sorghum bicolor (L.) moench] accessions as revealed by single nucleotide polymorphism markers. Front. Plant Sci.. 2022;12:799482
- [CrossRef] [Google Scholar]
- Patterns of Volatile Diversity Yield Insights Into the Genetics and Biochemistry of the Date Palm Fruit Volatilome. Front. Plant Sci.. 2022;13
- [CrossRef] [Google Scholar]
- Identification of an olive (Olea europaea L.) core collection with a new set of SSR markers. Genet Resour Crop Evol. 2021;68:117-133.
- [CrossRef] [Google Scholar]
- He, X.H., Razak, S.A., Luo, C., 2021. Genetic Diversity Analysis of Mango, in: Kole, C. (Ed.), The Mango Genome, Compendium of Plant Genomes. Springer International Publishing, Cham, pp. 75–94. DOI: 10.1007/978-3-030-47829-2_5.
- SSR-based molecular diagnosis for Taiwan tea cultivars and its application in identifying cultivar composition of the processed tea. J. Food Drug Anal.. 2023;31:446-457.
- [CrossRef] [Google Scholar]
- Inferring weak population structure with the assistance of sample group information. Mol. Ecol. Resour.. 2009;9:1322-1332. 10/d2p2h6
- [Google Scholar]
- Comparative Assessment of SSR and RAPD markers for genetic diversity in some Mango cultivars. PeerJ. 2023;11:e15722.
- [Google Scholar]
- Simple Sequence Repeats-Based DNA Fingerprinting and Varietal Identification of Mango Cultivars. 2023
- [CrossRef]
- Identification of polymorphic SSR markers in elite genotypes of pearl millet and diversity analysis. Ecol. Genet. Genomics. 2020;14:100051
- [CrossRef] [Google Scholar]
- Nutritional Composition and Bioactive Compounds in Three Different Parts of Mango Fruit. IJERPH. 2021;18:741.
- [CrossRef] [Google Scholar]
- Genomic scanning using AFLP to detect loci under selection in the moss Funaria hygrometrica along a climate gradient in the Sierra Nevada Mountains, Spain. Plant Biol J. 2016;18:280-288. 10/f79jx7
- [Google Scholar]
- Comparative transcriptomic profiling of High- and Low- grain Zinc and Iron containing Indian wheat genotypes. Curr. Plant Biol.. 2019;18:100105 10/gsm752
- [Google Scholar]
- Towards a Joint International Database: Alignment of SSR Marker Data for European Collections of Cherry Germplasm. Plants. 2021;10:1243.
- [CrossRef] [Google Scholar]
- Geographic patterns of genomic diversity and structure in the C4 grass Panicum hallii across its natural distribution. AoB Plants. 2021;13:plab002.
- [CrossRef] [Google Scholar]
- GenAlEx 6.5: genetic analysis in Excel. Population genetic software for teaching and research—an update. Bioinformatics. 2012;28:2537-2539.
- [CrossRef] [Google Scholar]
- Advancements in molecular marker technologies and their applications in diversity studies. J. Biosci.. 2020;45:123.
- [CrossRef] [Google Scholar]
- Safhi, F.A.; Alshamrani, S.M.; Alshaya, D.S.; Hussein, M.A.A.; Abd El-Moneim, D. Genetic Diversity Analysis of Banana Cultivars (Musa sp.) in Saudi Arabia Based on AFLP Marker. 2023 Curr. Issues Mol. Biol., 45, 1810-1819. DOI: 10.3390/cimb45030116.
- cgSSR marker-based genome-wide association study identified genomic regions for panicle characters and yield in rice (Oryza sativa L.) J. Sci. Food Agric.. 2023;103:720-728.
- [CrossRef] [Google Scholar]
- Genetic Diversity, Conservation, and Utilization of Plant Genetic Resources. Genes. 2023;14:174.
- [CrossRef] [Google Scholar]
- Isolation and characterization of 15 microsatellite loci from mango (Mangifera indica L.) and cross-species amplification in closely related taxa. Mol. Ecol. Notes. 2005;5:625-627.
- [CrossRef] [Google Scholar]
- New hyper-variable SSRs for diversity analysis in mango (Mangifera indica L.) Indian J. Genet. 2021;81:119-126.
- [CrossRef] [Google Scholar]
- SSR-based DNA fingerprinting of fruit crops. Crop Sci.. 2023;63:390-459.
- [CrossRef] [Google Scholar]
- The genome evolution and domestication of tropical fruit mango. Genome Biol. 2020;21:60.
- [CrossRef] [Google Scholar]
- Advances in DNA based Molecular Markers for the Improvement of Fruit Cultivars in Pakistan-A Review. SJA. 2022;38
- [CrossRef] [Google Scholar]
- Molecular identification of mung bean accessions (Vigna radiata L.) from Northeast China using capillary electrophoresis with fluorescence-labeled SSR markers. Food Energy Secur.. 2020;9:e182.
- [Google Scholar]
- Genome fingerprinting by simple sequence repeat (SSR)-anchored polymerase chain reaction amplification. Genomics. 1994;20:176-183.
- [CrossRef] [Google Scholar]


