

Translate this page into:
Genome wide association mapping through 90K SNP array against leaf rust pathogen in bread wheat genotypes under field conditions
⁎Corresponding authors at: Department of Plant Breeding and Genetics, Faculty of Agriculture and Environment, The Islamia University of Bahawalpur, Pakistan (H. Ghulam Muhu-Din Ahmed): Biotechnology and Germplasm Resources Institute, Yunnan Academy of Agricultural Sciences, Kunming 650205, China (Y. Zeng). ghulam.muhudin@iub.edu.pk (Hafiz Ghulam Muhu-Din Ahmed)
-
Received: ,
Accepted: ,
This article was originally published by Elsevier and was migrated to Scientific Scholar after the change of Publisher.
Peer review under responsibility of King Saud University.
Abstract
In wheat crop the leaf rust is an infectious disease, threatening wheat production annually. Identification of resistance genes or markers traits associations for effective field resistance could greatly enhance our ability to breed durably resistant varieties. Herein 105 bread wheat genotypes were evaluated against the leaf rust susceptible and resistance during the two seasons 2018–19 and 2019–20 under field conditions using CI, AUDPC and FDS parameters. Based on the performance of genotypes against leaf rust pathogen, 34 genotypes categorised as resistance (R), followed by 30, 32 and 9 genotypes classified as moderately resistance (MR), moderately susceptible (MS) and susceptible (S) genotypes. respectively. We also applied a genome wide association study (GWAS) approach to identify markers trait associations (MTAs) resistance against leaf rust using 90 K SNP Array. Marker–trait association results indicated that total 56 MTAs were significantly associated at P ≤ 10−3 using Bonferroni adjustment after crossed FDR ≤ 0.05 with studied parameters under field conditions. Among them, total numbers of associated MTAs 17, 23 and 16 were identified for CI, AUDPC and FDS parameters, respectively. Maximum significant MTAs were identified on chromosomes 2A (7), 3B (7), 5A (7) followed by 4A (5), 7B (5), 1A (4) and 7A (4) in the studied genotypes. The locus (Kukri_c55051_414) showed pleotropic effects for leaf rust identified parameters on chromosome 5A at position of 68.2 cM under field conditions. This study demonstrated the use of genome-wide association mapping for the identification of potentially new genomic regions associated with studied parameters. Leaf rust resistant genotypes identified in this study proved to be more productive under preliminary field conditions against leaf rust pathogen. Thus, these resistant accessions could be used as parental genotypes in breeding programs for leaf rust resistance.
Keywords
Genome
Disease
Fungal
Rust
Markers
Chromosome
Wheat

1 Introduction
Wheat leaf rust, caused by the fungus Puccinia triticina Eriks, is a threat to world wheat production. Reduced yield imposes food security challenges as a result of increasing demands for wheat consumption from the same land or even decreasing area to feed the ever increasing population of the world (Anwaar et al., 2019). Genetic resistance is the most effective, economic, and environmentally safe method to control and reduce losses caused by this disease (Zegeye et al., 2014). Identification of resistance genes using molecular markers is an important step toward marker assisted selection and resistance breeding. To date, there have been several leaf rust resistance genes identified, the majority of which confer leaf rust resistance in the seedling stage and are race-specific. However, continuous evolution of new leaf rust races requires constant search for new sources of resistance with novel QTL/genes (Juliana et al., 2018). Earlier, (Pathan and Park 2006) assessed a kind of partial resistance called adult plant resistance (APR) to brown rust in European lines and reported various levels of APR among the investigated wheat lines by means of average coefficient of infection (ACI) by estimating average coefficient of infection (CI) across different locations.
Based on the final disease severity (FDS) and area under disease progress curve (AUDPC), (Macharia and Wanyera 2012) reported infection responses of the wheat cultivars and classified them into four discrete categories as 1 susceptible (S), 2 moderately susceptible (MS), 3 moderately resistant (MR) and 4 resistant (R). Wheat scientists (Taye et al., 2015; Anwaar et al., 2019) reported that area under disease progress curve (AUDPC) and the final disease severity (FDS) were negatively correlated with final grain yield as well as yield contributing components, and very positively correlated with grain yield loss. Thus, it demonstrated a negative relation when there is an increase in these disease parameters there will be a decline in yield related parameters and vice versa.
(Macharia and Wanyera 2012) investigated fifteen wheat cultivars including six advanced lines from CIMMYT germplasm and others were commercially grown cultivars in Kenya and depicted that disease severity and area under disease progress curve were highly positively correlated with yield losses thus, were negatively correlated with grain yield and yield contributing components. (Hasan et al., 2012) assessed grain yield losses due to brown rust disease on the five-local commercial susceptible wheat cultivars under field conditions during 2011–2012 growing seasons and was depicted a relationship between rust severity and yield components which resultantly converted to financial losses. These results endorsed by (El-Shamy et al., 2011) who found a significant relation among percentage losses of 1000 grain weight, grain yield and final rust severity.
(Ochoa and Parlevliet 2007) described that yield losses were strongly correlated with area under disease progress curve in cereal crops. (Singh et al., 2011) reported highly significant (P < 0.01) negative correlation of rust severity and AUDPC with grain weight and yield while evaluating 5107 advanced breeding lines in field trials at Mexico in 2001, only 2.4% lines were highly resistant, 28% were moderately resistant and the rest of the lines were moderately susceptible to susceptible. Association mapping (AM) using phenotypic and genotypic data of association panels has become an important approach in identifying molecular markers (QTLs) linked to traits of interest for potential use in marker assisted selection for the fact that it enables to use diverse set of germplasm (landraces, cultivars, elite breeding lines, etc), and provides broader genomic region/allelic coverage with high resolution (Gao et al., 2016; Leonova et al., 2020).
Genome-wide association studies (GWAS) offer complementary approaches to understanding natural variation. GWAS generally combine phenotype and genotype data from 100 or more accessions to identify loci with allele frequency correlations to phenotypic variation or environment (Juliana et al., 2018). This approach can thus incorporate a relatively large portion of natural variation in a species and localize associations to much smaller genomic regions, because the sampled diversity incorporates many more recombination events than traditional recombinant inbred lines and/or doubled haploid populations (Zegeye et al., 2014). Information on the level of resistance of modern wheat varieties and genetic basis of resistance is needed to expand the pool of resistant cultivars available for breeding. GWAS allows us to determine the presence of both known resistance genes and previously unidentified loci (Leonova et al., 2020). For example, using this approach, a collection of 338 cultivated varieties of spring soft wheat was studied, and 46 QTLs responsible for resistance to leaf rust at seedling and adult plant stages were detected (Gao et al., 2016).
The main feature of this mapping panel is that a large amount of the germplasm possesses resistance to leaf rust and in some cases specific genes providing the resistance are known. It is possible that such a panel will allow us to identify resistance alleles that are normally not detected due to low allele frequency. This study aims to validate known genomic loci effective to leaf rust resistance and to identify novel genes or QTLs that are effective against the leaf rust pathogen in the seedling and (or) adult plant stages. Meanwhile, this study also explores the genetic architecture and phenotypic correlations for seedling and adult plant resistance and discusses ways to implement our research results in plant breeding and genetics efforts.
2 Materials and methods
2.1 Germplasm collection
The total 105 bread wheat genotypes were studied in this experiment. According to the maintaining sources, the germplasm divided into three groups as mentioned in Supplementary Table 1 (Ahmed et al., 2019). In first group the genotypes G-1 to G-20 developed in the Department of Plant Breeding and Genetics, University of Agriculture Faisalabad (PBG-UAF), Pakistan, while second group genotypes G-21 to G-55 were from exotic source and third group genotypes G-56 to G-105 were from indigenous sources.
2.2 Experimental site and sowing conditions
Studied germplasm were sown by hand drill for screening against leaf rust in research area of Department of Plant Breeding and Genetics, The Islamia University of Bahawalpur (29⁰ 24′N latitude, 71⁰ 41′E longitude and 214 m above sea level) Pakistan under randomized complete block design (RCBD) in field with three replications to evaluate the leaf rust susceptible and resistance genotypes during the two seasons 2018–19 and 2019–20. For analysis purpose averaged data based on over years were used. Each genotype was planted in plot size of 1.2 m × 2.5 m and the experimental plots were surrounded by planting three rows of highly susceptible genotype Morocco. Inoculation was done artificially by means of various methods like dusting with talcum powder, rubbing, spraying with distilled water and needle injection methods on Morocco twice in a week at tillering and heading stage for the development of a heavy rust infection pressure (Hussain et al., 2015).
2.3 Data recording of leaf rust under field conditions
Disease severity of leaf rust in percentage and host response were observed by modified Cobb’s scale described by (Peterson et al., 1948). Disease severity was recorded four time with 10 days interval when Morocco showed 40–50% rust severity. Rating of the final disease severity (FDS) was recorded when Morocco variety showed 90–100% disease severity. The values of coefficient of infection (CI) were calculated by the equation described by (Pathan and Park 2006). Area under disease progress curve (AUDPC) was estimated for each genotype by using the following equation (Anwaar et al., 2019). where d = days between two consecutive records (time intervals)
y1 + yk = Sum of the 1st and last disease scores
y2 + y3 + − − − − − + yk-1 = Sum of all in between disease scores.
2.4 Statistical analysis
Recorded data were subjected to analysis of variance (ANOVA) (Steel et al., 1997) using the GenStat (v10) software (Payne et al., 2008). The significance level = 0.01 was used for highly significant effects and = 0.05 was used for significant effects. RADAR-graph were developed for mean value using Excel-Stat in which display values relative to a centre point for examined traits under both environments (Ahmed et al., 2020).
2.5 DNA extraction and genotyping
In green-house, wheat seeds were sown in small plastic trays for healthy seedlings. After three weeks, fresh leaves were collected for DNA according to the CIMMYT Molecular Genetics Manual procedure in 96 well-plates. The concentration and quality of isolated DNA was assessed by Nano-drop (ND1000, Thermo Scientific, USA). The DNA of each genotype (70–100 ng/μl) preserved in 96-well plate and prepared for genotyping with high-density illumina 90 K Infinium SNP array (Dreisigacker et al., 2013). After genotyping, the genome-wide positions of SNPs in terms of genetic distance (cM) situated on chromosomes founded on consensus genetic map of bread wheat (Wang et al., 2014). For further analysis SNPs were filtered and excluded the monomorphic SNPs, more than 20% missing SNPs, minor alleles and allelic frequency < 5% for GWAS in the present study.
2.6 Population STRUCTURE and GWAS analysis
Bayesian clustering technique was used to classify the group of genetically similar population via statistical software STRUCTURE v.2.3 (Pritchard et al., 2000). Burn-in iterations of 104 cycles, followed by a simulation run of 106 cycles and the admixture model selection were used. Web-based analysis “Structure Harvester v0.6.93” was applied to obtain maximum value or peak of ‘‘K’’ for validation to understand the STRUCTURE results which were based on ad-hoc techniques. We selected the K values ranged 1–10 and 6 independent runs to attain reliable effects.
GAPIT (genome association and prediction integrated tool) was also applied with the model selection preference to test the reliability of the results. It was advanced in R package which offer maximum likelihood precision and run in a computationally effective method. GAPIT implements unconventional statistical approaches containing the compressed mixed linear model (CMLM) and CMLM-based genomic prediction and selection. P-values, R2 and marker effects were extracted from GWAS results (Lipka et al., 2012). The threshold level for significant marker-trait associations (MTA) was 10−3 (log10p) or above (Rahimi et al., 2019) after applying the false discovery rate (FDR) < 0.05 correction using Bonferroni adjustment (P = 1/n, n = total number of SNPs) (Benjamini and Hochberg 1995). Mixed linear model (MLM) estimated from newly developed GWAS. To define the spurious associations derived from population structure, covariates from either STRUCTURE or principal components (PCs) were considered as fixed effects. The relationships among individuals were calculated using a kinship matrix and incorporated MLM. Overall 18,500 SNPs from functional iSelect bead chip analyses visually showed polymorphism; to locate them on the published genetic map in the studied genotypes.
3 Results and discussions
3.1 Field evaluation of disease severity parameters against leaf rust
A field evaluation was conducted of 105 wheat varieties over two growing seasons 2018–19 and 2019–20 against leaf rust disease using disease severity Coefficient of infection (CI), Area under disease progress curve (AUDPC) and Final Disease Severity (FDS) parameters. Mean squares results from analysis of variances (ANOVA) showed highly significant (P ≤ 0.001) effects among investigated wheat genotypes for coefficient of infection under field conditions (Table 1). The mean responses of studied wheat genotypes to leaf rust under field conditions are shown in Fig. 1. In 2014–15 growing season, all investigated wheat genotypes showed the significant values of coefficient of infection. Data analysis and mean comparison indicated that wheat cultivars were considerably different based on the coefficient of infection values. The values 10–20, 21–30, 31–45 and 46–80 were categorized as high, moderate, low and very low levels of resistant, respectively. During this study, an effort was also done to elucidate the association between described parameters. Among the studied germplasm, G-36 and G-27 and G-102 showed highest values of coefficient of infection 77.6, 77.6 and 76.0 followed by G-6 and G-42 having values of 63.6 and 63.0 respectively, thus, these were classified as susceptible wheat genotypes. However, G-28 showed the minimum value of coefficient of infection 12.0 and followed by G-30, G-35, G-38, G-2, G-11, G-23, G-16 and G-48 having values of 14.6, so were ranked as resistant genotypes against leaf rust pathogen (Fig. 1). The described results are in harmony with the results of (Anwaar et al., 2019). (Ali et al., 2009) investigated 20 wheat genotypes and ‘Morocco’ as susceptible check at NIFA for describing variability for field based partial resistance to rust and lines with coefficient of infection values of 0–20, 21–40 and 41–60 were considered as possessing better, moderate and low levels of partial resistance, respectively. Only Morocco (a susceptible check) was possessing 100 CI value. * = Significant (P < 0.05) ** = Highly Significant (P < 0.01) NS = Non-significant.
Mean squares
Source of variation
Df
Coefficient of Infection (CI)
Area under disease progress curve (AUDPC)
Final Disease severity (FDS)
Replications
2
9177.88
2,421,550
6845.00
Genotypes
104
940.66**
256423**
602.66**
Error
208
209.31
16,752
150.10
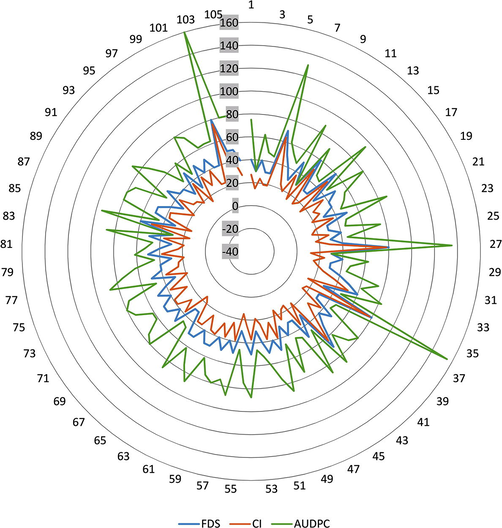
Performance of 105 wheat genotypes against leaf rust pathogen using Final Disease severity (FDS), Area under disease progress curve (AUDPC) and Coefficient of Infection (CI) parameters based on data averaged over two seasons 2018–19 and 2019–20 under field conditions.
Analysis of variances results showed highly significant (P ≤ 0.001) effects among studied wheat genotypes for area under disease progress curve under field conditions (Table 1). Data analysis and mean comparison indicated that leaf rust infection was well established apparently in all the tested wheat cultivars screened for the disease. The results of the mean values of area under disease progress curve of different wheat varieties to leaf rust is shown in Fig. 1. The genotypes G-102, G-36, G-27 and G-6 were ranked as susceptible to area under disease progress curve (AUDPC) with the values of 1600, 1550, 1350 and 1300 respectively, whereas G-42, G-11 and G-2 were ranked as resistant having the minimum value 300 of area under disease progress curve. The rest of the cultivars had the range of value from 450 to 850 were classified as moderately resistant (MR) to moderately susceptible (MS) genotypes. Results of current study showed that AUDPC run in a parallel manner to rust severity. It is obvious from the previous findings by Safavi (2015), Taye et al. (2015), Anwaar et al. (2019) that a very strong positive relation found between AUDPC and final rust severity that means severely infected cultivar showed higher AUDPC values. And the second thing was disease progress rates and AUDPC values were positively correlated and highly significant.
Disease damage or lesions covered on host tissues or organ described in percentage is called disease severity. Severity results from the number and size of the lesions. Data analysis and mean comparison indicated that 105 wheat genotypes were significantly different based on the final disease severity (FDS) parameter. ANOVA Results showed highly significant (P ≤ 0.001) effects among investigated wheat genotypes for disease severity under field conditions (Table 1). Mean results of the response of different studied wheat genotypes against leaf rust disease under field conditions are shown in Fig. 1. All the studied wheat genotypes exhibited different disease severity ranged from 30 to 80%. The genotypes of G-102, G-27 and G-36 showed the highest final rust severity of 80% followed by G-6 and G-42 which had the value of 70% rust severity and classified as leaf rust susceptible genotypes. While the minimum final disease severity value was 30 % showed by the genotypes G-30, G-37, G-25 and some other cultivars, thus, were more resistant to the pathogen of the leaf rust as indicated in Fig. 1. Current results are in a harmony with results reported by Macharia and Wanyera (2012), Taye et al. (2015). A study by Hasan et al. (2012) was aimed to estimate of losses of grain yield because of brown rust disease on the five local commercial susceptible wheat cultivars in field conditions during 2011–2012 growing seasons at Gemmeiza Agriculture Research Station, Egypt. The investigated cultivars exhibited 5–80% disease severity. And was depicted a relationship between rust severity and yield components which resultantly converted to financial losses.
3.2 Population STRUCTURE
Bayesian method execute in statistical software package STRUCTURE used to estimate the genetic structure of 105 bread wheat genotypes. The results from this technique showed that highest (peak) number of K = 4 which demonstrating the germplasm distributed into four sub-population (Fig. 2A). Different types of coloured in Fig. 2B exhibits the distinct group and overall germplasm allocated into four sub-groups. This technique has been applied in wheat breeding scheme by many scientists and were obtained the explanatory outcomes (Wang et al., 2021). In current experiment, existence of different groups clearly showed the genetic variations between 105 bread wheat genotypes and genetically diverse to one another. Fundamentally, this is the indication of genetic divergence between the clusters or groups and resultantly the presence of more genetic diversity in studied germplasm. Several wheat breeders evaluated the genetic diversity (Rahimi et al., 2019; Leonova et al., 2020) using the similar techniques which were applied in current study and some extent they got the similar results. Development of novel bread wheat genotypes should be attaining the significance level of genetic diversity. Presence of more variation in 105 bread wheat genotypes which indicate the maximum genetic diversity, fearlessly, that the studied germplasm introduced from different sources or assumable mechanical mixing.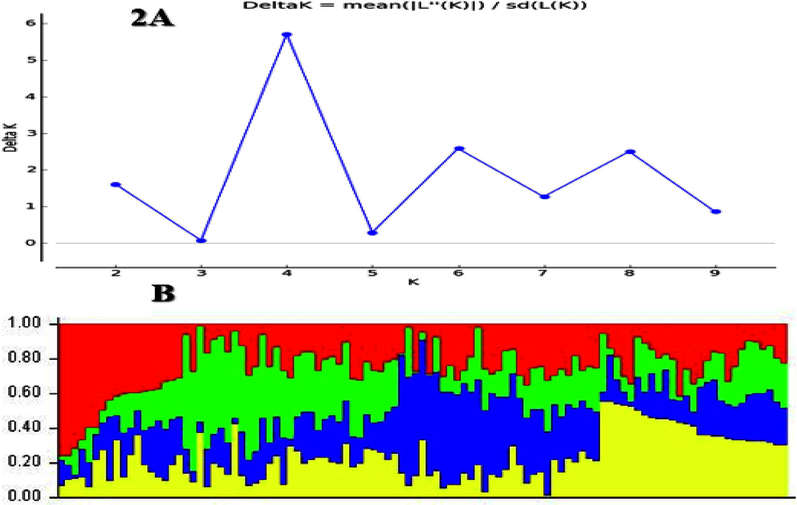
(A) This result achieved of 105 wheat genotypes using 90 k SNP Array from Structure Harvester analysis. It's based on the second order derivation on the variance of the maximum likelihood estimation of model given a specific K. Delta K shows only the uppermost clustering level and number of subpopulations in main population. (B) Population structure of 105 wheat genotypes based on Bayesian method analysed with 90 k SNP Array detecting 4 groups. The dissimilar colours in this figure demonstrating the different group.
According to the provided pedigree record there are three groups of 105 bread wheat genotypes as shown in Supplementary Table 1. In first group, genotypes G-1 to G-20 which was developed in PBG-UAF, while in second group the genotypes G21 to G-55 were from exotic source, and in third group, genotypes G-56 to G-105 was from indigenous sources. But according to molecular analysis these genotypes divided into four populations. The maximum genetic distance between groups exhibited indicating genetic similarity within groups and genetic dissimilarity between the groups (Lipka et al., 2012; Zegeye et al., 2014). Particularly, results were useable conferring to the previously known pedigree record and origin of wheat genotypes. Genetic diversity evaluation could be helpful to identify the different genotypes for the advancement and improve the future wheat breeding scheme. The genotypes with different genetic makeup can be selected for desirable combinations to develop complex and significant attributes to obtaining maximum yield. Discrimination of wheat genotypes based on their genetic basis would be useful for effective and early selection of desired genotypes in wheat breeding scheme for developing promising wheat genotypes (Juliana et al., 2018; Leonova et al., 2020).
3.3 Genome-wide markers–traits associations for disease severity parameters
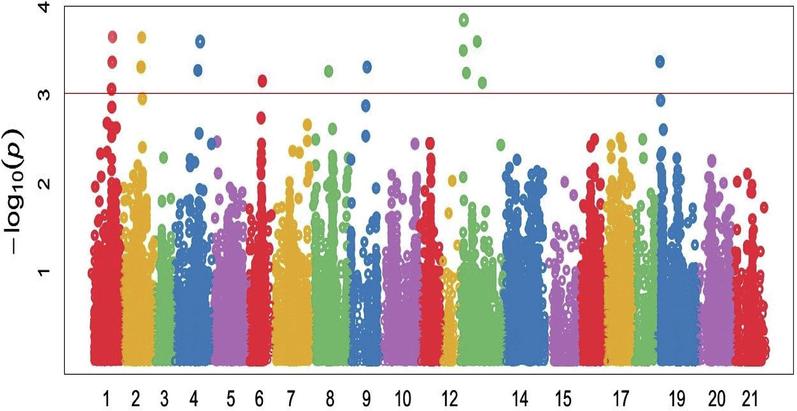
Marker-trait association (MTA) study recognized the connection between particular morphological and genetic variation within a genome, which ultimately perceived locus underpinning related characters at the end. In this study, 18,500 high density SNP markers from the 90 K Illumina iSelect SNP array were evaluated to perceive SNPs associated with disease severity for leaf rust related indices. Before analyses of GWAS and genomic prediction, scientists should validate and maintain genotype quality. The GAPIT provides a series of diagnostic tools to help users perform quality control on genotypes (Lipka et al., 2012). Total 56 significant SNPs were correlated with observed characters at or above –log 10 (P < 0.0001) threshold level using MLM (mixed linear model) for studied traits as mentioned in Table 3. The significance level for p values were measured using Bonferroni adjustment at P ≤ 10−3 after crossed FDR < 0.05 threshold, some scientists previously used this criteria with small population size as in current study (Qaseem et al., 2018; Rahimi et al., 2019). Manhattan plots (Figs. 3–5) presentation the site of significant SNPs at (P < 0.0001) −log10(p) which significantly linked with the desired characters under studied conditions. The red horizontal line on Manhattan plot entitles the threshold level (P < 0.0001) of significance for SNPs with specific traits. Current results were supported with the findings of (Rahimi et al., 2019; Leonova et al., 2020). In this study, 18,500 high density, polymorphic SNP markers from 90 K Illumina iSelect SNPs array (Wang et al., 2014) were examined to notice SNPs associated with disease severity for leaf rust related associated indices.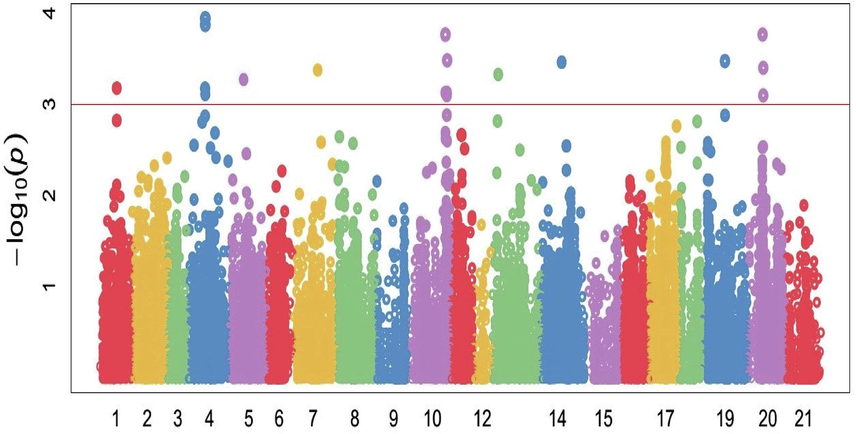
Manhattan plots showing the location of significant SNPs and −log10(p) associated with Coefficient of Infection (CI) in 105 wheat genotypes against leaf rust pathogen under field conditions. The red horizontal line on Manhattan plot entitles the threshold level at P ≤ 10−3 of significance for SNPs with specific traits.
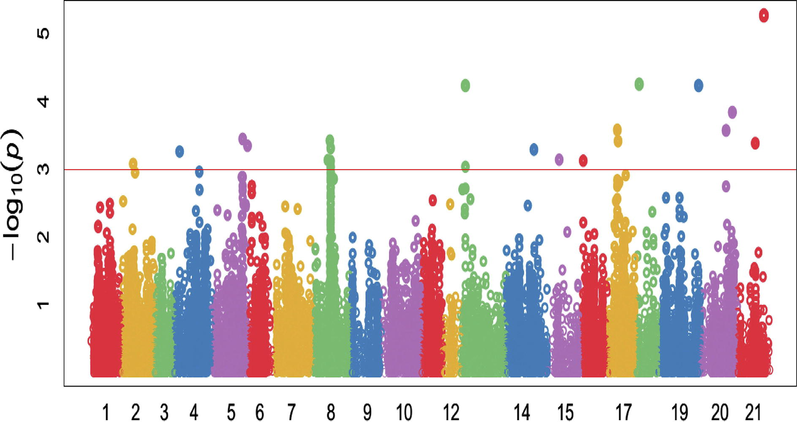
Manhattan plots showing the location of significant SNPs and −log10(p) associated with Area under disease progress curve (AUDPC) in 105 wheat genotypes against leaf rust pathogen under field conditions. The red horizontal line on Manhattan plot entitles the threshold level at P ≤ 10−3 of significance for SNPs with specific traits.
Manhattan plots showing the location of significant SNPs and −log10(p) associated with Final Disease severity (FDS) in 105 wheat genotypes against leaf rust pathogen under field conditions. The red horizontal line on Manhattan plot entitles the threshold level at P ≤ 10−3 of significance for SNPs with specific traits.
A total of 17 significantly marker trait associations were found with coefficient of infection, Including 5 markers located on chromosomes 4A, 4 on chromosome 2A, 3 on 7B and the other on 1A, 2B, 3A, 5A and 7A (Fig. 3). In GWAS analysis, wsnp_Ex_c5412_9564046 on chromosome 2A at position 261.05 cM and Kukri_c4709_53 on chromosome 4A were significantly correlated with this trait covering 20.49% and 16.60% of the phenotypic variation respectively. Reliable MTAs were detected for disease severity parameters which located on the 5A, 6D, 6A and 6A chromosomes by wheat scientists (Singh et al., 2009). Associations with SNPs of chromosome 5A were also established a link with current study. In addition, association mapping revealed a Genomic region on chromosome 5A, which determines the presence of resistance loci against leaf rust. Based on the location of QTLs, as well as their origin, the locus on 5A found in this study cannot be attributed to any of the known genes (Singh et al., 2009; Maccaferri et al., 2010; Leonova et al., 2020). This suggests the presence of a previously unknown QTL for resistance to leaf rust in the genomes of studied germplasm.
Total 23 significant SNP markers were strongly linked with Area under disease progress curve (AUDPC) including 6 markers located on chromosomes 3B, 2 on each chromosome 2B, 5A, 6B, 7B, 7D and the other on 1B, 6A, 6D and 7A (Fig. 4). These markers explained 11.64% to 23.03% of the phenotypic variation in AUDPC under field conditions. The marker (D_contig29746_525) on chromosome 7D at 436.21 cM explained maximum variation 23.03% while the marker (BS00037898_51) on 3B at 274.8 cM explained (Table 3) minimum variation (11.64%) in this parameter. In the study of (Wang et al., 2021) 32 markers located on seven chromosomes were identified which similar to current study results, as significantly associated (P < 0.00o1) with FDS and AUDPC. The identified resistant accessions and resistance loci will be useful in the ongoing effort to develop new wheat cultivars with strong resistance to leaf rust (Yao et al., 2019; Wang et al., 2021).
Final Disease Severity (%) was highly associated with sixteen QTL regions. Four QTLs associated regions were located on chromosomes 5A, three on 1A, two on each 1B, 2A and 7A, one on each 3B and 3 D (Fig. 5). These MTAs explained 12.97 % to 19.39 % of the variation in FDS (Table 3). The marker (Ku_c10756_1197) explained maximum phenotypic trait variability (19.39%) on chromosome 5A at 690.36 cM while the marker (BobWhite_c15453_678) on chromosome 2D at 208.94 cM explained minimum value (12.97 %) of phenotypic variability. MTA for FDS were distributed across 16 chromosomes, including, 11 SNPs at A-genome, 3 at B-genome and 2 at B-genome. Leaf rust resistance genes designated Lr1 to Lr60 have been have been characterized in common (Bolton et al., 2008). These resistance genes are widely distributed across all the chromosomes of the wheat genome. In present study, significant SNPs were observed and matched with previously identified location of genes by several scientists. Genes Lr2a, Lr2b and Lr2c were mapped to a locus on chromosome 2D, Chromosomes 6B exhibited the Lr3a, Lr3ka and Lr3g genes against leaf rust (Li et al., 2016) The other genes Lr17a and Lr17b are at a locus on chromosome 2A and Lr22a and Lr22b at a locus on chromosome 2D. Genes Lr14a and Lr14b are extremely tightly linked on chromosome 7B and are considered as alleles for all practical purposes (Bolton et al., 2008; McIntosh et al., 2014).
Based on the disease severity parameters of FDS and AUDPC (Macharia and Wanyera 2012), reported infection responses of the wheat cultivars and classified them into four discrete categories: a) S-susceptible) MS-moderately susceptible c) MR-moderately resistant d) R-resistant which was previously reported by several scientists. Resistant wheat varieties are compromised by the continuously evolving races of rust pathogens, which causes leaf rust of wheat and appears to be the most damaging pathogen that threatens global food security by inducing yield reductions in wheat (Li et al., 2016). Diseased symptoms are prevalent on leaf blades, leaf sheaths and glumes. Pathogenic attack in the early crop stages may result in increased yield losses up to 30% (Anwaar et al., 2019).
In the current study total 105 genotypes were investigated, among them 34 genotypes showed resistant results against leaf rust pathogen. Moderately resistance showed by 30 genotypes against this disease in studied germplasm. Total 32 genotypes exhibited moderately susceptible performance to leaf rust pathogen while 9 genotypes showed susceptible behaviour against this pathogen (Table 2). Leaf rust resistant accessions recognised in this experiment verified to be additional fruitful in preliminary field environments against leaf rust pathogen. Thus, these resistant genotypes could be helpful as parental genotypes in breeding schemes for leaf rust resistance. The locus (Kukri_c55051_414) showed pleotropic effects for leaf rust identified parameters on chromosome 5A at position of 68.2 cM under field conditions\. The main objectives of this study were to identify sources of resistance, and to map genomic loci associated with leaf rust resistance using genome wide association study (GWAS) approach. The new identified sources of resistance and MTAs/QTL could be used in wheat breeding programs to improve leaf rust resistance for sustainable food security.
Resistant (R) genotypes
Moderately Resistant (MR) genotypes
Moderately Susceptible (MS) genotypes
Susceptible (S) genotypes
Total 34 genotypes
Total 30 genotypes
Total 32 genotypes
Total 9 genotypes
32.39%
28.59%
30.49%
8.60%
G2, G4, G5, G9, G11, G13, G14, G16, G20, G22, G23, G25, G28, G30, G31, G35, G37, G38, G43 G45, G46, G48, G53, G56, G66, G67, G75, G79, G82, G84, G86, G90, G94, G96.
G1, G3, G8, G18, G19, G24, G26, G29, G32, G40, G47, G50, G52, G55, G58, G60, G63, G69, G72, G74, G77, G78, G81, G89, G92, G93, G98, G100, G101, G105.
G7, G10, G17, G21, G33, G39, G41, G44, G49, G51, G54, G57, G59, G61, G62, G64, G65, G68, G70, G71, G73, G76, G80, G83, G87, G88, G91, G95, G97, G99, G103, G104.
G6, G12, G15, G27, G34, G36, G42, G85, G102.
SNP
Chromosome
Position
P.value
PV
CI
wsnp_Ex_c5412_9564046
4
261.05
0.0001157
20.49
Ra_c58279_684
4
261.05
0.0001357
20.16
RAC875_c45591_79
20
246.47
0.0001444
19.96
GENE-4367_562
10
575.49
0.0001738
19.66
wsnp_Ex_c27666_36847022
20
213.28
0.0001823
19.36
BS00109911_51
10
603.44
0.0003316
18.35
Kukri_c55051_414
13
68.20
0.0003347
18.32
BS00038787_51
19
369.49
0.0003378
18.31
wsnp_Ra_c3176_5975986
20
246.93
0.0004007
17.97
wsnp_Ex_c15475_23757972
7
419.04
0.0004056
17.37
wsnp_Ex_c5412_9564346
4
257.26
0.0006717
16.95
Excalibur_c26971_1730
10
598.31
0.0007480
16.74
Tdurum_contig46583_2203
10
575.49
0.0007507
16.73
wsnp_RFL_Contig2744_2471775
5
277.23
0.0007613
16.69
wsnp_Ex_c5412_9564550
4
261.05
0.0007791
16.66
wsnp_Ku_c10292_17066821
1
261.32
0.0007838
16.62
Kukri_c4709_53
10
598.31
0.0008009
16.60
AUDPC
D_contig29746_525
21
436.21
0.0000053
23.03
Kukri_c43200_235
18
58.30
0.0000552
17.69
Ex_c54098_174
13
78.01
0.0000577
17.59
Excalibur_c33112_226
19
683.43
0.0000577
17.59
RAC875_c4876_2096
20
522.37
0.0001431
15.61
RAC875_c19425_903
17
134.00
0.0002610
14.31
Excalibur_c58468_162
20
418.37
0.0002655
14.28
BS00100117_51
5
504.16
0.0003548
13.66
TA004110-0731
8
262.18
0.0003758
13.54
RAC875_c31280_122
17
146.01
0.0003820
13.51
D_GA8KES401D0K1W_269
21
294.97
0.0004101
13.36
RFL_Contig4549_196
5
583.38
0.0004468
13.18
BobWhite_c35249_110
8
275.44
0.0004843
13.01
RAC875_rep_c75915_103
14
461.74
0.0005085
12.91
Excalibur_c10307_254
4
86.88
0.0005443
12.76
RFL_Contig2949_500
15
194.19
0.0007172
12.19
GENE-4918_283
8
228.92
0.0007274
12.16
GENE-1756_564
16
15.48
0.0007440
12.11
wsnp_Ex_c7172_12318529
8
275.44
0.0007492
12.10
Excalibur_c10528_347
2
195.12
0.0008269
11.90
wsnp_Ex_c5378_9505533
8
274.80
0.0009118
11.70
RAC875_c28449_88
13
78.13
0.0009120
11.69
BS00037898_51
8
274.80
0.0009350
11.64
FSD
Ku_c10756_1197
13
690.36
0.0001310
19.39
Excalibur_c65152_572
2
344.72
0.0001330
19.05
RAC875_s117925_244
13
77.77
0.0001409
18.49
Excalibur_c111818_435
13
249.32
0.0001420
18.33
RAC875_c16333_340
4
427.05
0.0002290
17.93
BobWhite_rep_c66990_294
8
320.47
0.0002350
17.88
Kukri_c55051_414
13
68.20
0.0002460
17.66
RAC875_c33823_279
9
245.89
0.0002770
17.20
Excalibur_c34115_271
19
103.70
0.0002840
17.15
BobWhite_c26570_282
4
410.90
0.0008310
16.78
Tdurum_contig62445_667
19
98.21
0.0008410
16.67
BS00110877_51
1
333.28
0.0008510
15.38
BS00037976_51
1
337.41
0.0008510
15.25
Tdurum_contig30517_310
2
269.73
0.0008520
15.21
wsnp_Ex_c3831_6965890
1
260.38
0.0008530
15.11
BobWhite_c15453_678
6
208.94
0.0008840
12.97
Acknowledgement
Funding was supported by the China Agriculture Research System (CARS-05-01A-04) which was used for collection and analysis of the genotypic data through 90K SNPs Array and manuscript processing charges. All co-authors acknowledge the China Agriculture Research System (CARS-05-01A-04) and Prof. Dr. Yawen Zeng.
Declaration of Competing Interest
The authors declare that they have no known competing financial interests or personal relationships that could have appeared to influence the work reported in this paper.
References
- Selection criteria for drought-tolerant bread wheat genotypes at seedling stage. Sustainability. 2019;11(9):2584.
- [CrossRef] [Google Scholar]
- Conferring drought-tolerant wheat genotypes through morpho-physiological and chlorophyll indices at seedling stage. S. J. Biol. Sci.. 2020;27(8):2116-2123.
- [Google Scholar]
- Multi-location variability in Pakistan for partial resistance in wheat to Puccinia striiformis f. sp. tritici. Phytopathol. Mediterranea. 2009;48:269-279.
- [Google Scholar]
- Evaluating the antagonistic role of fungal endophytes against leaf rust of wheat caused by Puccinia recondita. Int. J. Agric. Biol.. 2019;21:333-337.
- [Google Scholar]
- Controlling the false discovery rate: a practical and powerful approach to multiple testing. J. Roy. Stat. Soc. Ser. B (Methodol.). 1995;57:289-300.
- [Google Scholar]
- Bolton, M. D., J. A. Kolmer, and D. F. Garvin. 2008. Wheat leaf rust caused by Puccinia triticina. Molecular plant pathology 9:563-575.
- Effect of sowing density on tolerance of some suscptible bread wheat cultivars to leaf rust disease. Zagazig J. Agric. Res. 2011
- [Google Scholar]
- Genome wide association study of seedling and adult plant leaf rust resistance in elite spring wheat breeding lines. PLoS ONE. 2016;11(2):e0148671.
- [Google Scholar]
- Losses in wheat grain yield due to leaf rust, caused by Puccinia triticina Eriks. J. Plant Protect. Pathol.. 2012;3(9):959-966.
- [Google Scholar]
- Application of phenotypic and molecular markers to combine genes for durable resistance against rust virulences and high yield potential in wheat. Int. J. Agric. Biol.. 2015;17(3):421-430.
- [Google Scholar]
- Genome-wide association mapping for resistance to leaf rust, stripe rust and tan spot in wheat reveals potential candidate genes. Theor. Appl. Genet.. 2018;131(7):1405-1422.
- [Google Scholar]
- Genome-wide association study of leaf rust resistance in Russian spring wheat varieties. BMC Plant Biol.. 2020;20:1-13.
- [Google Scholar]
- Li, G., X. Xu, G. Bai, B. F. Carver, R. Hunger, J. M. Bonman, J. Kolmer, and H. Dong. 2016. Genome‐wide association mapping reveals novel QTL for seedling leaf rust resistance in a worldwide collection of winter wheat. The plant genome 9:plantgenome2016.2006.0051.
- Lipka, A. E., F. Tian, Q. Wang, J. Peiffer, M. Li, P. J. Bradbury, M. A. Gore, E. S. Buckler, and Z. Zhang. 2012. GAPIT: genome association and prediction integrated tool. Bioinformatics 28:2397-2399.
- Association mapping of leaf rust response in durum wheat. Mol. Breed.. 2010;26(2):189-228.
- [Google Scholar]
- Effect of stem rust race Ug99 on grain yield and yield components of wheat cultivars in Kenya. J. Agric. Sci. Technol. A 2012:2:423.
- [Google Scholar]
- McIntosh, R., J. Dubcovsky, J. W. Rogers, C. Morris, R. Appels, and X. Xia. 2014. Catalogue of gene symbols for wheat: 2013-14 Supplement. Annual wheat newsletter 58.
- Effect of partial resistance to barley leaf rust, Puccinia hordei, on the yield of three barley cultivars. Euphytica. 2007;153(3):309-312.
- [Google Scholar]
- Evaluation of seedling and adult plant resistance to leaf rust in European wheat cultivars. Euphytica. 2006;149(3):327-342.
- [Google Scholar]
- A Guide to ANOVA and Design in GenStat. Hempstead, UK: VSN International; 2008.
- A diagrammatic scale for estimating rust intensity on leaves and stems of cereals. Can. J. Res.. 1948;26c(5):496-500.
- [Google Scholar]
- Association mapping in structured populations. Am. J. Hum. Genet.. 2000;67(1):170-181.
- [Google Scholar]
- Genome-wide association mapping in bread wheat subjected to independent and combined high temperature and drought stress. PLoS ONE. 2018;13(6):e0199121.
- [Google Scholar]
- Genome-wide association study of agronomic traits in bread wheat reveals novel putative alleles for future breeding programs. BMC Plant Biol.. 2019;19:1-19.
- [Google Scholar]
- Effects of yellow rust on yield of race-specific and slow rusting resistant wheat genotypes. J. Crop Protect.. 2015;4:395-408.
- [Google Scholar]
- Race non-specific resistance to rust diseases in CIMMYT spring wheats. Euphytica. 2011;179(1):175-186.
- [Google Scholar]
- Inheritance and QTL mapping of leaf rust resistance in the European winter wheat cultivar ‘Beaver’. Euphytica. 2009;169(2):253-261.
- [Google Scholar]
- Steel, R., J. Torrie, and D. Dicky. 1997. Principles and procedures of statistics. Multiple comparisons. McGraw Hill Book Co., New York, USA.
- Yield variability of bread wheat under wheat stem rust pressure at bore field condition of Southern Oromia. J. Agric. Sci. Food Technol.. 2015;1:11-15.
- [Google Scholar]
- Characterization of polyploid wheat genomic diversity using a high-density 90 000 single nucleotide polymorphism array. Plant Biotechnol. J.. 2014;12:787-796.
- [Google Scholar]
- Genome-wide association mapping reveals potential novel loci controlling stripe rust resistance in a Chinese wheat landrace diversity panel from the southern autumn-sown spring wheat zone. BMC Genom.. 2021;22:1-15.
- [Google Scholar]
- Characterization of molecular diversity and genome-wide association study of stripe rust resistance at the adult plant stage in Northern Chinese wheat landraces. BMC Genet.. 2019;20(1)
- [CrossRef] [Google Scholar]
- Genome-wide association mapping for seedling and adult plant resistance to stripe rust in synthetic hexaploid wheat. PLoS ONE. 2014;9(8):e105593.
- [Google Scholar]
Appendix A
Supplementary data
Supplementary data to this article can be found online at https://doi.org/10.1016/j.jksus.2021.101628.
Appendix A
Supplementary data
The following are the Supplementary data to this article:


