

Translate this page into:
Gene expression study of breast cancer using Welch Satterthwaite t-test, Kaplan-Meier estimator plot and Huber loss robust regression model
⁎Corresponding author at: Center of Excellence in Genomic Medicine Research, Faculty of Applied Medical Sciences, King Abdulaziz University, Jeddah, Saudi Arabia. skarim1@kau.edu.sa (Sajjad Karim),
-
Received: ,
Accepted: ,
This article was originally published by Elsevier and was migrated to Scientific Scholar after the change of Publisher.
Abstract
Objective
Breast Cancer (BC) is one of the deadliest diseases in women, causing thousands of deaths annually despite the advent of high-throughput genomic platforms in the recent past. Microarray-based gene expression profiling with different statistical methods have been extensively used to understand the disease at the molecular level. We plan to apply Welch Satterthwaite t-test, Kaplan-Meier estimator plot and Huber Loss robust regression model on microarray data to improve the analysis and find biomarkers for future diagnosis, prognosis, and treatment.
Methods
We retrieved microarray data (GSE10810 dataset) of 31 breast tumor samples and 27 normal breast samples from Gene Expression Omnibus (GEO, NCBI). Welch Satterthwaite t-test was applied to identify the most statistically significant genes, Huber loss robust regression model was applied to investigate the existing mathematical relations between tumor and control variables, and Kaplan-Meier Plotter was used to confirm their association with overall metastatic relapse-free survival of BC patients.
Results
We identified 1837 differentially expressed genes, including 638 overexpressed (COL11A1, KIAA0101, S100P, GJB2, TOP2A, LINC01614, RRM2, INHBA, C15orf48 and CKS2) and 1199 under expressed (LEP, ADIPOQ, PLIN1, PCK1, PCOLCE2, ADH1B, LYVE1, FABP4, ABCA8, and CHRDL1) genes passing the threshold (fold change ± 2 and p value < 0.001). KM analysis revealed 12 out of 20 DEGs (log rank p value < 0.05) as potential prognostic and therapeutic biomarkers.
Conclusion
Huber loss robust regression model was found to be one of the best performing algorithms for the mathematical relationship between the control and breast tumor samples with co-relation coefficient of 0.4398 and mean absolute error of 1.069 ± 0.020. In conclusion, with high mathematical confidence, we detected DEGs have high potential to be BC biomarkers using Welch t-test and Kaplan-Meier plot having minimum underlying assumptions.
Keywords
Breast cancer
Gene expression
Microarray
Welch Satterthwaite t-test
Kaplan-Meier plot
Huber loss robust regression

1 Introduction
Cancer is a complex disease where irregular cell differentiation and proliferation converts normal cells into tumors. Individual’s genetic factors stimulated by carcinogenic factors cause cancer (Parkin, 2006; Plummer et al., 2016; Zapatka et al., 2020). In 2020, the World Health Organization reported 1.8 million deaths from lung cancer, 935,000 deaths from colorectal cancer, 830,000 deaths from liver cancer, 769,000 deaths from stomach cancer, and 685,000 deaths from breast cancer (BC). BC usually affect the epithelium of the ducts (85 %) or lobules (15 %) in the glandular tissue of the breast (“Breast cancer”, Who.int, 2021). BRCA1 and BRCA2 genes are frequently used as an inherited diagnostic marker. However, hundreds of genes and pathways have been found to be associated with BC. Therefore, a detailed functional study is needed to understand the complexity and polymorphisms of cancer at the genetic level.
Recent advent of genomic and trancriptomic technologies have helped researchers to find variation at the nucleotide level and determine the simultaneous expression of thousands of genes at any specific stage of BC (Russo et al., 2003). The selection of the most appropriate statistical methods/models is a key step in microarray data analysis to identify the significantly associated up-and down-regulated genes with a higher level of confidence. Mathematical model like Pearson’s correlation is used to measure the relation between gene expression values for linearly associated data, whereas rank correlation is preferred for nonlinear data (de Siqueira Santos et al., 2013). Student t-test is a commonly used statistical method for comparing two independent groups in clinical data that might give biased results because of the underlying assumption of normality and homoscedasticity (homogeneity of variance), and lead to unsound and unreliable mathematical inferences (Erceg-Hurn and Mirosevich, 2008). Welch Satterwaite’s t-test, Yuen’s t-test, and a bootstrapped t-test are other popular t-tests based on the underlying assumption and used for analysis (Rasch et al., 2009; Delacre et al., 2017).
We aim to check the mathematical relation between tumor and control. Outliers are the troublemaker while applying any statistical model to determine the mathematical relation. We compared the efficiency results of linear, Huber, RANSAC, and Theil-Sen robust regression models and used Huber loss robust regression model to investigate the mathematical correlation between tumor and control samples.
Cross-validation of DEGs using qPCR brings confidence in high-throughput result. Prognostic values of genes could be determined by survival probability using Kaplan Meier (KM) survival estimator, Nelson–Aalen estimator, Cox Proportional Hazard Model based on regression (Kaplan and Meier, 1958; Cox, 1972).
In the present study, we used a microarray dataset for (i) re-analyzing the experiment to identify key differentially expressed genes, (ii) validating survival associated with most altered genes using web-based Kaplan Meier Plotter tool, and (iii) investigating the existence of potential mathematical relationships between tumor and control variables.
2 Materials and methods
2.1 Data collection:
We obtained gene expression microarray raw data as.CEL files of “GSE10810” dataset from Affymetrix Human Genome U133 Plus 2.0 Array [GPL570] with 54,675 probes (Pedraza et al., 2010). The cohort contains 58 samples including 31 BC and 27 control.
2.2 Welch Satterthwaite t-test for identification of differentially expressed genes
The Welch Satterthwaite t-test was applied to compare the mean of control and BC samples and to detect the significant difference between control and tumor groups using the following formula:
Here, = sample mean.
= standard error, for a given sample standard deviation and sample size, the denominator is not primarily linked with pooled variance estimate.
The degrees of freedom: Welch degree of freedom =
combined with this variance estimate, is approximated using the Welch–Satterthwaite equation
In case of N1 = N2
is the degree of freedom.
If the sample size and variance are equal then both Student t-test and Welch t-test behave same, however, changes with variance and sample size (Baguley, 2012). Based on cut-off p-values ≤0.05 and fold change ± 1.5, the model could be several stringent, moderate, and liberal that can give different results. Welch’s t-test was applied on each row of 3126 probes for filtration and identification of significant differentially expressed genes.
2.3 Kaplan–Meier estimator for survival analysis:
The Kaplan-Meier estimator is a non-parametric model used for survival probability function with minimal assumptions. We assume the event takes place at a specific time, all the data points and censored observations have the same chance of surviving.
The Kaplan–Meier (KM) estimator (Kaplan and Meier, 1958) is mathematically expressed as:
SF = Survival Function.
= number of people at risk at any given time and = the number of events occurring at any given time
The survival curve remains constant between two occurrences, such as
and
+ 1. Equation (5) can be rewritten using a recursive formula.
We used “Kaplan-Meier Plotter” to see if the expression levels of the selected up and down regulated genes were correlated to BC patient’s, overall metastatic relapse-free survival with 95 % confidence interval, calculated hazard ratio (HR), statistical significance log rank p value was ≤ 0.05 (https://kmplot.com/analysis/) (Emmert-Streib and Dehmer, 2019; Lánczky and Győrffy, 2021).
2.4 Huber loss robust regression model for mathematical correlation:
We applied the Huber loss robust regression model to investigate the mathematical correlation between BC and control samples. This model intends to minimize residuals and utilize the concept of loss function to precisely determine the expected outcome. Thus, it is critical to pick the best-fitting loss function [mean square error (MSE) and mean absolute error (MAE)] with certain weight to outliers (Gupta et al., 2019). MSE is the sum of the squared distances between the target variable and predicted values, and MAE is the sum of the absolute differences between our target and predicted variables:
We used Huber loss/smooth mean absolute error, a mixture of both MSE and MAE. Huber loss is sensitive to outliers, differentiable at zero, the error becomes quadratic for small errors. Quadratic values depend upon the hyperparameter (δ, delta).
We also compared the mean performance of each method, Linear Regression, Huber Regression, RANSAC Regression, and Theil-Sen Regression and used a box and whisker plot to compare the distribution of scores across the cross-validation folds.
2.5 Validation of microarray results by quantitative PCR:
We validated the expression of over-expressed (KIAA0101, S100P, TO2A, RRM2, INHBA) and under-expressed (ADIPOQ, PLIN1, ADH1B, ABCA8, CHRDL1) genes by qPCR assay using Applied Biosystems StepOnePlus Real-Time PCR instrument (ThermoFisher Scientific, USA). Quantification was performed using PowerUp™ SYBR™ Green Master Mix using GAPDH1 as reference. DataAssist™ Software were used for initial Ct values calculation and comparative Ct (ΔΔCt) method was used for quantitative gene expression.
3 Results
A total of 54,675 probes mean were used to compare the expression values of tumors and controls with descriptive statistical parameters including mean, standard error, median, mode, standard deviation, sample variance, kurtosis, skewness, and range (Table 1). Initial analysis revealed 3126 probes passing the threshold values of fold change (±2) and p value (<0.05). We finally identified 1837 differentially expressed (up-and down-regulated) genes by applying Welch t-test at p < 0.001 and cross-validated discovered top 10 up and down expressed genes through KM survival analysis (Supplementary Table 1). A significant difference between tumor and control samples were established with the following values:
Descriptive Statistics
Mean Tumor
Mean Control
Mean
5.5674
5.5715
Standard Error
0.0085
0.0087
Median
5.1751
5.1403
Mode
5.205
5.4836
Standard Deviation
1.9788
2.0278
Sample Variance
3.9158
4.1121
Kurtosis
0.2685
0.274
Skewness
0.8154
0.8411
Range
11.3393
11.4354
Minimum
2.639
2.6563
Maximum
13.9782
14.0917
The mean value of tumor (6.824 ± 1.649) and control (7.414 ± 2.007), Welch’s t value (-12.70), Welch-Satterthwaite degree of freedom (6022.8) and p value < 0.0001. For the normality assumption, control samples were considered as an independent variable, whereas tumor as a dependent variable and 3126 probes mean gene expression values were found not to be fit within the normality assumption as tested by “Shapiro-Wilk test” and “D’Agostino’s K- squared” test. However, further investigation of the complete data set of 54,675 probes revealed a close to normal distribution of data and represented as histogram, probability- probability (PP), and quantile–quantile (QQ) plots for tumor and control samples (Fig. 1). Majority of the data set fits in the normal distribution while stragglers and curvature at either end of the normal probability indicated the lack of symmetry or presence of outliers in the dataset. We found skewness and kurtosis values between − 1 and + 1 indicating close to normal distribution.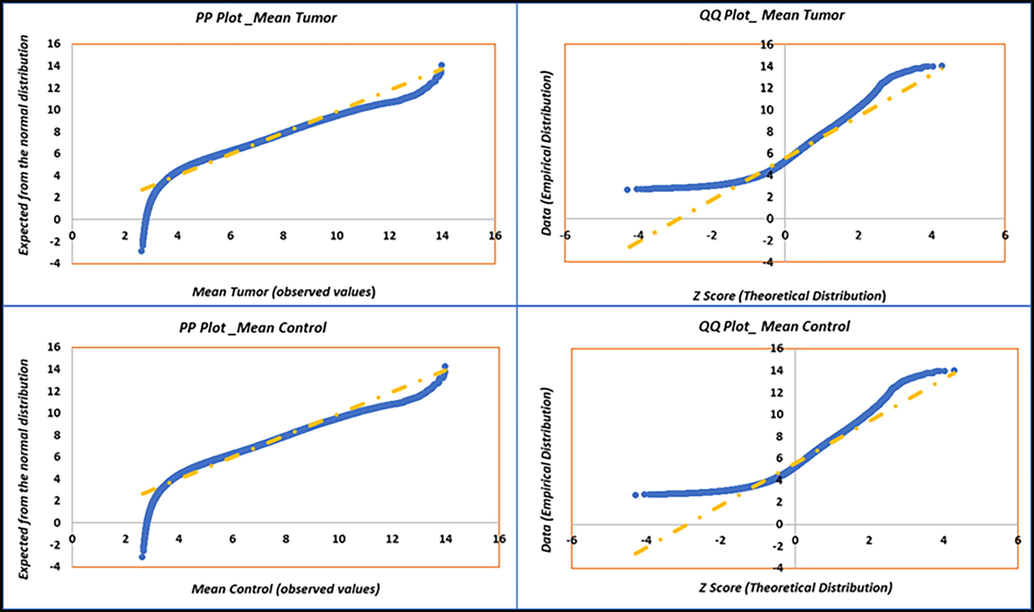
PP (Probability-Probability) and QQ (Quantile-Quantile) plots for the tumor and control variables with 54,675 probes mean gene expression values for normality check as the underlying assumption of Welch t-test: (A(top left)) PP plot of tumor, (B(bottom left)) PP plot of control, (C(top right)) QQ plot of tumor, and (D(bottom right)) QQ plot of control.
Furthermore, the Kaplan–Meier plot refined the experiment and analysis for the top 10 up- and-down-expressed genes as a drill-down approach and down streaming for survival analysis. Finally, we have 7 out of 10, KIAA0101, S100P, TOP2A, RRM2, INHBA, C15orf48, and CKS2 as important up-expressed genes, while 5 out of 10, ADIPOQ, PLIN1, ADH1B, ABCA8, and CHRDL1 are important down-expressed genes that can be considered as diagnostic, prognostic, and therapeutic biomarkers. Thus, in the present study, we selected the top 10 up and down regulated DEGs for discussion (Fig. 2).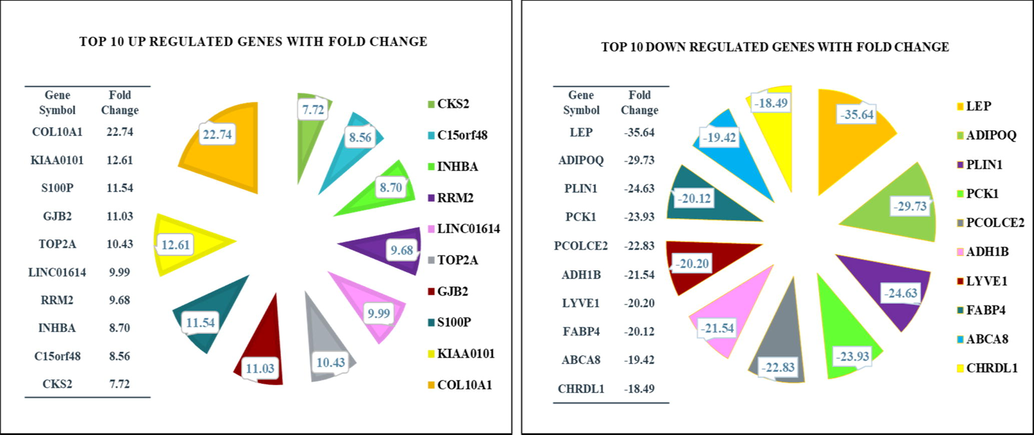
Graph represents the fold change of the top 10 up- and down-regulated differentially expressed genes after passing the filtration criteria.
Validation of differentially expressed genes were performed by real time PCR (qPCR) by calculating mean Rq, fold change and p-values. The qPCR confirmed the overexpression of KIAA0101, S100P, TO2A, RRM2, INHBA and under-expression of ADIPOQ, PLIN1, ADH1B, ABCA8, and CHRDL1 in the BC tissues (Fig. 3).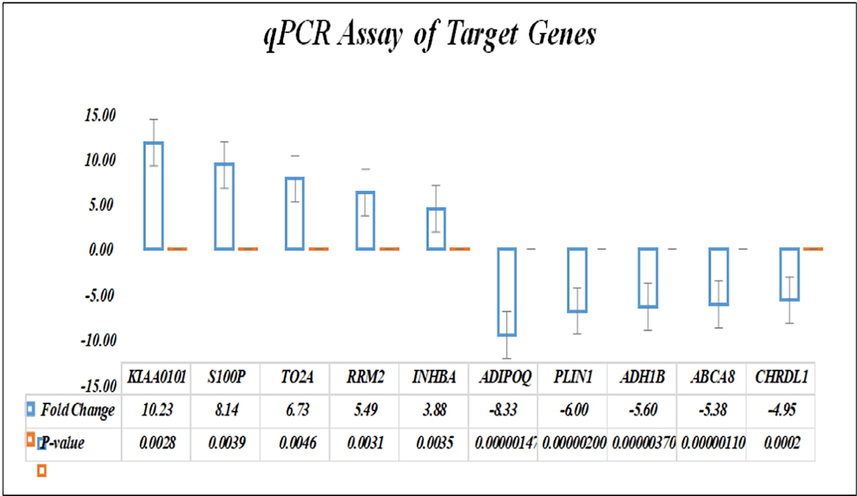
Bar graph showing quantitative expression of target genes with fold change and p-value.
Kaplan-Meier Plotter was used to confirm survival in a larger dataset and its association with the identified genes. KM Plot (Figs. 4 and 5) displays the top 9 differentially up and down- expressed genes, their Hazard ratio with 95 % confidence interval, log rank p values (Table 2). We consider the gene a significant biomarker for prognostic and therapeutic importance if the log rank p value < 0.05.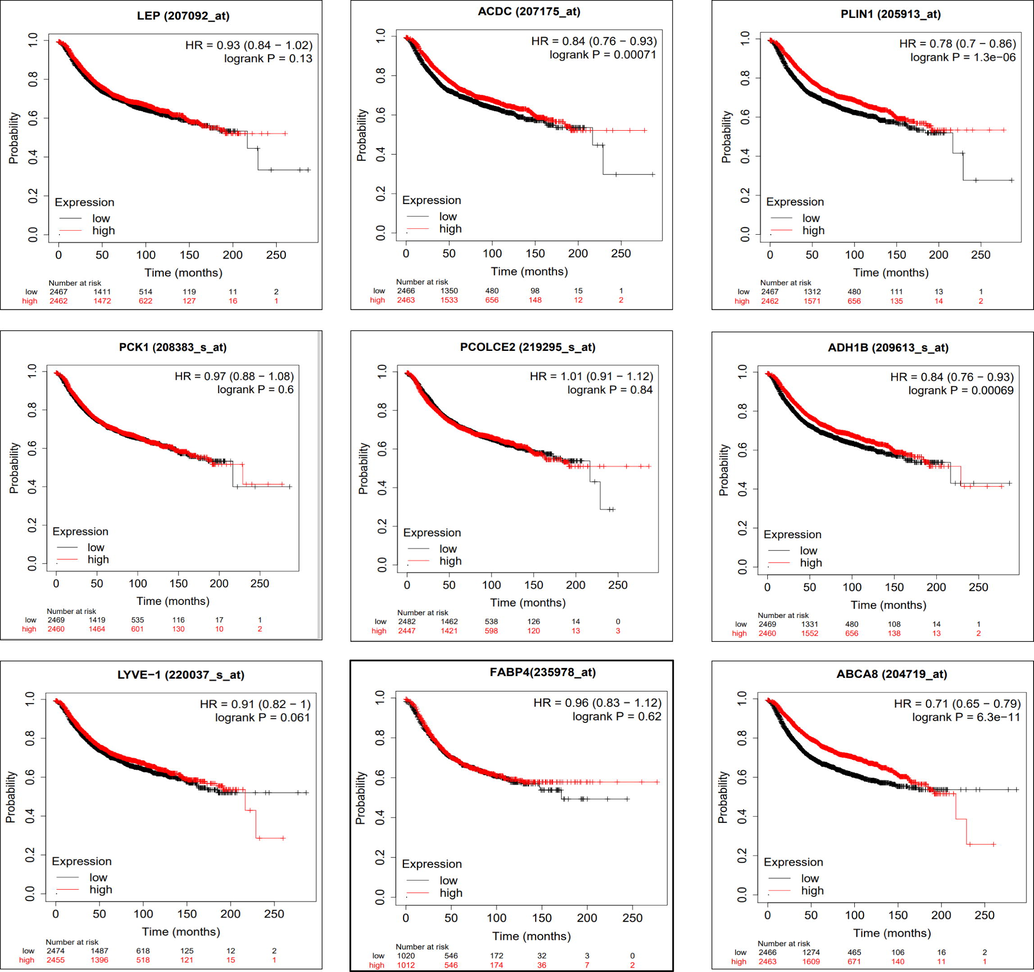
Figure shows the Kaplan–Meier metastatic relapse-free survival analysis for LEP, ADIPOQ/ACDC, PLIN1, PCK1, PCOLCE2, LYVE1, FABP4, ABCA8, and ADH1B genes along with the hazard ratio (HR) with 95% confidence intervals (CI) and log rank p value.
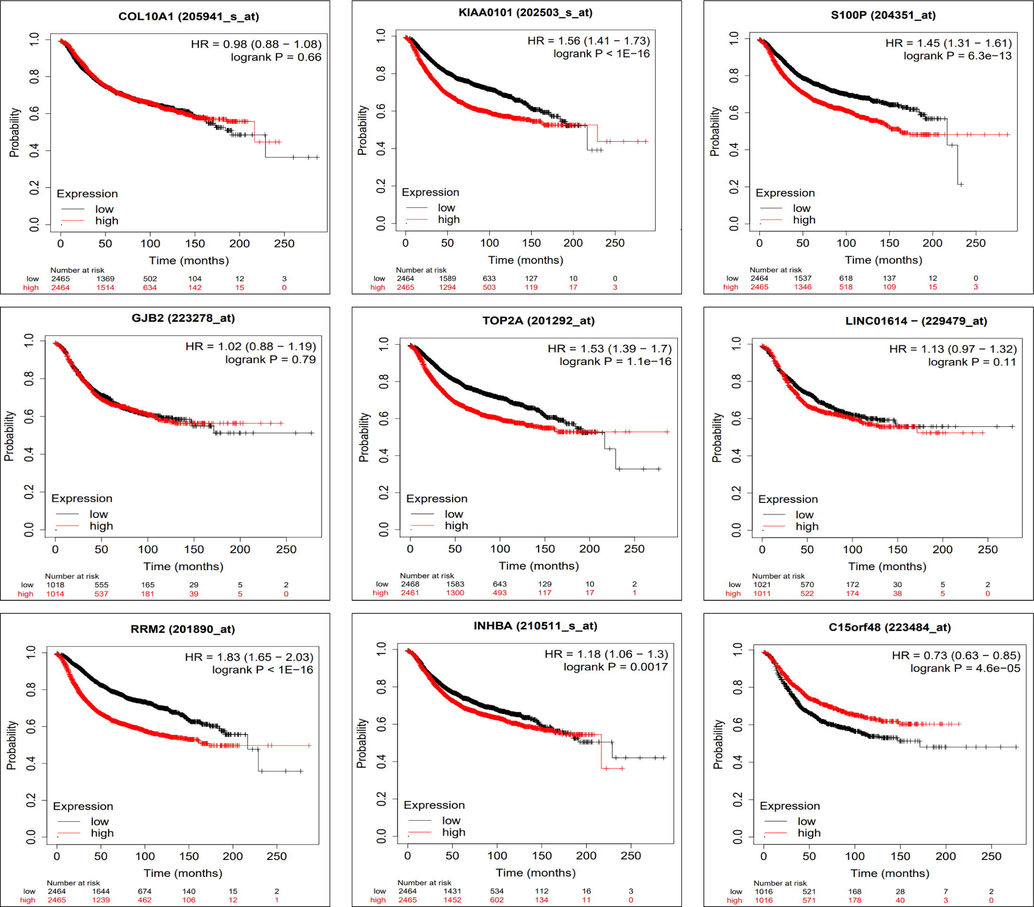
Figure shows the Kaplan–Meier metastatic relapse-free survival analysis for COL10A1, KIAA0101, S100P, GJB2, TOP2A, RRM2, INHBA, C15orf48, and LINC01614 genes along with the hazard ratio (HR) with 95% confidence intervals (CI) and log rank p value.
Gene Symbol
Fold
Change
Hazard Ratio
(HR)
Confidence
Interval (95 %)
Log rank p
value
Decision
COL10A1
22.74
0.98
0.88–1.08
0.66
Reject
KIAA0101
12.61
1.56
1.41–1.73
< 1e-16
Accept
S100P
11.54
1.45
1.31–1.61
6.3E-13
Accept
GJB2
11.03
1.02
0.88–1.19
0.79
Reject
TOP2A
10.43
1.53
1.39–1.70
1.1E-16
Accept
LINC01614
9.99
1.13
0.97–1.32
0.11
Reject
RRM2
9.68
1.83
1.65–2.03
< 1e-16
Accept
INHBA
8.70
1.18
1.06–1.30
0.0017
Accept
C15orf48
8.56
0.73
0.63–0.85
4.6E-05
Accept
CKS2
7.72
1.67
1.51–1.85
< 1e-16
Accept
LEP
−35.64
0.93
0.84–1.02
0.13
Reject
ADIPOQ
−29.73
0.84
0.76–0.93
0.00071
Accept
PLIN1
−24.63
0.78
0.70–0.86
1.30E-06
Accept
PCK1
–23.93
0.97
0.88–1.08
0.06
Reject
PCOLCE2
–22.83
1.01
0.91–1.12
0.84
Reject
ADH1B
−21.54
0.84
0.76–0.93
0.00069
Accept
LYVE1
−20.20
0.91
0.82–1.00
0.061
Reject
FABP4
−20.12
0.96
0.83–1.12
0.062
Reject
ABCA8
−19.42
0.71
0.65–0.79
6.30E-11
Accept
CHRDL1
−18.49
0.74
0.67–0.82
4.50E-09
Accept
Based on the Huber loss robust regression model, a weak correlation (0.439824) between the control and BC samples was found, representing significant difference in the two groups (cancer and control) as expected. Mean absolute error for Linear, Huber, RANSAC and Theil Sen Regression were 1.075 ± 0.020, 1.069 ± 0.020, 1.245 ± 0.105 and 1.093 ± 0.018 respectively. Comparative analysis results revealed Huber as the best performing regression model with MEA with standard deviation = 1.069 ± 0.020. A box and whisker plot revealed the distribution of results for each evaluated algorithm and lower distributions for the Huber robust regression algorithm found in compared to other linear regression algorithms. We have also shown best-fit line equations through linear Huber loss robust regression model, RANSAC Regression, and Theil Sen regression model (Table 3, Fig. 6).
Models
/Algorithms
MAE
Standard
Deviation
Regression
Coefficient
Regression
Intercept
Mean Tumor = coefficient ×
Mean Control + intercept
Linear
Regression1.075
0.02
0.50353571
3.09092
0.5035* Mean Control + 3.0909,
Huber
Regression1.069
0.02
0.47639532
3.219997
0.4763* Mean Control + 3.2199
RANSAC
Regression1.245
0.105
0.614
1.676
0.6140* Mean Control + 1.6700
TheilSen
Regression1.093
0.018
0.58977372
2.471666
0.5897* Mean Control + 2.4716
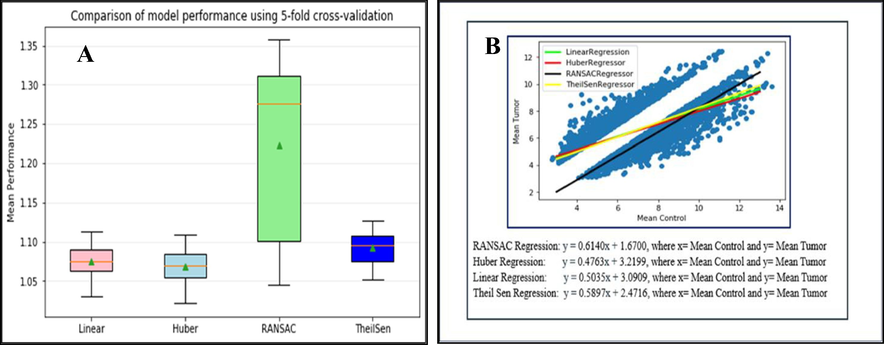
(A) Box and Whisker plot for Linear, Huber, RANSAC, and Theil-Sen regression models and (B): Scattered diagram with the best fit line through Linear, Huber, RANSAC and TheilSen regression models for comparative 3126 probes mean gene expression values in normal and tumor samples.
4 Discussion
The aim of the present study was to search for precise and robust statistical methods to identify the differentially expressed genes with a higher degree of mathematical confidence. Student’s t-test, Welch’s t-test, Trimmed Means t-Test, Yuen-Welch’s t-Test, and bootstrapped t-test are commonly used to compare two independent groups. Student’s t-test, frequently used for clinical datasets, must fulfill the underlying assumption of normality and homoscedasticity (homogeneity of variance) as prerequisites. Violation of assumptions may lead to biased, unsound, and unreliable mathematical inferences. Unfortunately, because of outliers, recording, or measurement errors, the assumptions of homoscedasticity are often violated. Ignoring the critical assumptions has an adverse impact on the validity of the test and should be addressed carefully for any version of t-test unless the researcher has strong reasons to suppose equal variance (Erceg-Hurn and Mirosevich, 2008). We, therefore, applied Welch’s t-test, a robust statistical method for comparing means to address the assumption of homoscedasticity and generate reliable results (Delacre et al., 2017; Karch, 2021). Next, to evaluate the prognostic values of most significantly genes, we cross-validated them on a survival scale.
Welch’s t-test identified 1837 DEGs (638 upregulated, 1199 downregulated) which might be playing a vital role in cancer origin and progression. The most significant genes might be a real game changers of breast tumor. However, it was not feasible to discuss the individual role of all genes in one manuscript. We, therefore, are focusing the top 10 up-and down- regulated genes and briefly discussing their diagnostic, prognostic, and therapeutic importance.
Leptin (LEP) was the most downregulated gene (FC −35.63), which plays a paramount role in the carcinogenesis of BC (Andò and Catalano, 2011). It increases the proliferation, migration, and invasion of BC cells and could be a novel biomarker for diagnosis, and a potential target for therapeutics (Huang et al., 2017; Maryam et al., 2017). However, Leptin’s log rank p value was 0.13, more than cut off < 0.05 of KM plot, hence, rejected as a potential prognostic biomarker. Downregulation of adiponectin C1Q and collagen domain containing (ADIPOQ) (FC −29.72) was reported to be responsible for the primary tumor initiation, maintenance or progression and aggressive BC phenotypes (Mamoor, 2021; Llanos et al., 2020). Perilipin1(PLIN1) was downregulated (FC −24.63) in BC as reported earlier and high expression of PLIN1 indicates longer survival of BC patients (Zhang et al., 2021). ADIPOQ and PLIN1 had log rank p-values 0.00071 and 0.0000013 and could be a potential prognostic biomarker.
Phosphoenolpyruvate carboxykinase1 (PCK1) and Procollagen C-Endopeptidase Enhancer2 (PCOLCE2) were associated with ovarian and BC (Finkernagel et al., 2016). Alcohol dehydrogenase 1B beta polypeptide (ADH1B) is well-established cancer biomarker (Polimanti and Gelernter, 2017). PCK1 and PCOLCE2 had high log rank p-value of 0.06 and 0.84 while ADH1B passed the cut-off with a log rank p value of 0.00069 for potential to be prognostic biomarkers. Lymphatic Vessel Endothelial Hyaluronan Receptor1 (LYVE1) causes disease by altered expression in lymphatic vessel endothelium and used as a cancer marker (Hara et al., 2018). Fatty acid binding protein 4 (FABP4) plays a crucial role in tumor progression, particularly in adipose tissue associated cancers by providing fatty acids to the tumor cells (Guaita-Esteruelas et al., 2018). ATP binding cassette subfamily A member8 (ABCA8) codes for transporter protein and found significantly downregulated in BC (Hlaváč et al., 2013). Chordin-Like1 (CHRDL1) is an established prognostic factor for BC, and downregulation of CHRDL1 advocates a low survival rate of BC patients (Li et al., 2019). LYVE1 and FABP4 did not pass the log rank p value cut off, while ABCA8 (6.30e-11) and CHRDL1 (4.5e-09) were acceptable as potential prognostic biomarkers in BC.
Collagen type X alpha1 (COL10A1) was the most upregulated gene (FC, 22.74) and over expression was reported to enhance the proliferation and metastasis of BC cells (Yang et al., 2020). KIAA0101 regulates the centrosome of dividing BC cells and enhances cell proliferation and progression (Lv et al., 2018). S100 calcium binding proteinP (S100P) increases chemo-resistivity in BC patients and has therapeutic importance (Cong et al., 2020). COL10A1 with high log rank p value was rejected while KIAA0101 and S100P with low log rank p-value (1e-16 and 6.3e-13) were highly accepted for potential prognostic and therapeutic importance. Overexpression of gap junction protein beta 2 (GJB2) is reported in early-stage BC and could be used for an early diagnostic marker (Liu et al., 2019). Topoisomerase II alpha (TOP2A) was reported to be linked to tumor grade in early-stage luminal BC (An et al., 2018). Over expression of long intergenic non-protein coding rna 1614 (LINC01614) and ribonucleotide reductase M2 (RRM2) were associated with overall poor survival of BC patients (Wang et al., 2020; Mazzu et al., 2019). GJB2 (0.79) and LINC01614 (0.11) were rejected while TOP2A (1.1e-16) and RRM2 (1e-16) had high acceptance range for potential biomarkers. Over-expression of inhibin betaA (INHBA) increases the motility of BC cells (Yu et al., 2021). Chromosome15 open reading frame48 (C15orf48) and Cdc28 protein kinase regulatory subunit2 (CKS2) were overexpressed in BC and responsible for initiation and progression (Mamoor, 2021). INHBA; C15orf48 and CKS2 with log rank p values of 0.0017, 0.000046 and 1e-16 respectively, were good candidate for prognostic marker. Pedraza et al. focused on the classification of phenotypes with stages of BC, ER (estrogen receptor) status, tumor histology, and lymph node involvement. However, we designed the experiment in a slightly different way wherein focus was concentrated on gene expressions, irrespective of stages of BC, ER status, tumor histology, and lymph node involvement (Kaplan and Meier, 1958).
Additionally, we checked the mathematical relation between BC and control samples via a robust mathematical method (Huber loss robust regression model) and compared it with other regression models (Linear, RANSAC, and Theil-Sen) to get mathematical confidence. Two well-known loss functions are mean square error (MSE, L2 Loss) and mean absolute error (MAE, L1 Loss), and both have some advantages and disadvantages. We applied a mixture of MSE/L2 and MAE/L1 in Huber loss robust regression model as it is sensitive to outliers than the squared error loss, differentiable at zero, the error is squared for small values. It gives less weight to outliers with extreme values. Based on the solid theoretical and mathematical justification, the result showed a weak relationship between tumor and control samples, as both groups are different from each other.
Previous group had used a moderate student t test for normal data and Mann Whitney test for non-normal data analysis (Kaplan and Meier, 1958). However, we have gone one step further as a complementary approach with underlying assumptions of the mathematical model using robust Welch's t test and tried to correlate control and tumors samples through the Huber loss robust regression model. Additionally, first, we cross-validated the reanalysis results using Kaplan– Meier plot to examine if the expression values are linked with the overall metastatic relapse- free survival of BC patients and second confirmed the expression level by qPCR assay on bigger cohort of BC. Thus the significantly expressed genes have prognosis, diagnosis, and therapeutics potential and needs to be further evaluated.
5 Conclusions
Statistical method like Welch Satterthwaite t-test and Huber loss robust regression model algorithms gave mathematical confidence in detecting DEGs and improved the understanding of microarray gene expression profiling of BC. It revealed a weak mathematical relation (co– relation coefficient: 0.43) that represents the differences between tumor and control samples. Using minimum underlying assumptions for Welch Satterthwaite t-test and Kaplan-Meier estimator plot models were novel approach. Refined survival analysis of most significantly expressed genes showed twelve genes correlated with the overall metastatic relapse-free survival. Finally, ten clinically associated genes were validated by qPCR that may be promising diagnosis, prognosis, and/or therapeutics biomarkers of BC.
CRediT authorship contribution statement
Sajjad Karim: Conceptualization, Supervision, Project administration, Writing – original draft. Md Shahid Iqbal: Conceptualization, Data curation, Investigation, Methodology, Writing – original draft. Nesar Ahmad: Conceptualization, Supervision. Md Shahid Ansari: Formal analysis, Data curation, Writing – review & editing. Zeenat Mirza: Methodology, Writing – original draft. Adnan Merdad: Data curation, Writing – review & editing. Saddig D. Jastaniah: Project administration. Sudhir Kumar: Conceptualization, Project administration, Writing – review & editing.
Acknowledgment
This study was funded by King Abdulaziz University under grant No. (2-117-1434-HiCi). The authors acknowledge the technical and financial support of KAU. We would also like to thank AZIZ Supercomputing facilities at High Performance Computing Center for their help and support.
Disclosure of funding
This paper was funded by King Abdulaziz University, under grant No. (2-117-1434-HiCi). The authors, therefore, acknowledge technical and financial support of KAU.
Ethics Approval and Consents:
Ethic approval and consent of participants do not apply here as the study was based on statistical analysis of data retrieved from public database (GEO, NCBI). However, biobank samples were used for validation study.
Availability of Data
The clinicopathological information and datasets (.CEL file) supporting the results of this article were submitted to NCBI’s Gene Expression Omnibus (GEO) under accession number GSE10810.
Declaration of Competing Interest
The authors declare that they have no known competing financial interests or personal relationships that could have appeared to influence the work reported in this paper.
References
- The prognostic significance of topoisomerase II alpha protein in early stage luminal breast cancer. BMC Cancer. 2018;18(1):pp.
- [CrossRef] [Google Scholar]
- The multifactorial role of leptin in driving the breast cancer microenvironment. Nat. Rev. Endocrinol.. 2011;8(5):263-275.
- [CrossRef] [Google Scholar]
- Baguley, T. 2012. “A guide to advanced statistics for the behavioral sciences,” Serious stats. Houndmills: Palgrave Macmillan, 2012, [Online]. Available: https://books.google.fr/books?hl=fr&lr=&id=ObUcBQAAQBAJ&oi=fnd&pg=PP1&dq=baguley+2012 &ots=-eiUlHiCYs&sig= YUUKZ7jiGF33wdo3 WVO-8l-OUu8.
- “Breast cancer”, Who.int, 2021, [Online]. Available: https://www.who.int/news-room/fact- sheets/detail/breast-cancer. [Accessed: 10- Sep- 2021].
- Calcium-Binding Protein S100P Promotes Tumor Progression but Enhances Chemosensitivity in Breast Cancer. Front. Oncol.. 2020;10
- [CrossRef] [Google Scholar]
- Regression Models and Life-Tables. J. Roy. Stat. Soc.: Ser. B (Methodol.). 1972;34(2):187-202.
- [Google Scholar]
- A comparative study of statistical methods used to identify dependencies between gene expression signals. Brief. Bioinform.. 2013;15(6):906-918.
- [CrossRef] [Google Scholar]
- Why Psychologists Should by Default Use Welch’s t-test Instead of Student’s t-test. International Review of Social Psychology. 2017;30(1):92.
- [CrossRef] [Google Scholar]
- Introduction to Survival Analysis in Practice. Machine Learning and Knowledge Extraction. 2019;1(3):1013-1038.
- [CrossRef] [Google Scholar]
- Modern robust statistical methods: An easy way to maximize the accuracy and power of your research. Am. Psychol.. 2008;63(7):591-601.
- [CrossRef] [Google Scholar]
- The transcriptional signature of human ovarian carcinoma macrophages is associated with extracellular matrix reorganization. Oncotarget. 2016;7(46):75339-75352.
- [CrossRef] [Google Scholar]
- The peritumoural adipose tissue microenvironment and cancer. The roles of fatty acid binding protein 4 and fatty acid binding protein 5. Mol. Cell. Endocrinol.. 2018;462:107-118.
- [CrossRef] [Google Scholar]
- Descriptive statistics and normality tests for statistical data. Ann. Card. Anaesth.. 2019;22(1):67.
- [CrossRef] [Google Scholar]
- Inhibition of tumor formation and metastasis by a monoclonal antibody against lymphatic vessel endothelial hyaluronan receptor 1. Cancer Sci.. 2018;109(10):3171-3182.
- [CrossRef] [Google Scholar]
- The expression profile of ATP-binding cassette transporter genes in breast carcinoma. Pharmacogenomics. 2013;14(5):515-529.
- [CrossRef] [Google Scholar]
- Leptin promotes the migration and invasion of breast cancer cells by upregulating ACAT2. Cell. Oncol.. 2017;40(6):537-547.
- [CrossRef] [Google Scholar]
- Nonparametric Estimation from Incomplete Observations. J. Am. Stat. Assoc.. 1958;53(282):457-481.
- [Google Scholar]
- Karch, J. 2021. “Choosing Between the Two-sample T Test and its Alternatives: A Practical Guideline,” doi: 10.31234/osf.io/ye2d4.
- Web-Based Survival Analysis Tool Tailored for Medical Research (KMplot): Development and Implementation. J. Med. Internet Res.. 2021;23(7):e27633.
- [Google Scholar]
- Downregulation of LINC01140 is associated with adverse features of breast cancer. Oncol. Lett. 2019
- [CrossRef] [Google Scholar]
- ID2 and GJB2 promote early-stage breast cancer progression by regulating cancer stemness. Breast Cancer Res. Treat.. 2019;175(1):77-90.
- [CrossRef] [Google Scholar]
- Gene expression of adipokines and adipokine receptors in the tumor microenvironment: associations of lower expression with more aggressive breast tumor features. Breast Cancer Res. Treat.. 2020;185(3):785-798.
- [CrossRef] [Google Scholar]
- KIAA0101 inhibition suppresses cell proliferation and cell cycle progression by promoting the interaction between p53 and Sp1 in breast cancer. Biochem. Biophys. Res. Commun.. 2018;503(2):600-606.
- [CrossRef] [Google Scholar]
- Mamoor, S. 2021. “Differential expression of CKS2 in cancers of the breast,” 2021, doi: 10.31219/osf.io/zdhr3.
- Mamoor, S. 2021. “Differential expression of adiponectin, C1Q and collagen domain containing in cancers of the breast,” 2021, doi:10.31219/osf.io/9zcx8.
- Effect of quercetin on secretion and gene expression of leptin in breast cancer. J. Tradit. Chin. Med.. 2017;37(3):321-325.
- [CrossRef] [Google Scholar]
- A Novel Mechanism Driving Poor-Prognosis Prostate Cancer: Overexpression of the DNA Repair Gene, Ribonucleotide Reductase Small Subunit M2 (RRM2) Clin. Cancer Res.. 2019;25(14):4480-4492.
- [CrossRef] [Google Scholar]
- The global health burden of infection-associated cancers in the year 2002. Int. J. Cancer. 2006;118(12):3030-3044.
- [CrossRef] [Google Scholar]
- Gene expression signatures in breast cancer distinguish phenotype characteristics, histologic subtypes, and tumor invasiveness. Cancer. 2010;116(2):486-496.
- [Google Scholar]
- Global burden of cancers attributable to infections in 2012: a synthetic analysis. Lancet Glob. Health. 2016;4(9):e609-e616.
- [CrossRef] [Google Scholar]
- ADH1B: From alcoholism, natural selection, and cancer to the human phenome. American Journal Of Medical Genetics Part B: Neuropsychiatric Genetics. 2017;177(2):113-125.
- [CrossRef] [Google Scholar]
- The two-sample t test: pre-testing its assumptions does not pay off. Stat. Pap.. 2009;52(1):219-231.
- [CrossRef] [Google Scholar]
- Advantages and limitations of microarray technology in human cancer. Oncogene. 2003;22(42):6497-6507.
- [CrossRef] [Google Scholar]
- Pan-cancer analysis reveals the role of long non-coding RNA LINC01614 as a highly cancer-dependent oncogene and biomarker. Oncol. Lett.. 2020;20(2):1383-1399.
- [CrossRef] [Google Scholar]
- Collagen Type X Alpha 1 (COL10A1) Contributes to Cell Proliferation, Migration, and Invasion by Targeting Prolyl 4-Hydroxylase Beta Polypeptide (P4HB) in Breast Cancer. Med. Sci. Monit.. 2020;27
- [CrossRef] [Google Scholar]
- Inhibin β-A (INHBA) induces epithelial– mesenchymal transition and accelerates the motility of breast cancer cells by activating the TGF-β signaling pathway. Bioengineered. 2021;12(1):4681-4696.
- [CrossRef] [Google Scholar]
- The landscape of viral associations in human cancers. Nat. Genet.. 2020;52(3):320-330.
- [Google Scholar]
- Expression status and prognostic value of the perilipin family of genes in breast cancer. Am. J. Transl. Res.. 2021;13(5):4450-4463. [Online].Available:
- [Google Scholar]
Appendix A
Supplementary material
Supplementary data to this article can be found online at https://doi.org/10.1016/j.jksus.2022.102447.
Appendix A
Supplementary material
The following are the Supplementary data to this article:


