

Translate this page into:
Finite element analysis of three-stage micro-sieves based microfiltration technique
⁎Corresponding author. suganthi.s@rajalakshmi.edu.in (S. Suganthi) suganthirec@yahoo.com (S. Suganthi)
-
Received: ,
Accepted: ,
This article was originally published by Elsevier and was migrated to Scientific Scholar after the change of Publisher.
Abstract
Background
The micro-sieves filter out the suspended solid particles and microorganisms from the sample fluids such as water, blood samples, etc. Water is the most essential element among all the natural resources. It gets polluted as it flows and comes in contact with the atmosphere or earth’s surface. The reduction of suspended particles such as iron, manganese and chemical oxygen dissolved in the water makes it potable Micro-sieves are microfiltration membranes with uniformly patterned pores of size in the range of 0.1–50 µm.
Objectives
The main objective of the study was to analyze the three-stage microfiltration using COMSOL 4.3a with micro-sieves of pore size as low as 0.1 μm in the third stage.
Methods
This study involves finite element analysis performed using the COMSOL Multiphysics® software package. Modeling of a three-step microfiltration process utilizing micro-sieves with pore sizes as small as 0.1 m has been demonstrated.
Results
Particles that are smaller than the pores of the membranes are retained on the surface of the membrane. The filtration efficacy against dissolved solids, removal of turbidity and microorganisms is determined by the size of the pores in the membranes. The changes in pressure and velocity are studied at the output of each microfiltration membrane. The pressure has decreased by 2 mPa and the velocity has increased by 0.13 µm/s after the third stage of filtration demonstrating the removal of microorganisms.
Conclusion
The findings of the finite element analysis performed by the COMSOL multiphysics® program has provided us with the option to develop these devices using microfluidic mixers and microsieves.
Keywords
Microorganism
Micromixer
Microsieves
Filtration
Solid particles
Finite element analysis

1 Introduction
Water is the source of energy for all living creatures. The drinking water should be clean, clear and free from impurities. Impurities get mixed with water as it moves through the atmosphere, along the earth's surface, and collects the soil particles in the ground. Also, the human activities increase the levels of impurities. Chemicals from factories and human wastes, if allowed to enter the water channels, create severe health problems. Excessive mud particles and other solids make water unsuitable for drinking. Also, as water flows, it dissolves and carries with it the things it comes across such as heavy metals, which may be caused by the damaged pipes that carry water from its source to the consumer (WHO, 2011). In addition to man-made chemicals and minerals (Peirce et al., 1998; Nguyen et al., 2019) microorganisms such as cyanobacteria, Escherichia coli, green algae, pollute the water and make it unsafe. These particles if excessive should be considered as contaminants. A contaminant in drinking water may make it unpalatable or even unsafe. Many diseases like pneumonia, pontiac fever and arthritis are caused due to these impure particles present in water (Lee, 2010). Microfiltration using micro-sieves helps to remove the above contaminants. The micro-sieves consist of thin selective layer made of flexible membranes with well-defined and uniform pores. This structure enables them to exhibit permeability and selectivity that conventional membranes cannot achieve. The size of the pores ranges in the orders of micrometer (Warkiani et al., 2011). Mixing can be performed in microfluidic channels using paramagnetic particles that combine to form linear chains under an applied external magnetic field (Piontek and Czyżewska, 2012). The so-created chains can be magnetically actuated to manipulate microscopic fluid flow (Kalaiselvi et al., 2020). The application of microfiltration in dairy industry is reported (Fernández García et al., 2013) by Leticia et al. Mixing of analytes in microfluidic Lab-on-Chip systems using electro kinetic process is presented by (Oddy et al., 2001). The antibiotic resistance genes (ARGs) are considered as serious environmental pollutants (Pooran et al., 2005), environmental scientists and engineers are working to curb the spread of ARGs in the environment (Sehar et al., 2013). Biswal and Gast (2004) reported that microfiltration, a standard procedure in sample preparation, is also useful in the quick detection of certain pathogens. Schwartz et al. (2003) examines the issue of micro-sieve pores clogging up due to flow resistance. These membranes are required in many micro systems used in biological and chemical applications (Prasanth and Narayanan, 2020). The thickness of the membranes of micro-sieves must be compatible with the pore sizes. On the one hand, a thin membrane guarantees a small flow resistance but on the other hand the mechanical strength is reduced. The individual positioning of each single pore in a polymer micro-sieve can be obtained by inkjet printing (Li et al., 2013). Researchers report a wide variety of micro-sieve designs for use in microfiltration membranes (Brans et al., 2006; Jahn et al., 2010; Väänänen et al., 2016; Koh et al., 2008; Goedel et al., 2018). Further, Wright et al. (2004) have reviewed the field-based studies in developing countries where water is transported from a source outside the home and then stored within the household). The review is restricted to microbiological measures of contamination and excludes chemical aspects of water quality. Also, the microorganisms vary in their size and affect the various organs of the body in different capacities.
Coming back to the evolution of micro-sieves, Van Rijn et al. (1997) came up with a new idea that using techniques adopted in semiconductor technology, thin membranes with perfectly uniform pores can be fabricated. With a silicon wafer as a support and a silicon nitride layer as the sieving layer, he fabricated his first so-called ‘micro-sieve’. The pores in the 1-μm thick membrane had a diameter of 5 μm and further decreased the pore size close to 1 μm. In this work, we have reported the simulation of three-stage microfiltration using COMSOL 4.3a with micro-sieves of pore size as low as 0.1 μm in the third stage.
2 Materials and methods
To create a real-world like model for the simulation process, a micromixer stage is included as the first stage for fluid- particle mixing. The mixed particles are of different sizes in the order of micron to realize the size of bacteria and algae. The output of micromixer is carried over to the microfiltration stages using micro-sieves. Fig. 1 showed the process flow of filtration using micromixer and micro-sieves. As a first step, impurities are mixed with pure water using micromixer. The output of micromixer is given to the first stage of microsieves. The filtering is accomplished in 3 stages using microsieves of sizes 50 µm, 10 µm and 0.1 µm, respectively, corresponding to the size of various microorganisms. The final output is purified potable water which is free of organoleptic water parameters.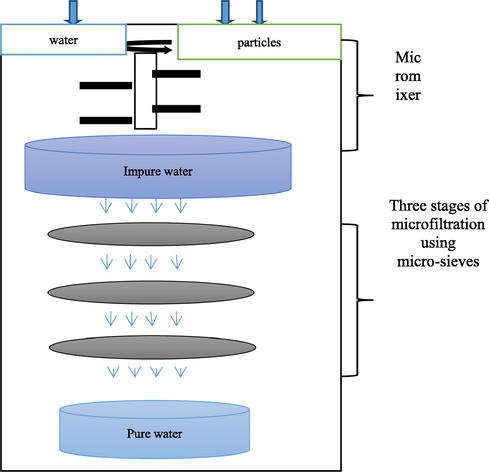
Pictorial representation of process flow of micromixer and different stages of filtration using microsieves.
3 Results
The simulation and analysis of the micromixer and microsieves using COMSOL software help us to obtain the requirements for particle filtration using microsieves. The Model builder window of COMSOL helps to build the model and inspect its contents and structures in the model tree. The modelling procedure is controlled through the model builder window, which includes the model tree with all the functionality and operation for building, solving and displaying the results. The study requires physics such as particle tracing for fluid flow (fpt), rotating machinery particle flow (rmspf) and laminar flow.
3.1 Module 1: Micromixer
Using the micromixer stage, particles of various sizes are mixed with water. The microorganisms such as Salmonella enterica of size 0.7 µm, Cynobacteria of size 35 µm and Green algae of size 60 µm are given as inputs to the micromixer through the different inlets of micromixer. The polluted water is made to pass through the microfiltration stages.
3.1.1 2D modeling and study of mixer
The micromixer is a concentric cylindrical structure with three inlets and one outlet each having a width and height of 1 µm and 0.5 µm respectively. The outer circle has a radius of 3 µm while the inner circle has a radius of 1.3 µm. The pictorial representation is shown in Fig. S1. A cruciform structured rotating spindle of diameter and height 2 µm and 0.1 µm, respectively, is present at the center of inner circle. This helps in uniform mixing of the microorganisms of varying sizes with water. After building the geometry of the mixer, meshing is implemented to obtain accurate results in simulation.
Meshing helps to perform finite element analysis of the mode through small units of simple shapes, called mesh elements. The mesh generator discretizes the domains into triangular or quadrilateral mesh elements. If the boundary is curved, these elements represent an approximation of the original geometry (Fig. S2). The sides of the triangles and quadrilaterals are called mesh edges, and their corners are mesh vertices. A mesh edge must not contain mesh vertices in its interior. The boundaries defined in the geometry are discretized (approximately) into mesh edges, referred to as boundary elements (or edge elements), which must conform to the mesh elements of the adjacent domains. The geometry vertices are represented by vertex elements.
Fig. 2 shows the velocity output of the simulation carried out for 2D Mixer. A uniform velocity observed at the 3 inlets of micromixer is 0.02 m/s but as at the outlet the surface velocity magnitude increases to 0.08 m/s. It defines that the finely mixed output has a high velocity. The particles are given in different sizes and color. Particles of size 0.7 µm, 35 µm and 60 µm and color red, blue and green respectively are given as inputs at the 3 inlets. The mixer mixes the particles and we obtain a mixed output at the outlet of our mixer.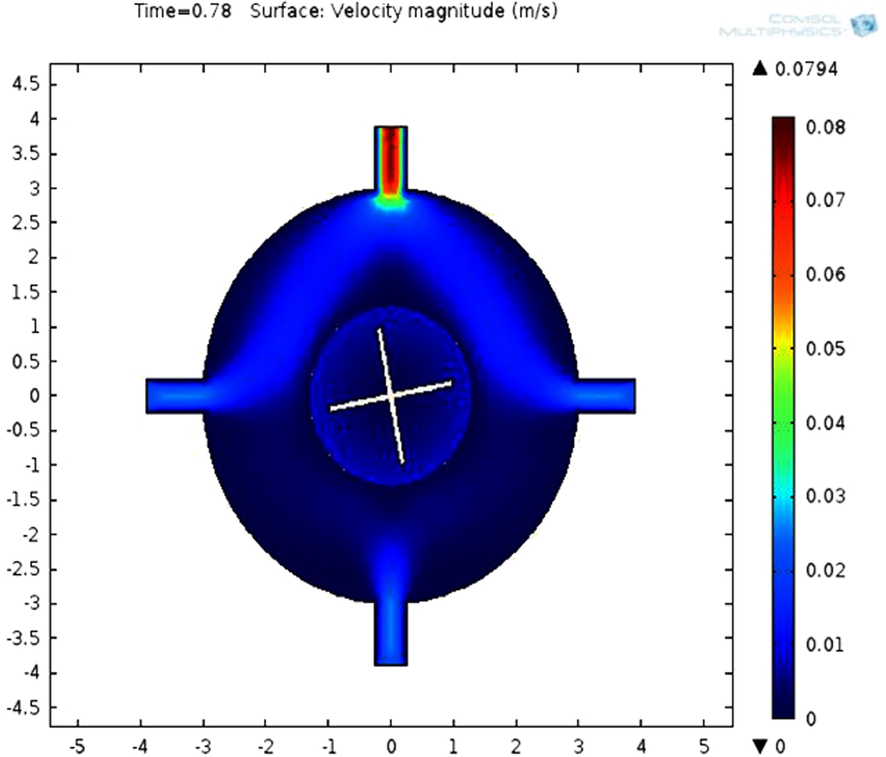
Velocity output of 2D Mixer.
As observed in the velocity profile, the initial velocity of water at the inlet1 is 0.08 m/s. But after mixing with pollutants through the inlets 2 and 3, the velocity is reduced to 0.02 m/s at the outlet. A detailed analysis of progress of mixing at increasing time intervals is presented Fig. 3 (a). Mixing is initiated at 0.16 µsec and is completed at 2 µsec.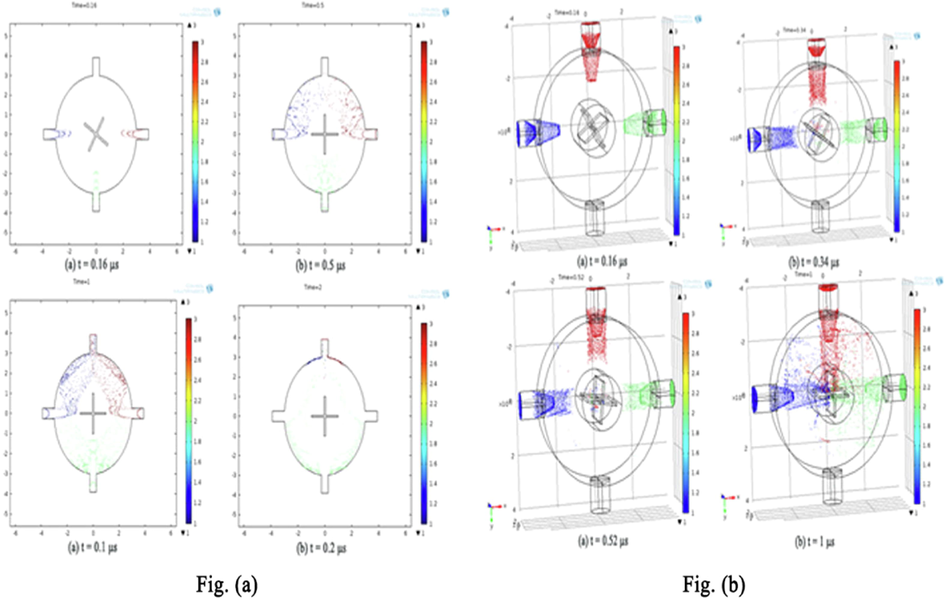
Particle mixingat various time duration: (a) 2D model; (b) 3D model.
3.1.2 Geometry of 3D micromixer
In the 3D modeling of micromixer, radius and thickness of outer cylinder have been chosen as 3000 µm and 2000 µm respectively (Fig. 3b). For the inner cylinder, the radius and height are selected as 1000 µm and 2000 µm respectively. The width and height of rotating spindle are both equal to1 µm. The radius and height of the inlet ports and outlet ports are each 1000 µm. The particles of different sizes and color are given as inputs at the 3 inlets. Red coloured particles are of size 0.7 µm, while blue- and green-coloured particles have sizes of 35 µm and 60 µm respectively. The mixer mixes the particles and at the outlet we obtain the contaminated solution. At the end of 1 µsec, we can observe the complete migration of particles towards the fins of the rotating spindle. This enables faster mixing of pollutants with water. The so-created polluted water has to be purified using 3-stage filtering through the microsieves of sizes in the decreasing order.
3.2 Module 2 - microsieves
The microsieves module consists of three stages of microfiltration corresponding to the sizes of the particles that were mixed in the micromixer stage (Fig. S3).Initial analysis is carried out for single stage of microfiltration only. A rectangular block of width and height 650 µm is selected. The pores are of uniform diameter and thickness of 50 µm. The spacing between the sieves is selected as 250 µm. This structure shown in Fig. 7 helps in removing the particles of size larger than 50 µm. The velocity of the water is lowered at the middle of the cylindrical pores of the microsieves. Therefore, it is observed to be 0.004 m/s at inner diameter of the 50 µm pores. After it reaches the bottom of the pores the velocity is increased to 0.005 m/s (Fig. 4a). Further, the filtration can be confirmed with the help of the pressure profile. The pressure observed in outer region of diameter 50 µm pores is equal to 0.8551 Pa (Fig. 4b). As the water reaches the middle of the pores, pressure is lowered to 0.5416 Pa. Again, at the sieve’s outer boundary, it further decreases to 0.1386 Pa as water moves towards the outlet of the sieve.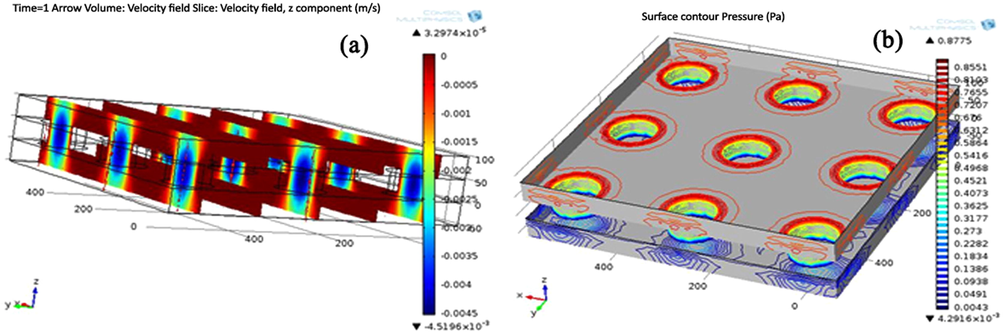
Velocity output of 50 µm sized microsieves, bottom of the pore (a) and outer region (b).
With the addition of the second stage, the 3D view of the microsieves is represented in Fig. 4. The radius and height of the cylindrical plate of the second stage is 750 µm and 250 µm respectively. The second stage of sieves is designed to have a radius of 10 µm and height of 250 µm (Fig. S4).The velocity of the water observed in the regions surrounding the microsieves of pore sizes 50 µm and 10 µm decreases with time after the third stage of filtration. The velocity outputs at various instants of time are provided in Fig. 5a-d and Table 1.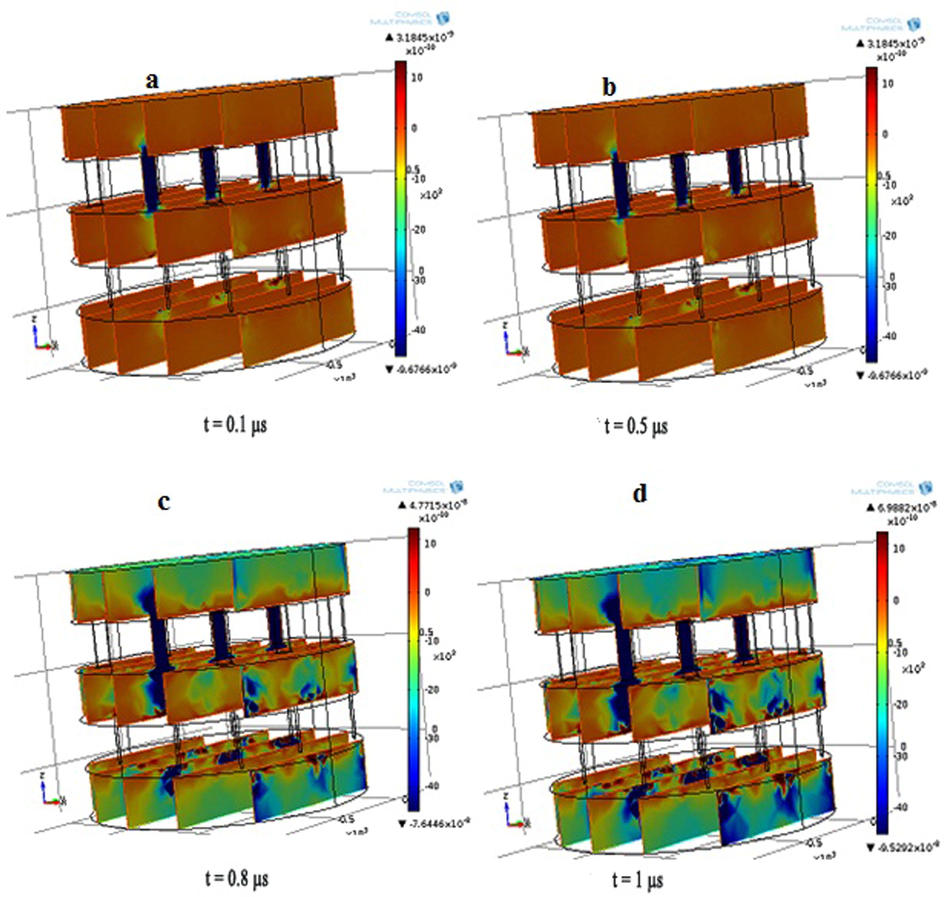
Velocity measure of two stage microsieves. The velocity outputs at various instants of time.
Time (µsec)
Velocity at the Outlet (nm/sec)
t = 0.1
3.1845
t = 0.5
20.938
t = 0.8
47.715
t = 1
69.882
3.3 Pressure output of two stage microsieves
Pressure is observed to be more around the pores and is measured to be 0.6323 Pa. Through the microsieves the pressure falls to 0.2512 Pa in the middle of the pores and finally drops to 0.0087 Pa (Fig. 6; Table 2).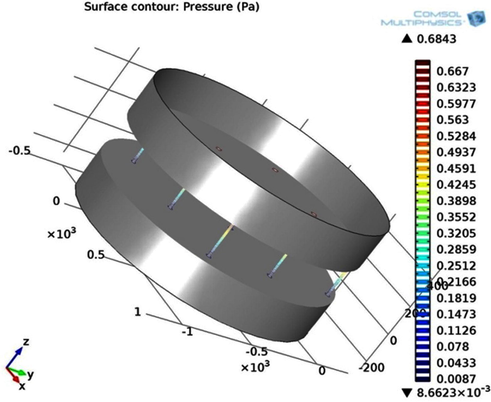
Pressure output of two stage microsieves.
Point of Measurement
Pressure at the Outlet (Pa)
Above the pores
0.6323
Middle of the pores
0.2512
Bottom of the pores
0.0087
3.4 Geometry of particle tracing
Particles having sizes of more than 50 µm are filtered out of the 50 µm sieves (Fig. S5). In Fig. 7, the two particles in green and red colors are of sizes 40 µm and 5 µm respectively. Hence, they are passed through 50 µm sieves of the first stage. The 10 µm sieves in the second stage filter out the green-colored particles finely and allow the red-colored particles to pass through them. The red-colored particles are finally filtered out of the 0.1 µm sieves.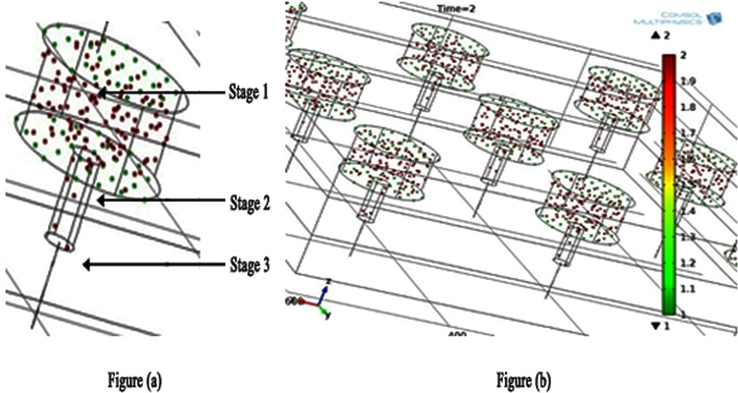
3D view of the pores forming the three stages of microfiltration (a) and array of pores in the micro sieve plates forming the three stages of microfiltration (b).
Overall, the simulation results have shown that the velocity and pressure at the output of mixer are 0.08 m/s and 0.093 Pa respectively. The particle sizes after the first and second stage of filtration were 15 µm and 7 µm respectively. In the third stage with 0.1 µm pore size, all the given particles are removed. The outlet pressure is decreased to 0.078 Pa after microfiltration and velocity is increased to 0.1386 m/s showing that the impurities have been removed.
4 Conclusion
It has been established that it is possible to simulate the microfiltration phases of the water purification process by employing micro-sieving mechanism. The membrane’s pore size plays a vital role on the efficiency of filtration process against dissolved solids, as well as the removal of turbidity and microorganisms. Variations in pressure and velocity at the output of each microfiltration membrane are also studied to determine their efficacy in microbial removal. Results suggest that the filtration process is most successful when the velocity increases while the pressure decreases. The findings of the finite element analysis performed by the COMSOL multiphysics® program have provided us with the option to develop these devices using microfluidic mixers and microsieves. Microfiltration membranes have their application in dairy and food processing industries for microbial and fat removal. Proper designing and fabrication of the microsieves is critical to realize highly efficient microfiltration.
Data availability
The raw/processed data required to reproduce these findings cannot be shared at this time as the data also forms part of an ongoing study.
Availability of data and material
Not applicable.
Code availability
Not provided.
Authors' contributions
The first and eighth author had explained the problem, helped in execution of the work and framed the manuscript. The second author was responsible for analysis of results, proof reading the manuscript. The contribution of third, fourth, fifth, sixth and seventh authors were in modeling and simulation of the proposed accelerometer. All authors were equally contriuted to finalize the manuscript as per journal policies.
Acknowledgment
The authors express their gratitude to Princess Nourah bint Abdulrahman University Researchers Supporting Project number (PNURSP2022R92), Princess Nourah bint Abdulrahman University, Riyadh, Saudi Arabia.
Declaration of Competing Interest
The authors declare that they have no known competing financial interests or personal relationships that could have appeared to influence the work reported in this paper.
References
- Micromixing with linked chains of paramagnetic particles. Anal. Chem.. 2004;76(21):6448-6455.
- [Google Scholar]
- Optimization of the membrane and pore design for micro-machined membranes. J. Membrane Sci.. 2006;278(1–2):239-250.
- [Google Scholar]
- Microfiltration applied to dairy streams: removal of bacteria. J. Sci. Food Agri.. 2013;93(2):187-196.
- [Google Scholar]
- Printing Reinforcing Structures onto Microsieves That Are Floating on a Water Surface. Langmuir. 2018;35(6):2196-2208.
- [Google Scholar]
- Jahn, S., Ebert,S., Hackert, M., Goedel, W., Schubert, A., Baumann, R., 2010. Simulation of the Mechanical Stability of Inkjet-Printed Hierarchical Microsieves, Excerpt from the Proceedings of the COMSOL Conference 2010, Paris.
- Analysis of damping optimization through perforations in proof-mass of SOI capacitive accelerometer. Analog Integr. Circ. S.. 2020;102(3):605-615.
- [Google Scholar]
- Microfiltration with silicon nitride microsieves and high frequency backpulsing. Desalination. 2008;224(1–3):88-97.
- [Google Scholar]
- Serial particle size fractionation and water quality in a recirculating aquaculture system for eel. Fish. Aqua. Sci.. 2010;13(2):133-139.
- [Google Scholar]
- Rapid sample processing for detection of food-borne pathogens via cross-flow microfiltration. Appl. Environ. Microbiol.. 2013;79(22):7048-7054.
- [Google Scholar]
- Fundamentals and Applications of Microfluidics. Artech House; 2019.
- Environmental Pollution and Control. Butterworth-Heinemann; 1998.
- Efficiency of drinking water treatment processes. removal of phytoplankton with special consideration for cyanobacteria and improving physical and chemical parameters. Polish J. Environ. Studies. 2012;21(6):1797-1805.
- [Google Scholar]
- Pooran, R., Tung, S., Kim, J.W., 2005, January. Application of a PDMS microsieve for the patterning of flagellar motors in a microfluidic system. In ASME International Mechanical Engineering Congress and Exposition, vol. 4224, pp. 37–41.
- Design and development of a high reliability portable heater for low temperature medical applications. Seybold Rep.. 2020;15:379-383.
- [Google Scholar]
- Detection of antibiotic-resistant bacteria and their resistance genes in wastewater, surface water, and drinking water biofilms. FEMS Microbiol. Ecol.. 2003;43(3):325-335.
- [Google Scholar]
- Sehar, S., Aamir, R., Naz, I., Ali, N., Ahmed, S., 2013. Reduction of contaminants (physical, chemical, and microbial) in domestic wastewater through hybrid constructed wetland. ISRN Microbiol. 2013, Article ID 350260, 9 pages, https://doi.org/10.1155/2013/350260.
- Microsieving in primary treatment: effect of chemical dosing. Water Sci. Technol.. 2016;74(2):438-447.
- [Google Scholar]
- Deflection and maximum load of microfiltration membrane sieves made with silicon micromachining. J. Microelectromech. Sys.. 1997;6(1):48-54.
- [Google Scholar]
- Fabrication of multi-layer polymeric micro-sieve having narrow slot pores with conventional ultraviolet-lithography and micro-fabrication techniques. Biomicrofluidics. 2011;5(3):036504.
- [Google Scholar]
- WHO, G., 2011. Guidelines for drinking-water quality. vol. 216, World Health Organization, Geneva, pp. 303–304.
- Household drinking water in developing countries: a systematic review of microbiological contamination between source and point-of-use. Trop. Med. Int. Health.. 2004;9(1):106-117.
- [Google Scholar]
Appendix A
Supplementary material
Supplementary data to this article can be found online at https://doi.org/10.1016/j.jksus.2022.102497.
Appendix A
Supplementary material
The following are the Supplementary data to this article:


