

Translate this page into:
Facile and efficient sequestration of uranium using biomass from Saudi Arabia’s local date palms waste
⁎Corresponding author. drskhan@ksu.edu.sa (Salah Ud-Din Khan)
-
Received: ,
Accepted: ,
This article was originally published by Elsevier and was migrated to Scientific Scholar after the change of Publisher.
Abstract
Kingdom of Saudi Arabia has announced to utilize its domestic resources to enhance its future nuclear power capacity to a total of 17.6 GW by 2040. This ambitious plan is followed by mining and extraction of uranium from various approaches both physically and chemically. Therefore, an economical and efficient approach was devised for harvesting uranium content from aqueous solutions by using two bio-sorbent, i.e., date pit sawdust (DPS) and date palm biowaste (PDB). The DPS and PDB were analyzed with BET surface area, FT-IR, SEM, EDX, pHPZC and XRD techniques to examine the surface area, porosity, functional group on surface, morphology, point of zero charge of the materials and nature of materials respectively. Effect of parameters like sorbent dose, solutions pH, concentrations and time of contact on adsorption were studied in a batch method. The findings indicated that both DPS and PDB exhibited significant sequestration of U(VI) with maximum adsorption observed at 6 pH. However, PDB exhibited the maximum sorption percentage (78.80 %) and capacity (3.25 mg/g), followed by DPS (70.5 %, 2.47 mg/g, respectively), for uranium sequestration.
Keywords
Date pit sawdust
Palm datebiowaste
Sequestration
Energy
Uranium

1 Introduction
Recently, Kingdom of Saudi Arabia (KSA) has reported to use its huge resource of uranium and plan for mining and extracting uranium contents in a very transparent way ahead of its peaceful use of nuclear energy mission. The country is rich with date palm trees and their extracted wastes which are being used in various applications as well. The uranium is certainly radioactive and toxic with higher grade of polluting the environment instability. However, the search for eco-friendly and cost-effective methods are being used for its adsorption with high biosorption capacity (Embaby et al., 2022; Singh et al., 2024). Uranium is inhabitantly a highly toxic and radioactive element with half-life spanning in billions of years. Therefore, recovery of uranium in either way is essential from various resources like industrial waste, seawater and phosphoric acid.
The Kingdom of Saudi Arabia step into the peaceful use of nuclear energy includes the generation of 17.6 GW by 2040 through installation of nuclear power plants, development of novel technologies, innovative recovery methods, utilize fewer resources in less time and to support environment degradation. Various studies are performed for extraction of uranium from liquid solutions including precipitation method (Dinis and Fiúza, 2021), ion-exchange method (Naushad et al., 2015; Chen et al., 2022), solvent extraction method (Ali et al., 2020), membrane extraction (Torkabad et al., 2017), and adsorption methods (Ali et al., 2020). For large scale application, it is observed that biosorption processes are more applicable and incase of kingdom, there are plenty of palm date trees and other biowaste resources.
The current study is devised to utilize low-cost PDB and DPS biomass for sequestration of uranium from aqueous solutions. Therefore, to examine the efficiency of these biosorbents, the effect of a range of parameters such as changes in contact time, pH, dose, and initial concentrations of U(VI) ions has been evaluated. Through the evaluation of these variables, the research sought to identify the best circumstances for harvesting uranium by employing PDB and DPS biomass as biosorbents.
2 Materials and methods
2.1 Materials
All the chemicals utilized in the current research work were of analytical quality, and the solutions were produced with Milli-Q water. For this study, two distinct biosorbents were chosen: date palm biowaste (PDB) and date pit sawdust (DPS) obtained from agricultural research form inside the University. Substituting precisely weighed amounts of uranyl nitrate (UO2(CH3COO)2·2H2O; BDH Ltd., England) in deionized water yielded the U(VI) stock solution. To alter the pH of the solutions, additional chemicals were used, such as nitric acid 70 % (Sigma-Aldrich), NaOH 97.5 % (BDH Chemicals Ltd., England), and HCl 37 % (Panreac Quimica).
2.2 Preparation of biosorbents
The obtained PDB from old palm date tree were cut into 1–2 cm pieces, thoroughly washed multiple times and dried for five hours at 110 °C. The dried PDB were ground into powder and sieved through a 0.180 mm mesh screen for consistent particle size. Similarly, date pits were washed, dried and ground into powder after being chopped into small pieces with a cutter. The homogenized samples were sieved through a 0.180 mm mesh and kept in a dry bottle.
2.3 Adsorbent characterization
The surface properties of PDB and DPS were assessed using a Micromeritics Gemini VII 2390 (USA) BET. The nitrogen adsorption and desorption isotherms are measured by the automated system at a temperature of −196 °C and a relative pressure range of 0.05–1.0. Additionally, at a specific relative pressure of 0.95, the pore size diameter of PDB and DPS was examined using the BJH adsorption technique (Supplementary data). A FlowPrep 060 sample degassing system from Micromeritics, was used for each sample prior to the surface property investigation. This included heating the samples to 150 °C in a nitrogen flow for 60 min in order to remove any moisture and volatile gasses that might have been present on the sample surfaces. The structural characteristics of the PDB and DPS adsorbents were assessed using a scanning electron microscope (SEM) from Jeol, Japan (at 20 kV). Besides, the elemental composition of both PDB and DPS was determined using an energy-dispersive X-ray analyzer (EDX), integrated into the SEM. FTIR analysis was conducted to examine functional groups. The acidity or basicity of the PDB and DPS surfaces were evaluated by obtaining the point of zero charge (PZC) (Supplementary data). The samples were examined by ICP-MS to determine the presence of U(VI).
2.4 Batch experiment
The batch adsorption method was adopted for U(VI) extraction at room temperature using biosorbents (PDB and DPS). To generate a 50 ppm stock solution of U(VI), 500 ml of deionized water was used to dissolve UO2(CH3COO)2·2H2O To assess the U(VI) adsorption efficiency on PDB and DPS from water, a series of experiments in batch process were conducted by studying the effect of various parameters including pH: 2–9; U(VI)conc:10–100 ppm; (PDB and DPS)ads:0.1–0.8 g; and contact time:30–240 min. A sequence of 50 ml capped Erlenmeyer flasks containing 15 ml of the U(VI) stock solution were implemented. The pH level was adjusted by the addition of 0.1 M of NaOH or HCl. The desired concentration of each component was attained by the addition of appropriate amount of adsorbent suspension and U(VI) solution to the Erlenmeyer flasks followed by oscillation under controlled atmosphere. The contact time was varied by varying the oscillation duration at 200 rpm to attain the equilibrium. The mixture was then screened through Whatman filters. The filtrate was analyzed with ICP-MS to evaluated the residual content. Every experiment was run three times. The sorption capacity (qe) and percent removal (R%) of PDB and DPS were calculated using Eqs. (1) and (2):
3 Results and discussion
3.1 Characterization analysis
3.1.1 BET analysis of biosorbents
The surface area and porosity of the adsorbents play an important role as a physical parameter in the adsorption process. Both these characteristics typically enhance the adsorptive capacity of an adsorbent, particularly in pure physisorption procedures (Gedam and Dongre, 2016). The detailed data regarding BET, surface areas and pore volumes of PDB and DPS can be found in Table 1. A specific surface area (SBET) of 5.51 m2/g and a total pore volume (VPTotal) of 0.015 cm3/g were measured for the PDB biosorbent. Additionally, a mesopore surface area (SMeso.) 5.51 m2/g and a mesopore volume (VMeso.) of 0.015 cm3/g were observed. However, micropore surface area and volume were not detected in this sample. Conversely, for the DPS sample, an SBET of 2.55 m2/g, a SMeso. 2.55 m2/g, a VPTotal of 0.004 cm3/g, and a VMeso. of 0.004 cm3/g were measured. Similar to the PDB sample, no micropore surface area and volume was observed in the DPS biosorbent. The date pit's closely packed structure is the reason for DPS's somewhat lower surface area as compared to PDB. The following equation (III) was used to determine the mesopore volumes (VMeso).
Where, Total pore volume: VPTotal, Micropore volume: VMicro., Mesopore volume: VMeso., Surface area: SBET, Micropore surface area: SMicro.
No.
Biosorbents
SBET (m2/g)
SMicro. (m2/g)
SMeso. (m2/g)
VPTotal (cm3g−1)
VMicro. (cm3g−1)
VMeso. (cm3g−1)
1
PDB
5.51
0.00
5.51
0.015
0.000
0.015
2
DPS
2.55
0.00
2.55
0.004
0.000
0.004
3.1.2 Porosity of biosorbents
The adsorption/desorption isotherms of PDB and DPS are illustrated in Fig. 1. The presence of a hysteresis loop during the nitrogen adsorption and desorption processes indicated significant nitrogen adsorption above a P/Po ratio of 0.4 for PDB and 0.6 for DPS. The IUPAC classification of the nitrogen adsorption–desorption isotherms for DPS shows features of a Type IV isotherm, with a relatively tight hysteresis loop in the region of P/Po (0.7–1.0), that is generally seen in mesoporous materials. PDB, on the other hand, exhibits a classic Type IV isotherm, a characteristic commonly observed in mesoporous materials, with a large H4 hysteresis loop between 0.4 and 1.0P/Po. This found that capillary condensation in tiny, slit-type holes facilitates both mono and multilayer absorption (Ahmad et al., 2023).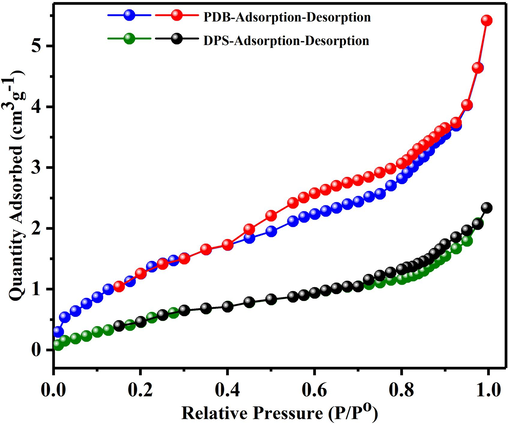
Adsorption/desorption isotherms of PDB and DPS.
3.1.3 IR analysis
PDB and DPS biosorbents were evaluated by using FTIR spectroscopy in terms of the functional groups and chemical structure. The FTIR spectra for both PDB and DPS before and after interacting with U(VI) were obtained with wavenumber (400–4000 cm−1) as shown in Fig. 2 (a,b). The functional groups identified in both the absorbents and their corresponding peaks were in line with the literature (El-Hendawy, 2006). It can be observed that the broad and robust band at wave number 3420 cm−1 corresponds to –OH functional group. Due to their involvement in hydrogen bonding, these functional groups appears in this lower region. Similarly, the strong absorption peaks appeared at 2930 and 2865 cm−1 primarily correspond to the asymmetric C–H and symmetric stretching vibration respectively. The absorption bands appeared at 1750 and 1600 cm−1 can be attributed to the stretching of the carbonyl C⚌O present in aldhydes, esters and ketone groups. The stretching of aromatic skeletal is clearly evident in the spectrum with bands appeared at 1520 and 1442 cm−1. The peaks appeared at 1244 and 815 cm−1 may be associated with esters such as CH3–CO–O– as well as with cyclic C–O–C functional groups conjugated with C⚌C–O–C in aromatic or olefinic structures representing the major constituents in the lingo-cellulose such as –OCH3 in ethers (Gomez-Serrano et al., 1996). PDB and DPS are predominantly composed of –OH and –COOH functional groups (cellulose, hemicellulose, and lignin). It has been observed that, the positions of these bands remained unchanged after the reaction and no new peaks were obtained after interaction with U(VI), thus suggesting that the adsorption of U(VI) onto the biosorbents does not take place via active functional groups. The results are consistent with Kalavathy et al. [22], which propose, H+ is displaced from free hydroxyl groups in cellulose, hemicelluloses, and lignin by heavy metal cations. The IR analysis suggests that ion exchange is likely the predominant mechanism involved in the adsorption of U(VI). The reduction in transmittance and a slight peaks shift obtained after reaction may be associated with the substitution of H+ by UO22+ leading to depression in vibration intensity.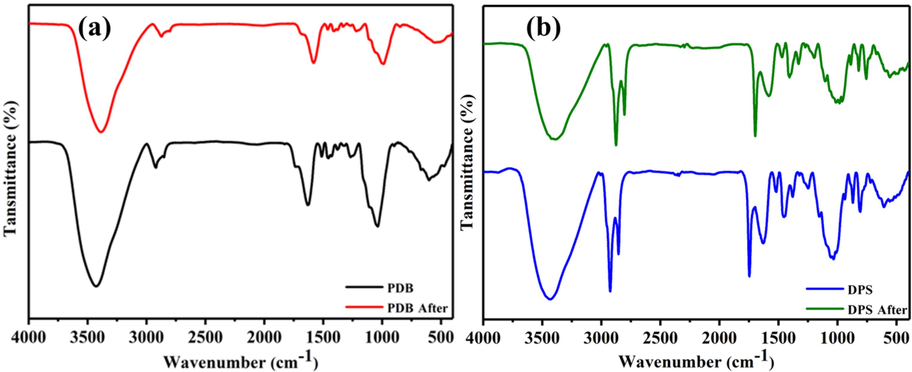
FTIR analysis (a) PDB IR spectra (before and after reaction) (b) DPS IR spectra (before and after reaction).
3.1.4 Morphological and elemental analysis
The structural characteristics of the biosorbents were pre-assessed and post-absorption using SEM. In Fig. 3, SEM images and elemental composition of PDB and DPS before and after absorption are presented. PDB showcased a curved, flaky microstructure featuring a blend of pores, grooves, bulges, cracks, and cavities, establishing potential pathways for U(VI) adsorption. These structural attributes significantly enhance the interaction between the solvent and sorbent, thereby amplifying surface area and porosity for efficient adsorption activities. The presence of pores not only expands the surface area but also provides crucial pathways and adsorption sites for U(VI) in water. These structural elements facilitate the diffusion of U(VI) ions into the active sites of the adsorbent, thereby heightening the adsorption efficacy of PDB (Druzian et al., 2021). Conversely, DPS exhibited a partially smooth and coarse particle morphology characterized by a compact and dense structure. Notably, no visible surface pores were detected. Instead, the inter-particle voids were evident due to the irregular coarse particles and variations in particle size. The comparatively lower adsorption capacity of DPS might be attributed to its compact and smooth morphology, resulting in reduced surface area and limited interaction with U ions compared to PDB. The EDX analysis conducted on both biomass specimens (PDB and DPS) before and after adsorption (Fig. 3 b and f for PDB and Fig. 3 d and h for DPS, pre- and post-absorption, respectively) indicated a predominant composition of C and O elements. Furthermore, the post-adsorption EDX analysis confirmed the extraction of U(VI) (Fig. 3 f and h).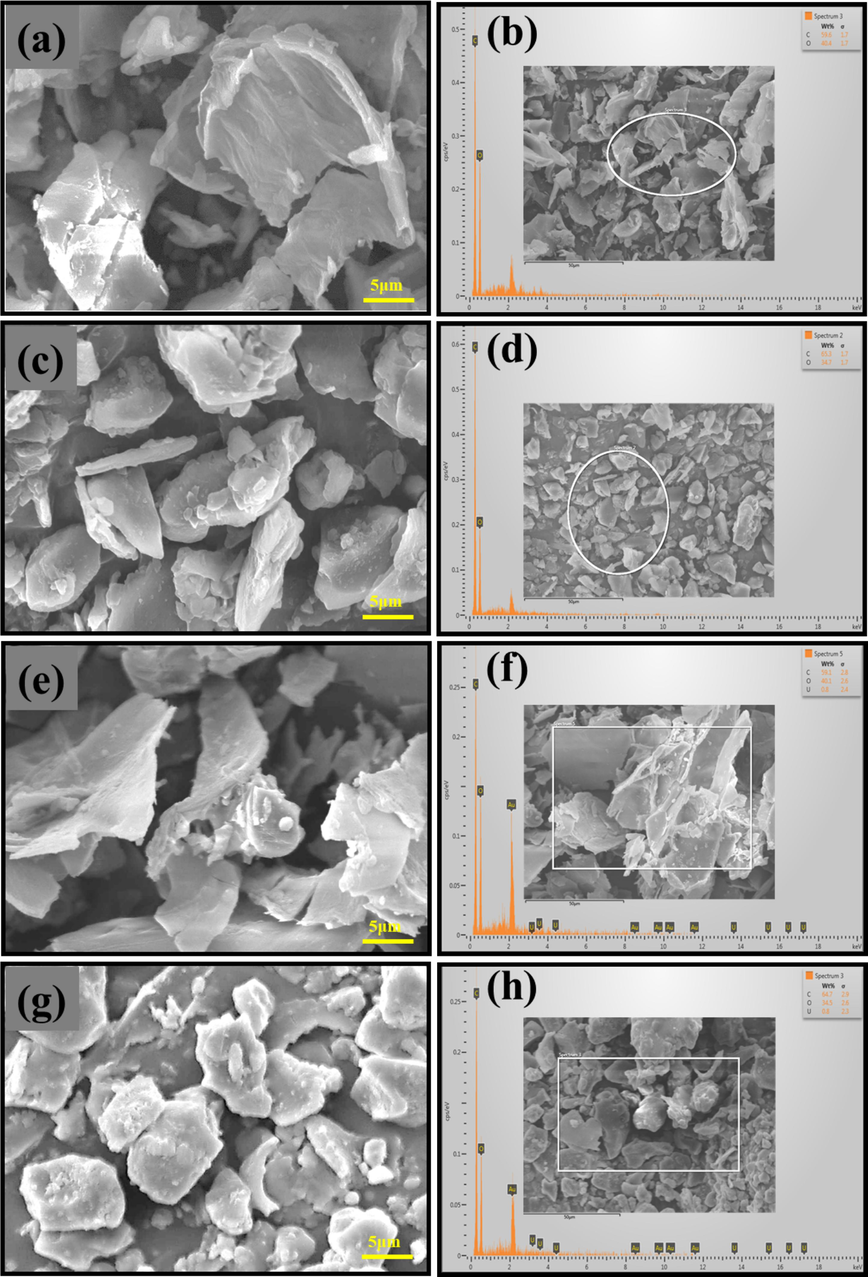
SEM and EDX of biosorbents before and after adsorption of U(VI): (a) PDB, (b) U-loaded PDB, (c) DPS, (d) U-loaded DPS.
3.2 Adsorption analysis
3.2.1 Effect of contact time
The extraction of U(VI) on 0.5 g of biomass sorbents at 50 ppm U(VI) concentration over a range of (0–240 min) contact times at a pH 6.0 and 7.0 for PDB and DPS respectively, is depicted in Fig. 4. The adsorption rate displayed a rapid increase over time (Wang et al., 2009), achieving roughly 78.8 % sorption and 1.18 mg/g sorption capacity for PDB, while for DPS, it reached approximately 70.5 % sorption with a sorption capacity of 1.05 mg/g at equilibrium. The significant increase is predominantly observed within the initial 120 min, after which the rate of increase diminishes, indicating that the sorption process approaches equilibrium at around 120 min. Consequently, all sorbent-solution mixtures were shaken for a minimum of 120 min in further experiments to achieve complete equilibrium.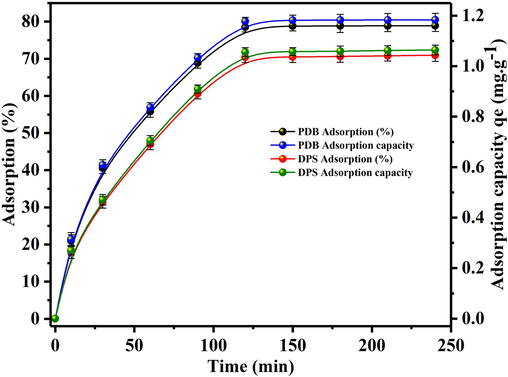
Effect of time on the adsorption of U(VI) on biosorbents (PDB and DPS).
3.2.2 Effects of pH
The uranium biosorption process is notably influenced by the solution pH value. This is due to alterations in both charge on the surface of the biosorbent and the speciation of uranium ions that occur in relation to changes in pH in the solution (Yusuff, 2019). In Fig. 5, it's evident that the U(VI) adsorption capacity and adsorption percentage of the two biosorbents gradually increased with rising pH levels. The findings displayed in Fig. 5 illustrate a higher percentage of adsorption and capacity of U(VI) within the pH range from 1.0 to 6.0 and 7.0. Specifically, PDB exhibited peak values around 77.7 % adsorption and 1.16 mg/g adsorption capacity, while DPS showed approximately 70.2 % adsorption and 1.05 mg/g adsorption capacity. Subsequently, the adsorption capacity began to decline beyond pH levels of 6.0 and 7.0 for PDB and DPS, respectively. At low pH, the abundance of hydrogen ions saturates the active sites on the biosorbent surface. Consequently, the U(VI) ions (UO22+) compete with the (H+) or H3O+ ions for these active sites, leading to a reduced capacity for U(VI) ion uptake by the biosorbent. However, the adsorption of U(VI) ions steadily declined with an increase in pH levels. When the solution's pH exceeds the point of zero charge (pHpzc > 4.7 and 5.0), the biosorbent surface carries a net negative charge. This negatively charged surface is more favorable for the adsorption of U(VI) ions. The interaction occurs through ion-exchange mechanisms, where the U(VI) ions, existing in the solution as positively charged species, are attracted to and exchange with other positively charged ions on the biosorbent surface due to electrostatic forces (Xiao-teng et al., 2019). Therefore, enhance the capacity for U(VI) ion adsorption onto the biosorbent. Certainly, as the pH rises beyond 6 and 7 for PDB and DPS respectively, there are a notable reduction in the percent adsorption and capacities. This decline can be attributed to the formation of alternate chemical forms or even precipitation (Yusuff, 2019). At these higher pH levels, uranium tends to transform into different states or even precipitate out of the solution, thereby diminishing its accessibility for adsorption onto the biosorbent.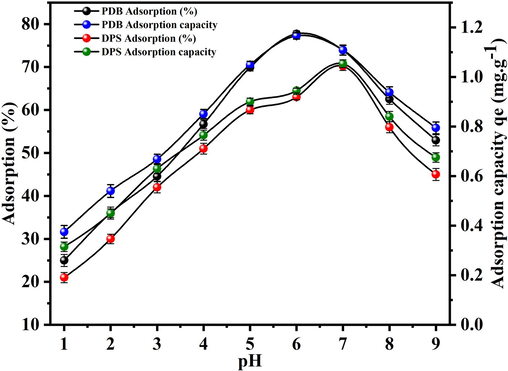
Adsorption of U(VI) on biosorbents (PDB and DPS) with pH variation.
3.2.3 Effect of dosage
The impact of varying adsorbent dosages (ranging from 0.1 to 0.8 g) on the adsorption of U(VI) was examined by introducing these different amounts of biosorbents into 15 mL solutions containing 50 mg/L U(VI) initial concentration for 2 h at room temperature.
The findings are displayed in Fig. 6. The maximum biosorbents efficiency for uranium removal was 79.22 % and 71.5 % by PDB and DPS respectively, with a dose of 0.8 g. It is apparent from Fig. 6 that the U(VI) extraction percentage increased as the biosorbent dose increased. This can be accredited to the greater surface area provided by higher biosorbent amounts and the increased presence of functional groups available for extraction (Wang et al. 2022). Consequently, elevating the biosorbent dose can enhance the removal of U(VI). However, an increase in the biosorbent dose resulted in a decrease in the U(VI) adsorption capacity. Fig. 6 also demonstrates that as the dosage of biosorbents increases, the adsorption capacity of both PDB and DPS for U(VI) decreases: from 3.25 to 0.74 mg/g for PDB and from 2.47 to 0.67 mg/g for DPS. Many researchers have proposed that a high biomass dosage may lead to increased electrostatic interactions between biosorbent cells, potentially limiting the availability of binding sites. This situation could reduce the total surface area for U(VI) ion biosorption due to the overlapping and aggregation of excessive biomass (Zhang et al., 2016; Yuan et al., 2020). Simultaneously, the results also revealed that, the U(VI) adsorption percentage and capacity for the biosorbent material of PDB is higher than DPS.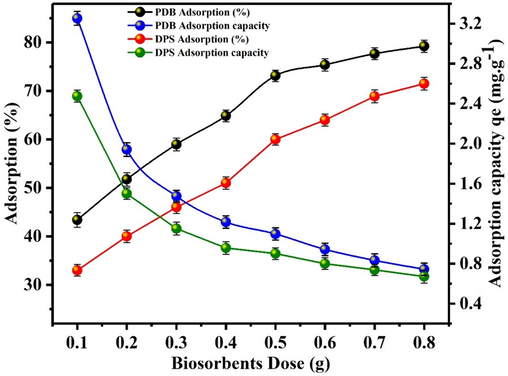
Effect of dosage of biosorbents (PDB and DPS) on the adsorption of U(VI).
4 Conclusions
The presence of functional groups (hydroxyl, amino, and carboxyl) in biosorbents offer an effective and convenient approach to sequester uranium from aqueous solutions. The physical properties of biosorbents and the presence of these functional groups play an important role in facilitating the uranium biosorption process through ion exchange, uranium absorption, and coordination mechanism. In the current study, PDB and DPS demonstrated a specific surface areas of 5.51 m2/g and 2.55 m2/g respectively due to which PDB exhibits a higher adsorption capacity compared to DPS. For PDB, the maximum uranium extraction percentage was found to be 78.80 %, with an adsorption capacity of 3.25 mg/g. In contrast, DPS exhibited a maximum uranium extraction percentage of 70.5 % and an adsorption capacity of 2.47 mg/g. Consequently, owing to the cost-effectiveness, eco-friendly and ready availability of biosorbents, they emerge as promising choices for efficient adsorption of U(VI) from aqueous solution treatment processes.
CRediT authorship contribution statement
Ashfaq Ahmad: Writing – review & editing, Writing – original draft, Validation, Software, Methodology, Investigation, Formal analysis, Data curation, Conceptualization. Salah Ud-Din Khan: Writing – review & editing, Writing – original draft, Visualization, Supervision, Software, Resources, Project administration, Methodology, Investigation, Funding acquisition, Conceptualization. Rawaiz Khan: Writing – review & editing, Writing – original draft, Software, Methodology, Investigation, Formal analysis. Nils Haneklaus: Writing – review & editing, Writing – original draft, Validation, Methodology, Investigation, Formal analysis, Data curation.
Acknowledgements
The authors deeply appreciate Agency for Research and Innovation in the Ministry of Education for funding of this research through Institutional funding program for research and innovation, Deanship of Scientific research, King Saud University with grant no. IFKSUDR_E158.
Declaration of Competing Interest
The authors declare that they have no known competing financial interests or personal relationships that could have appeared to influence the work reported in this paper.
References
- Efficient and sustainable extraction of uranium from aquatic solution using biowaste-derived active carbon. Front. Chem.. 2023;11
- [Google Scholar]
- Uranium separation from phosphoric acid using metallic carbonaceous structures as efficient adsorbents: an experimental and kinetic study. Radiochemistry. 2020;62:204-215.
- [Google Scholar]
- Insights on uranium removal by ion exchange columns: the deactivation mechanisms, and an overlooked biological pathway. Chem. Eng. J.. 2022;434:134708
- [Google Scholar]
- Mitigation of uranium mining impacts—a review on groundwater remediation technologies. Geosciences. 2021;11(6):250.
- [Google Scholar]
- Chitin-psyllium based aerogel for the efficient removal of crystal violet from aqueous solutions. Int. J. Biol. Macromol.. 2021;179:366-376.
- [Google Scholar]
- Variation in the FTIR spectra of a biomass under impregnation, carbonization and oxidation conditions. J. Anal. Appl. Pyrol.. 2006;75(2):159-166.
- [Google Scholar]
- Biosorption of Uranium from aqueous solution by green microalga Chlorella sorokiniana. Environ. Sci. Pollut. Res.. 2022;29(38):58388-58404.
- [Google Scholar]
- Activated carbon from Luffa cylindrica doped chitosan for mitigation of lead (ii) from an aqueous solution. RSC Adv.. 2016;6(27):22639-22652.
- [Google Scholar]
- FT-IR study of rockrose and of char and activated carbon. J. Anal. Appl. Pyrol.. 1996;36(1):71-80.
- [Google Scholar]
- Ion-exchange kinetic studies for Cd (II), Co (II), Cu (II), and Pb (II) metal ions over a composite cation exchanger. Desalin. Water Treat.. 2015;54(10):2883-2890.
- [Google Scholar]
- Engineered Sorbents for Selective Uranium Sequestration from Seawater. ACS ES&T Water. 2024;4(2):325-345.
- [Google Scholar]
- Comparison of polyethersulfone and polyamide nanofiltration membranes for uranium removal from aqueous solution. Prog. Nucl. Energy. 2017;94:93-100.
- [Google Scholar]
- Adsorption properties and mechanism of uranium by three biomass materials. Radiochimica Acta. 2022;110(1):23-35.
- [Google Scholar]
- Adsorption of uranium (VI) from aqueous solution onto cross-linked chitosan. J. Hazard. Mater.. 2009;168(2):1053-1058.
- [Google Scholar]
- Adsorption of uranium (VI) from aqueous solution by modified rice stem. J. Chem.. 2019;2019
- [Google Scholar]
- Effective biosorption of uranium from aqueous solution by cyanobacterium Anabaena flos-aquae. Environ. Sci. Pollut. Res.. 2020;27:44306-44313.
- [Google Scholar]
- Adsorption of hexavalent chromium from aqueous solution by Leucaena leucocephala seed pod activated carbon: equilibrium, kinetic and thermodynamic studies. Arab J. Basic Appl. Sci.. 2019;26(1):89-102.
- [Google Scholar]
- Synthesis and application of sulfonated graphene oxide for the adsorption of uranium (VI) from aqueous solutions. J. Radioanalytical Nucl. Chem.. 2016;310:547-557.
- [Google Scholar]
Appendix A
Supplementary data
Supplementary data to this article can be found online at https://doi.org/10.1016/j.jksus.2024.103381.
Appendix A
Supplementary data
The following are the Supplementary data to this article:


