

Translate this page into:
Fabrication, spectral characterization, XRD and SEM studies on some organic acids doped polyaniline thin films on glass substrate
⁎Corresponding author. bhavesh_2j2@yahoo.com (N. Jeyakumaran) bhavesh2j2@gmail.com (N. Jeyakumaran)
-
Received: ,
Accepted: ,
This article was originally published by Elsevier and was migrated to Scientific Scholar after the change of Publisher.
Peer review under responsibility of King Saud University.
Abstract
Currently, in the field of modern opto-electrical fields, the conducting polymers are widely used in vast areas. Among these, polyaniline (PANI) is the most important conducting polymers because of its environmental stability, easy way to fabricate and its low cost-effectivity. In this work, synthesize of conducting polyaniline thin film was carried with oxalic, benzoic and salicylic acids by dip coating method on a glass substrate with various dipping time (3, 6, 12 and 24 h) in ammonium peroxydisulphate oxidant medium. The conductivity nature of different acids doped PANI thin film shows higher values at 24 h than other dipping times and oxalic acid doped PANI film at 24 h dipping time shows superior photoluminescence emission properties than other acids. Further, the XRD and SEM analyses reports show that the oxalic acid doped PANI thin film at 24 h dipping time show high crystalline nature with homogeneous surface morphology.
Abstract
Recently, the applications of conducting polymers are widely used in vast areas, due to their low cost, light weight, flexibility and the ability to deposit on various substrates. Among these, polyaniline (PANI) is the most important conducting polymers because of its environmental stability, easy way to fabricate and its cost-effectivity. In this paper, synthesis of conducting material namely, polyaniline thin film was carried out with different organic acids as dopents viz oxalic, benzoic and salicylic acids by dip coating method on a glass substrate with various dipping time (3, 6, 12 and 24 h) in the presence of ammonium peroxydisulphate (oxidant). The synthesized PANI thin films were structurally characterized by various physico–chemical and spectral methods (UV–visible spectra, Photoluminescence, XRD and SEM). Oxalic acid doped PANI thin film compounds show better transparency with low band gap value than other compounds and also the observed band gap energy values decrease with rise in dipping time. The superior photoluminescence emission wavelengths were observed in oxalic acid doped PANI thin film at 24 h that illustrates that the thin films have good photoluminescence as well as electroluminescence in nature. The conductivity nature of oxalic acid doped PANI thin film shows higher values at 24 h dipping time than other compounds. Further, the XRD and SEM analyses reports show that the oxalic acid doped PANI thin film compounds have high crystalline nature with homogeneous surface morphology.
Keywords
Conducting PANI thin film
Organic acid dopents
Glass substrate
Spectral characterization
Electrical properties
XRD studies

- APS
-
Ammonium peroxydisulphate
- eV
-
Electron Volt
- PANI
-
Polyaniline
- SEM
-
Scanning Electron Micrography
Abbreviations
1 Introduction
Now-a-days the conducting polymers play a vital role in many areas due to their unique properties such as light weight, easy to fabricate and low fabrication cost, eco-friendly, better environmental stability and flexibility (Saini et al., 2009). The backbone of conducting polymers have high delocalized π-electron systems with substituted single and double bond present in the polymeric chain, which generates oxidized (HOMO) and reduced (LUMO) forms. The formation of highly conjugated π-bond systems in the conducting polymers show a significant physico-chemical, electronic and optical properties in vast areas such as rechargeable light weight secondary batteries, electro-chromic devices, light emitting diodes, electro chemical actuators, redox capacitors, thin film sensors, indicators, electromagnetic shielding, field effect transistor (FET) fabrications, modern drug delivery systems, anti-noise devices, electroluminescent displays, bio-compatible wires, gas separation membranes, solar cells and diode fabrication (Marcel and Tarascon, 2001, Lu et al., 2007, Obaid et al., 2014). Among these conducting polymers, polyaniline (PANI) shows fascinating properties than other conducting polymers and it can be easily coated to any other substrate in the presence of acidic (pH < 7) medium because of its tunable and controllable electrical conductivity, easy to synthesis from any low cost or cheaper materials and high thermal and chemical stability under different environmental conditions (Akbarinezhad et al., 2012, Bhadra et al., 2006, Bhadra et al., 2009, Nesher et al., 2009, Ryu and Park, 2009). Moreover, it exhibits significant biological affinity in medicinal and clinical fields (Belmonte et al., 2003). It also exists in base as well as protonated salt forms like leucoemeraldine base (completely reduced), pernigraniline base (completely oxidized) and protonated emeraldine salt (half oxidized) forms. The conducting PANI polymer can be easily synthesized by chemical and electrochemical polymerization process (Oh and Kim, 2012, Niziol et al., 2011) in the presence of different dopents. In extension of our recent reports (Tarachiwin et al., 2002, Gemeay et al., 2005, Narayan et al., 2012, Ghani and Young, 2010, Vilela et al., 2007), the major goal of the present work is to synthesize the conducting PANI thin films with three different organic acids as dopent namely oxalic, benzoic and salicylic acids by dip coating method on glass substrate with various dipping periods (3, 6, 12 and 24 h) in the presence of ammonium peroxydisulphate (oxidant). The synthesised conducting PANI thin films were structurally characterized by various analysis and the results are also discussed in details.
2 Experimental and methods
2.1 Chemicals and analytical measurements
Aniline and the dopent like oxalic, benzoic acid and salicylic acids used in this work were extra pure analytical grade and purchased from Sigma Aldrich and Fluka (Puriss) products without further purification. Triply distilled CO2-free water with specific conductance equal to (1.80 ± 0.1 Λ−1 cm−1) was used for the preparation of all solutions in the entire work. The synthesized organic acids doped conducting PANI thin films were structurally characterized by various spectral as well as analytical techniques. The electronic (UV–visible) spectra were measured on a Schimadzu 1800 UV–VIS–NIR spectrophotometer (cell length, 1 cm) in the range of 200–1100 nm at 310 K in DMF solvent. The photoluminescence emission spectra were recorded on a Cary Eclipse instrument with fluorescence lamp as the light source at room temperature. The electrical conductivity analysis was measured on a Hioki 3522-50 LCR meter in 20 kHz to 1 MHz frequency range at room temperature. The powder X-ray diffraction (XRD) patterns were recorded with X’PERT PRO X-ray diffractometer (X-ray source: Cu, Wavelength 1.5406 A°, operated at 40 kV) and the scanning electron microscopy (SEM) was used for morphological evaluation on a VEGA 3 TESCAN microscopy.
2.2 Substrate cleaning process
For preparing the conducting PANI thin films, the transparent microscopic glass slides (2.5 × 2.5 × 2.5 cm2) were used as substrates. Initially, the glass substrates were washed with detergent and rinsed several times with tap water and finally rinsed with deionized CO2-free water. The glass plates were soaked with hot chromic acid at 60–90 °C for 15 min then washed with several times deionized CO2-free water and kept in ultrasonic water bath for 15 min. Finally, it was wiped with acetone solvent and dried at 100–110 °C for half an hour in muffle furnace.
2.3 Preparation of conducting PANI thin films
In the chemical oxidative polymerization route, 0.50 g of organic acids (salicylic, benzoic and oxalic acids in 50 ml water) were thoroughly mixed with 0.50 g of aniline (dissolved in 50 ml deionized water) and the resulting solutions were stirred continuously at room temperature for 30 min. Then 0.5 g of ammonium peroxydisulphate (APS: Oxidant in 10 ml H2O) solution was added to the above solution and the resulting solutions were stirred for another 10–20 min for complete mixing. During this process, the solution color was noted, initially a golden color was observed and then followed by a dark brown, after five min and finally the solution became as deep green which indicates the formation of PANI Emeraldine salt form solution (Scheme 1). The cleaned glass substrate was dipped with above prepared solutions with various dipping time (3, 6, 12 and 24 h) at room temperature and finally the prepared conducting PANI thin films were annealed at 100–110 °C for 1 h, dried in air and stored in vacuo over anhydrous CaCl2 at room temperature.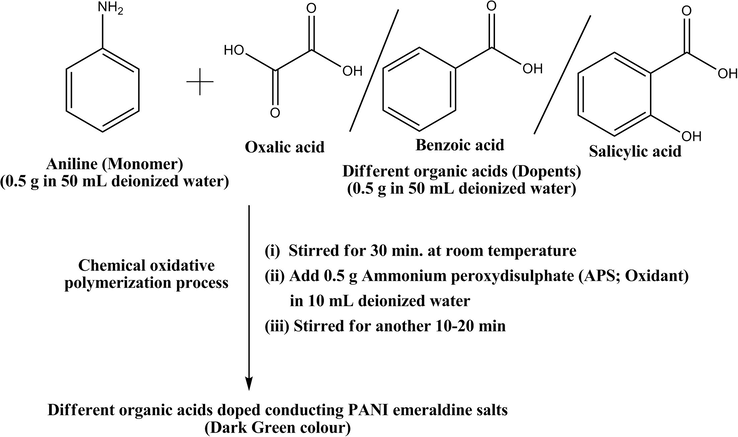
General procedure for synthesis of conducting PANI emeraldine salts.
3 Results and discussion
All the conducting PANI thin films have been found to be characteristic color with good yield, air and moisture free stable and non-hygroscopic in nature. The conductance of the title compounds was measured in DMF (∼ 10−3 mol) solution at room temperature and the observed moderate molar conductance (30–45 mho cm2 mol−1) values suggest that all the compounds behave as 1:1 electrolytic in nature (Geary, 1971).
3.1 Ultra violet – visible spectra
The determination of the optical properties for the synthesized conducting PANI thin films have been studied with the help of the electronic spectra of the compounds and were recorded in DMF medium at ambient temperature, in the range 200–1100 nm. Their respective UV–visible optical transmittance spectra for all the thin films with different dipping time are shown in Fig. 1. The spectra (Fig. 1) clearly indicates that the optical transmittance value increases with increasing dipping time and also the conducting PANI thin films with different organic acids dopent show remarkable transmittance values at 24 h when compared to other dipping periods. Moreover, oxalic acid doped PANI thin film has significant transparency in comparison to other thin film dopents.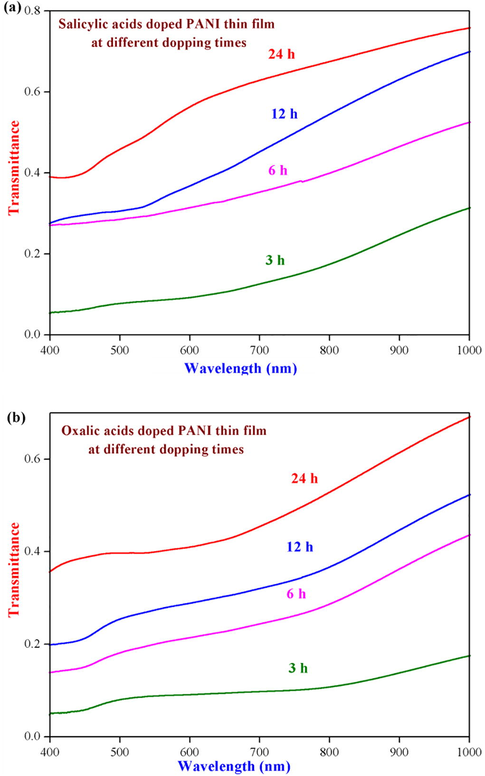
UV–visible optical transmittance spectra of (a) salicylic and (b) oxalic acids doped PANI thin films at different dipping times respectively.
From the Optical transmittance spectra, the energy band gap values of organic acids doped PANI thin films have been determined by using the Tauc’s relation as:
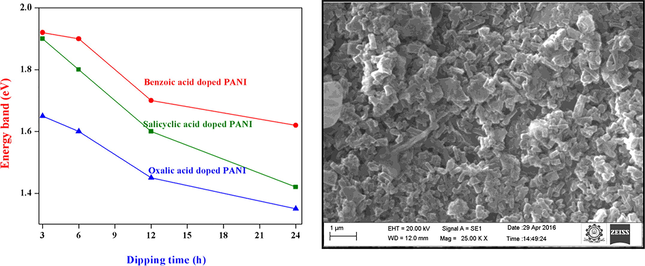
The energy band gap values were calculated by plotting the graph between (αhν)2 vs. hν and their diagram was depicted in the Fig. 2. Moreover, the direct energy gap values were found by extrapolating the straight-line portion of the curve to intercept of the energy axis. At different dipping period of time, the energy band gap values of different organic acids doped PANI thin films found in the range of 1.7–1.92 eV (for salicylic acid), 1.62–1.85 eV (for benzoic acid) and 1.45–1.65 eV (for oxalic acid) respectively. The observed energy band gap values clearly demonstrate that the band gap values decrease with increasing dipping time. Moreover, the oxalic acid doped PANI thin film shows low energy band gap value than other organic acids doped PANI thin films (Fig. 3) and this similar type of band gap values were also found in the literature (Abdulla and Abbo, 2012, Mamma et al., 2013, Sudha and Mitsumasa, 1978).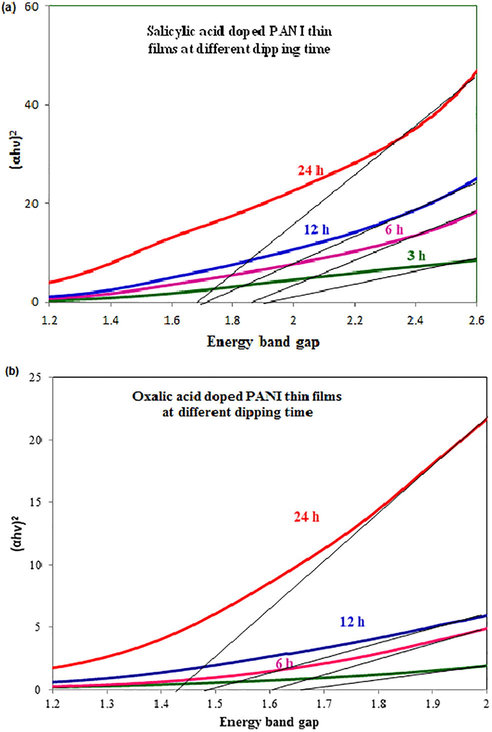
Optical energy band gap of (a) salicylic and (b) oxalic acids doped PANI thin films at different dipping times respectively.
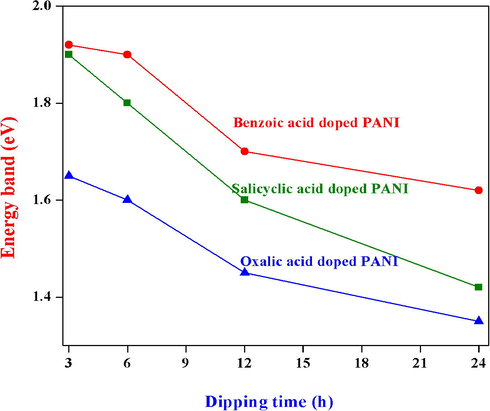
Energy band gap values of (a) salicylic, (b) benzoic and (c) oxalic acids doped PANI thin films at different dipping times (3, 6, 12 and 24 h) respectively.
3.2 Photoluminescence emission spectra
The photoluminescence emission spectra of the synthesized different organic acids like oxalic, salicylic and benzoic acids doped with PANI thin films were recorded on a Cary Eclipse instrument at room temperature and their respective spectra is illustrated in Fig. 4. The Fig. 4a indicates that the spectra of salicylic acid doped PANI thin film at different dipping time (3, 6, 12 and 24 h) show that four well resolved emission peaks were observed. At 24 h dipping time, the salicylic acid doped PANI thin film shows three emission peaks at 480, 503 and 548 nm. The peaks at 480 and 548 nm are shifted to higher wavelength from 483 and 554 nm which indicate the green and blue regions shift respectively (Singh et al., 2014) as well as decreasing the peak intensity with increasing the dipping times. This kind of decrease in the intensity of emission peaks are due to the interchain species of emission process of PANI polymers and also the organic acid dopent forming aggregation in the polymer chain. Similarly, the benzoic acid doped PANI thin films show three peaks at 483, 527 and 572 nm respectively. The first and second peaks (483 and 527 nm) were shifted to higher wavelength (487 and 529 nm) with increase in the dipping time (3, 6 and 12 h), indicate that the peaks intensity values decreases with increase in the dipping time. Moreover, the oxalic acid doped PANI thin film at 24 h dipping time displays three highest emission peaks at 483, 507 and 528 nm respectively. The first and second peaks decreased with increasing in the wavelength values and also the intensity values decreases with different dipping time (3, 6 and 12 h). Furthermore, the oxalic acid doped PANI thin films show the highest peak intensity values than the other doped acids (Fig. 4b). From Fig. 4b, we have come to know that at 24 h dipping time of different organic acids doped PANI thin film shows highest peak intensity than other dipping times and also the height of intensity peak values are reduced with increasing the wavelength of the emission peaks due to the addition of organic acid dopents.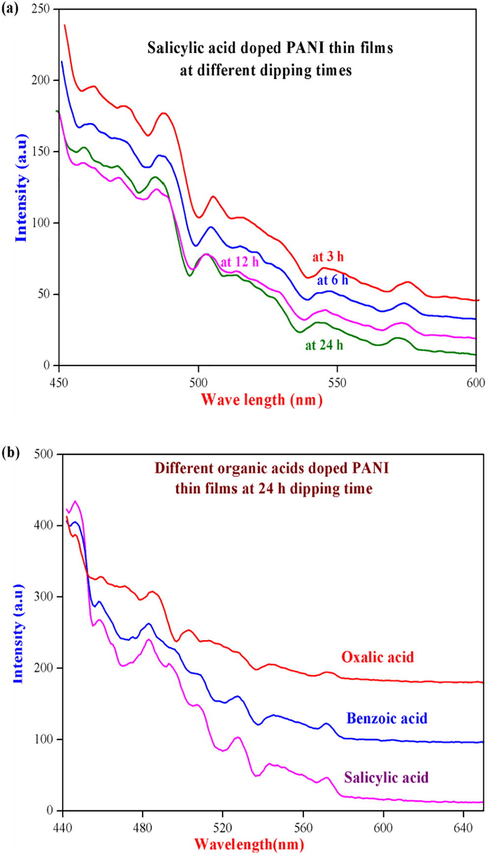
Photoluminescence emission spectra of (a) salicylic acid doped PANI thin film at different dipping times and (b) different organic acids doped PANI thin films at 24 h dipping time respectively.
3.3 XRD analysis
The X-ray diffraction method was used to measure the sample purity and also to determine the synthesized PANI thin films particle size, present in the phase materials (Estermann and David, 2002, Klug and Alexander, 1974, Goldstein et al., 2003, Wu et al., 2005). The X-ray diffractograms of oxalic, salicylic and benzoic acids doped conducting PANI thin films at various dipping times (3, 6, 12 and 24 h) were recorded in 0–80° (2θ) range and their respective X-ray diffraction patterns are shown in Fig. 5. From Fig. 5, a number of well resolved sharp peaks with maximum intensity and some feeble peaks with low intensity were observed and these peaks suggest that the synthesized organic acids doped PANI thin films have significant microcrystalline nature with uniform phase respectively (Estermann and David, 2002, Klug and Alexander, 1974, Goldstein et al., 2003, Wu et al., 2005). All the doped PANI thin films at different dipping times (except 24 h), show a number of weak peaks with reasonable intensity and indicates that the formed PANI thin films (dipping time at 3, 6 and 12 h) are amorphous or semi-micro crystalline nature. But at 24 h dipping time show well defined sharp peaks (2 θ) with high intensity were observed at 17.1°, 24.6°, 34.2°, 48.3° and 52.4° for salicylic acid, 18.6°, 35.2° and 53.6° for benzoic acid and 11.9°,16.7°, 23.9°, 33.6°, 36.2°, 47.9° and 52.1° for oxalic acid respectively which shows the regular monomeric unit of aniline present in the films with closely packed phenyl ring moieties in planar conformation (Chaudhari and Kelkar, 1997, Singh et al., 2014).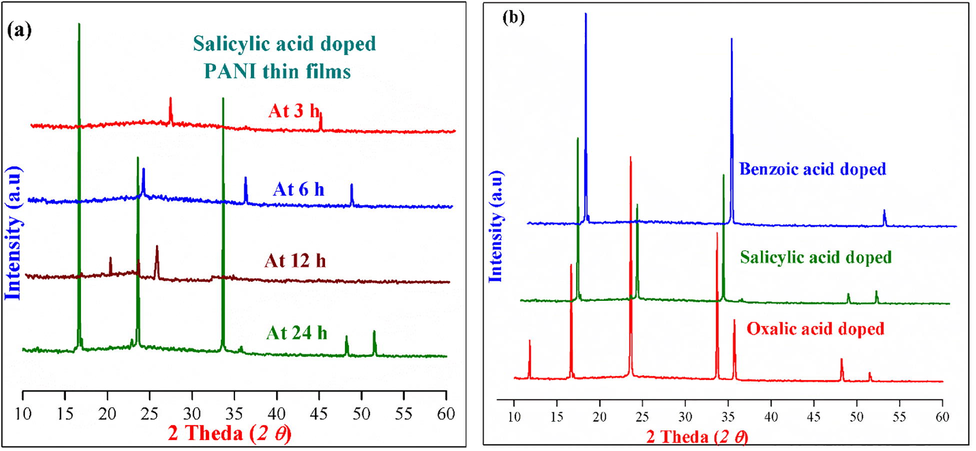
Powder XRD pattern of (a) Salicylic acid doped PANI thin films at 3, 6, 12 and 24 h dipping times and b) different organic acids doped PANI thin films at 24 h dipping time respectively.
In order to calculate the crystalline size (D) from the observed values of Bragg diffraction angle (θ) and FWHM (full width half maximum;
) by the Debye–Scherer’s equation
and also observed the crystalline size (D) values from Williamson Hall
method. The calculated crystalline size (D) values from Debye–Scherer’s and Williamson Hall equations of different organic acids doped PANI thin films at 24 h dipping time is shown in Table 1. The calculated crystallite size of oxalic, benzoic and salicylic acids is found to be in the range of 12–74 nm respectively. Furthermore, the calculated crystalline size (D) values from Williamson Hall method are somewhat lower than Debye–Scherer’s method. The dislocation density
values and micro strain values were calculated by identifying the defects or imperfections presented in the organic acid doped PANI thin film compounds. The thickness and the calculated dislocation density values are summarized in Table 1 at different dipping times. From Table 1, the thickness and particle size value increases with increase in the dipping time and decreasing dislocation density and micro strain values, these all indicate that the lower degree of dislocation density and micro strain causes high degree of crystalline nature present in the PANI thin films.
Compound
2 θ
Thickness (μm)
Grain size (nm)
Grain size (nm)
Dislocation density (1/D2) × 1015 m/m3
Micro strain
Williamson Hall Method
Debye–Scherrer’s Method
Salicylic acid doped PANI thin film
17.1
0.62
22
23
35.8
0.6453
24.6
0.74
34
35
22.02
0.4078
34.2
0.86
42
44
6.34
0.1487
48.3
0.98
51
53
4.63
0.1323
52.4
1.06
64
66
3.27
0.1139
Benzoic acid doped PANI thin film
18.6
0.79
24
26
32.3
0.4325
35.2
0.92
47
48
4.23
0.1329
53.6
1.13
72
74
2.19
0.1118
Oxalic acid doped PANI thin film
11.9
0.48
12
13
51.1
1.1254
16.7
0.76
21
22
36.3
0.8635
23.9
0.98
32
33
20.1
0.6321
33.6
1.03
41
42
7.53
0.1624
36.2
1.12
49
51
5.99
0.1287
47.9
1.34
53
54
4.98
0.1196
52.1
1.29
74
75
2.76
0.1127
3.4 Scanning electron microscope (SEM) analysis
Morphology and the particle size of the synthesised different organic acids doped PANI thin films with various dipping time (3, 6, 12 and 24 h with annealed at 100–110 °C) have been investigated from scanning electron micrograph (SEM) analysis from 10.00 to 25.00 Kx magnification separation of the images along with the accelerating voltage of 20 kV and its respective SEM photographs have been depicted in Fig. 6. From the SEM analysis, all the synthesized thin films show uniform matrix with homogeneous phase separation (Wu et al., 2005) with different morphology at different dipping time. A regularly diffused massive layer by layer spider shells-like shape morphology (Fig. 6a) with particle size 12 μm, an irregularly busted small sturdy piece of ice-rock resembling structure (Fig. 6b) with particle size 15 μm, the collection of coral reef-like surface morphology (Fig. 6c) with particle size 20 μm and an irregularly broken massive fissure resembling with tiny mist like structure morphology (Fig. 6d) in deep water with particle size 26 μm is observed in oxalic acid doped PANI thin film at 3, 6, 12 and 24 h dipping time respectively which indicates that the observed SEM morphology of oxalic acid doped PANI thin film at different dipping time illustrate entirely different surface structures and also the particle size was increased with increase in dipping time. Similarly, the salicylic and benzoic acids doped PANI thin films show the same results at different dipping time. At 24 h dipping time, the particle size of salicylic acid doped PANI thin film (Fig. 6e) is found to be 35 μm with colossal dense crumb like structure of irregularly broken ice-rock like surface morphology. Moreover, the benzoic acid doped PANI at 24 h shows the collection of layer by layer twisted fiber morphologies having small tiny particles of the particle size 30 μm is illustrated in Fig. 6f.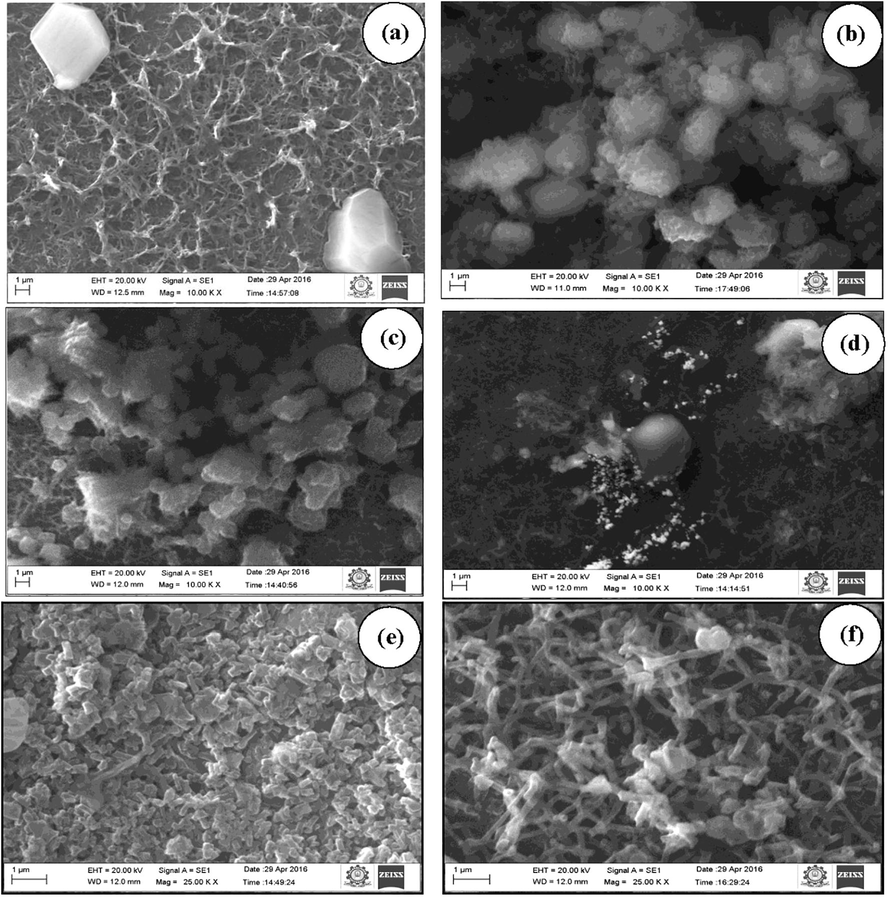
SEM photograph of (a–d) oxalic acid doped PANI thin film at 3, 6, 12 and 24 h dipping times, (e) salicylic acid doped PANI thin film at 24 h and (f) benzoic acid doped PANI thin film at 24 h respectively.
3.5 Conductivity study
The variations of alternating current (AC) conductivity (σ) nature of conducting PANI thin films doped with different organic acids at different dipping time (3, 6, 12 and 24 h) have been studied from 20 kHz to 1 MHz and their graphical representation was shown in Fig. 7. From Fig. 7, the conductivity values increase with increasing the dipping time. Among these, the dipping time at 24 h shows the better conductivity nature than other dipping time. The increase in the conductivity
values may cause due to the charge transport property between the organic acids dopant and the polymer chain backbone (Harun et al., 2008). The nature of conductivity property of thin films mainly depends on the oxidation state of PANI and the organic acids dopant present in it. The Fig. 7 clearly indicates that the oxalic acid doped PANI thin film shows superior conductivity nature than other compounds.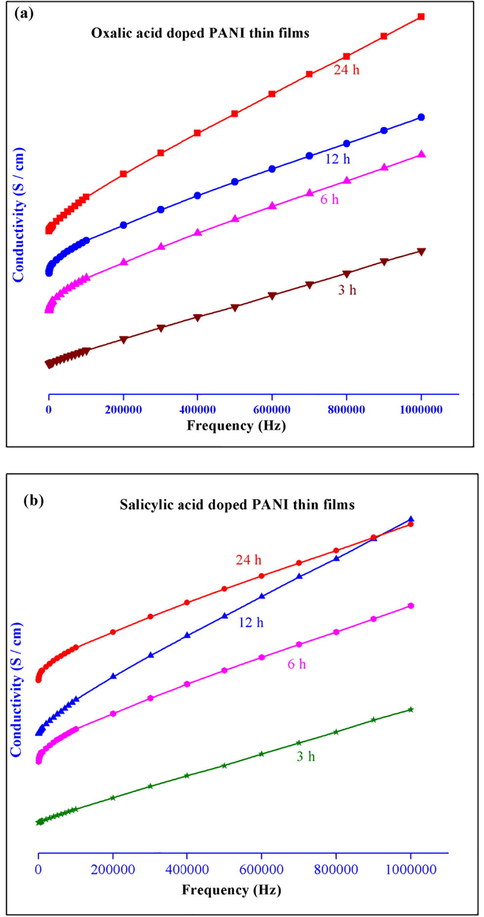
Electrical conductivity of (a) oxalic acid and (b) salicylic acid doped conducting PANI thin films at different dipping times respectively.
4 Conclusions
In the present work, we have synthesized a series of three different organic acids like oxalic, salicylic and benzoic acids doped PANI thin films at different dipping time (3, 6, 12 and 24 h) using dip coating method in the presence of ammonium peroxy disulphide (oxidant). The observed optical transmittance value increases with increase in dipping time and decreasing energy band gap values indicate that the PANI thin film doped oxalic acid (at 24 h dipping time) shows high transmittance and lower band gap value than other PANI thin films. The superior photoluminescence emission wavelengths were observed in oxalic acid doped PANI thin film at 24 h dipping time which illustrates that these thin films have good photoluminescence as well as electroluminescence in nature. From the XRD studies, all the synthesised PANI thin films show sharp intense peak with microcrystalline nature and also increasing grain size with decreasing dislocation density values. The SEM studies indicate that all the thin film compounds have uniform surface morphology with different particle size at different dipping time. Moreover, the superior conductivity nature was observed in the oxalic acid doped PANI thin film at 24 h dipping time than other compounds. From these spectral studies, we conclude that the synthesized oxalic acid doped PANI thin film can act as a major part for the manufacture of opto-electronic devices.
Acknowledgement
We express our sincere thanks to the College Managing Board and Principal of VHNSN College (Autonomous), Virudhunagar and Sree Sowdambika College of Engineering, Aruppukottai for providing research facilities, moral support and constant encouragement throughout this investigation. All the authors express their gratitude to Kalasalingam University, Krishnankovil and Tamil Nadu for providing the analytical facilities.
References
- Optical and electrical properties of thin films of polyaniline and polypyrrole. Int. J. Electrochem. Sci.. 2012;7:10666-10678.
- [Google Scholar]
- Preparation of polyaniline and self–doped polyaniline–clay nanocomposites in supercritical CO2: synthesis and conductivity study. Synth. Met.. 2012;162:1879-1886.
- [Google Scholar]
- Tailoring biomaterial compatibility: in vivo tissue response versus in vitro cell behavior. Int. J. Artif. Organs.. 2003;26:1077-1085.
- [Google Scholar]
- Polyaniline by new miniemulsion polymerization and the effect of reducing agent on conductivity. Synth. Met.. 2006;156:1148-1154.
- [Google Scholar]
- Progress in preparation, processing and applications of polyaniline. Prog. Polym. Sci.. 2009;34:783-810.
- [Google Scholar]
- Investigation of structure and electrical conductivity in doped polyaniline. Polym. Int.. 1997;42:380-384.
- [Google Scholar]
- Structure determination from powder diffraction data (SDPD). New York: Oxford Science Publications; 2002.
- The use of conductivity measurements in organic solvents for the characterisation of coordination compounds. Coord. Chem. Rev.. 1971;7:81-122.
- [Google Scholar]
- Preparation and characterization of polyaniline/manganese dioxide composites via oxidative polymerization: effect of acids. Eur. Polym. J.. 2005;41:2575-2583.
- [Google Scholar]
- Conductive polymer based on polyaniline–eggshell powder (PANI–ESP) composites. J. Phys. Sci.. 2010;21:81-97.
- [Google Scholar]
- Scanning Electron Microscopy and X-Ray Microanalysis. New York: Kluwer Academic, Plenum Publishers; 2003.
- Temperature dependence of ac electrical conductivity of PVA-PPy-FeCl3 composite polymer films. Malaysian Polym. J.. 2008;3(2):24-31.
- [Google Scholar]
- X-ray Diffraction Procedures for Polycrystalline and Amorphous Materials. New York: Wiley; 1974.
- High dielectric constant polyaniline/epoxy composites via in situ polymerization for embedded capacitor applications. Polymer. 2007;48:1510-1516.
- [Google Scholar]
- Effect on Poly(C6H5NH2) emeraldine salt by FeCl3 and KMnO4 as secondary dopants. Am. J. Polym. Sci. Eng.. 2013;1:1-13.
- [Google Scholar]
- An all–plastic WO3·H2O/polyaniline electrochromic device. Solid State Ionics. 2001;143:89-101.
- [Google Scholar]
- Synthesis, characterization and ac–conductivity measurements of polyaniline based composites with fly-ash and clinker. J. Mater. Environ. Sci.. 2012;3:137-148.
- [Google Scholar]
- Polyaniline entrapped in silver: structural properties and electrical conductivity. Adv. Funct. Mater.. 2009;19:1293-1298.
- [Google Scholar]
- Electrodeposition and characterization of polyaniline on stainless steel surface via cyclic, convolutive voltammetry and SEM in aqueous acidic solutions. Int. J. Electrochem. Sci.. 2014;9:1003-1015.
- [Google Scholar]
- Synthesis and electrochemical analysis of polyaniline/TiO2 composites prepared with various molar ratios between aniline monomer and para–toluenesulfonic acid. Electrochim. Acta. 2012;78:279-285.
- [Google Scholar]
- Synthesis of diphenylalanine/polyaniline core/shell conducting nanowires by peptide self-assembly. Angew. Chem. Int. Ed. Engl.. 2009;48:4820-4823.
- [Google Scholar]
- Polyaniline-MWCNT nanocomposites for microwave absorption and EMI shielding. Mater. Chem. Phys.. 2009;113:919-926.
- [Google Scholar]
- Structural and optical studies of CuO doped polyaniline. Int. J. Manage. Inform. Technol. Eng.. 2014;2:85-92.
- [Google Scholar]
- Sudha, K., Mitsumasa, D.I., 1978. Cullity BD, Elements of X-ray Diffraction. In: M. Cohen., (Ed.), second ed., Addison–Wesley Publishing Company Inc, Philippines.
- Electrical conductivity response of polyaniline films to ethanol–water mixtures. Synth. Met.. 2002;129:303-308.
- [Google Scholar]
- Polyaniline and mineral clay-based conductive composites. Mater. Res.. 2007;10:297-300.
- [Google Scholar]
- Preparation and characterization of polyaniline/multi–walled carbon nanotube composites. Carbon. 2005;43:734-740.
- [Google Scholar]


