

Translate this page into:
Examination of the relationship between rate of penetration and mud weight based on unconfined compressive strength of the rock
⁎Corresponding author. ata2q3@mst.edu (Husam H. Alkinani),
-
Received: ,
Accepted: ,
This article was originally published by Elsevier and was migrated to Scientific Scholar after the change of Publisher.
Peer review under responsibility of King Saud University.
Abstract
The rate of penetration (ROP) plays a major role in drilling optimization, which makes it an important area of investigation. In this work, sensitivity and statistical analysis were carried out using a big set of data gathered from over 800 wells in the Basra oil fields, Iraq. The main objective of this investigation is to assess the effect of mud weight (MW) on ROP and to provide a method for estimating the recommended range for operational mud weight based on the rock hardness.
The collected data for the drilling intervals from the drilling reports for over 800 wells in the Basra oil fields, Iraq, were categorized as weak, medium, hard, and very hard, based on the unconfined compressive strength (UCS), depth, and lithology. Statistical and sensitivity analyses were conducted and correlation coefficients (CC) were developed to describe relationships between rock hardness, ROP, and MW from field data. This methodology combines data from mud logging, daily drilling reports, and geological information to investigate the relationship between ROP and MW for different rock types and strengths.
Several previous studies focused directly on MW, where the effect of MW on bit conditions, and thus the ROP was clearly demonstrated. However, these studies did not take into consideration the rock hardness or lithology. There is also a strong discrepancy between results from different studies, where some studies showed an inverse relationship between MW and ROP, while other studies showed it was a direct relationship.
In this study, field data have been gathered (more than 800 wells) to further investigate the relationship between MW and ROP, and how it varies with rock hardness. The results showed that MW has an inverse relationship with ROP for the weak formation with a CC of −0.57, suggesting that the MW should be maintained as minimum as possible when drilling through the weak formation. On the other hand, MW showed a direct relationship with ROP for medium, hard, and very hard formations with CC of 0.31, 0.4, and 0.42 respectively. Hence, MW has to be maintained as high as possible to maximize ROP for medium, hard, and very hard formations.
Large-scale collection and interpretation of field data were collected to demonstrate the effects of MW on ROP with varying rock hardness and lithology. While field data of this scale is inherent of interest, this analysis also investigates relationships previously unexplored and extends understanding of how MW effects ROP.
Keywords
Mud weight
Rate of penetration
UCS
Basra oil fields
Iraq

1 Background
MW is defined as the density of drilling mud (mass divided by volume), expressed in pounds per gallon (ppg or Ib/gal), pounds per cubic feet (lb/ft3), kilograms per cubic meter (kg/m3), or grams per cubic centimeter has been identified as one of the factors that impact ROP in this work. While the drilling mud is essential for all its numerous functions; however, it plays a very important role in the ROP in rotary drilling. It has been known that MW affects ROP, this fact was established early in the drilling literature and confirmed by numerous laboratory studies. However, there is also a strong discrepancy between results from different studies. It is true that MW controls hydrostatic pressure (HP) in the wellbore and prevents unwanted fluid flow into the well, it is also true that MW prevents the collapse of the casing and the open hole, but from this study, it was deduced that ROP is significantly influenced by MW. Thus, the selection of MW is a challenging phase of drilling operations. Field data of over 800 wells are minutely collected and analyzed to identify the characteristics of the drilling fluid that enhance the ROP and to investigate the relationship between MW and ROP based on the hardness of the rock.
The concept of rate of penetration (ROP) can be defined as “the volume of rock removed per unit area (feet) per unit time (hour). It can be also referred to as the speed of breaking the rock under the bit. In general, it measures the speed or the progress of the bit when it drills the formation (Bourgoyne et al., 1986)”. Faster ROP values are always considered a good sign since they result in faster delivery of the well and thus saving time and money. However, too fast ROP may result in hole problems and poor hole cleaning that can extend the duration of well delivery and introduce much more complications such as losing part of the BHA in the hole due to formation instability and collapse (Akgun, 2002). The focus of this work is on MW, which is a critical property of the drilling fluid. Real data obtained from more than 800 wells, and they were analyzed to ascertain the effects of MW on ROP based on the unconfined compressive strength of the rock (UCS).
Many factors, which are related to each other, can affect ROP. These factors are divided into five categories including; rig efficiency, formation characteristics, mechanical factors, hydraulic factors and mud properties (Hossain and Al-Majed, 2015). These categories can be classified into two general classifications; controllable factors and uncontrollable factors. Controllable factors are those that can be altered quickly to adjust ROP without impacting the operations economics significantly such as weight on bit (WOB), bit design, string revolutions per minute (RPM) and hydraulics. Uncontrollable or environmental factors are very hard to change due to economical or geological reasons such as mud weight and type, bit size, overbalance pressure and depth. When it comes to fluid properties and their impact on ROP, it is impossible to change one property without affecting the others, which makes it difficult to evaluate the actual effect of an individual parameter on the rate of penetration (Osgouei, 2007).
There are several published models to predict the rate of penetration; however, most of them focus on drilling parameters such as string revolutions per minute, weight on bit, pumping rate. Only a few of these models focused on the effect of MW and their influence on ROP values using few data. The objective of this paper is to develop a new approach to comprehend the exact physical relationship between MW and ROP based on the hardness of the rock, depth, lithology, and a field data. Actual field measurements of more than 800 data wells of different fields and formations were used to investigate this relationship.
There are many methods established to understand the effect of drilling parameters and mud properties on the rate of penetration. Basic physics and mathematical equations can be used to derive a relationship between them, or the use of the currently established correlations and linking them together to derive such a relation. On the other hand, real data can be used to validate those relationships and their magnitude. To date, no solid or reliable model exists due to the complexity of the drilling process, and it is easy to capture every factor to predict the rate of penetration. There is no single model that captures both drilling parameters and mud properties effect on ROP (Ricardo et al., 2007).
Akpabio et al. (2015) showed real field data for water and oil-based muds used to drill some wells, which were in sandstone/shale formations and ROP was plotted against the mud weight. For the water-based mud, the MWs were 10.5, 11.5 and 8.9 ppg produced average ROPs of 25 and 24 and 37 ft/hr respectively. Similarly, ROPs of 28, 35 and 50 ft/hr were obtained by the oil-based MWs of 11.3, 11.1 and 8.6 ppg respectively. It can be deduced that ROP was reduced by the increase in the MW. Hence, to drill effectively and efficiently, the right MW should be formulated. A substantial amount of time and drilling cost can be saved in drilling cost analysis when drilling conditions are suitable to facilitate fast ROPs and good hydrostatic pressures.
The drilling operational parameters are optimized to increase the ROP and reduce both; the drilling time and the associated problems. The drilling improvements are not only accomplished by enhancing the drilling conditions but also through choosing proper drilling tools for an individual formation (Hareland et al., 2007). ROP can be influenced by altering MW to some extent are incremented. As known previously, the drilling fluid gets denser, the chip holds down effect is intensified, and consequently, the ROP is lowered. The rock aggressiveness to penetration is elevated if the rock strength or the bit wear increase (defined as the damage in the bit components), which lead to a reduction in ROP (Hareland and Nygaard, 2007). Different techniques have been developed in the oil industry to understand the relationship between ROP and MW (Rashidi et al., 2008). However, there are no coherent conclusions that can be clarified this relationship precisely.
On the other hand, Mitchell (2001) mentioned that MW influences hole cleaning in three ways:
-
It provides buoyancy to help lift the cutting.
-
It affects the momentum of the fluid.
-
It affects the friction the fluid can impact cutting as it passes by
Mitchell (2001) also showed that a slight increase in MW has a significant effect on the cuttings slip velocity, and thus improves the transport ratio, and nothing reduces the slip velocity of a cutting more than an increase in MW as shown in the equation below:
The conclusion that has been made by Mitchell (2001) is nothing contributes more to hole cleaning efficiency in a well than an increase in MW. The transport ratio increases and the cuttings concentration drastically reduces as MW increases. Therefore, the ROP will be maximized due to an efficient hole cleaning. In other words, high MW indirectly impacts ROP. However, that generally does not adjust MW to improve hole cleaning since the drilling density is generally designed to be kept as low as possible for economic reasons. Thus, it is more practical to adjust annular velocity or rheological properties instead.
Eckel (1954) highlighted that field observations showed ROP increase when a well is drilled with mud compared to water using the same drilling parameters. Eckel (1954) conducted a laboratory test and concluded that MW might play a big role in this ROP variation. In addition, it was noticed that a significant amount of ROP increase occurs if heavy mud is used, and that was confirmed with the use of air drilling where ROP was lower. It was reported that ROP was higher in the case of using oil-emulsion mud compared to conventional mud due to the lubrication effect.
Paiaman et al. (2009) investigated the effects of various drilling fluid properties on the rate of penetration using field data of 17–1/2″ hole then utilized Bourgoyne and Young’s ROP model to calculate and normalize ROP values. It was confirmed that ROP maximized with increasing MW and stated that mud property affects ROP was not as bad as it was thought, and it was linked strongly with change in formation’s depth because of compaction and increase in rock compressive strength.
Alum and Egbon (2011) developed a semi-analytical model that relate fluid properties to the rate of penetration. Using Bourgoyne and Young’s ROP model and real data, mathematical equations were generated that relate ROP with mud properties such as plastic viscosity for both laminar and turbulent flows and gel strength. The results showed that plastic viscosity and gel strength had a minor effect on ROP; however, MW has a significant impact on ROP. The only parameter showed a strong relationship with ROP was MW, thus any reduction in MW will cause a decreasing to the ROP.
It is clear from the literature that most of MW and ROP relationship was built based on theoretical equations, and only a few studies were built using real-data or semi-analytical models to capture the effect of MW on ROP. In this study, actual data measurements were used to study the effect of MW on ROP by combining unconfined compressive strength (UCS) and further based on depth and lithology.
The aim of this paper is to identify the effect of MW on ROP based on the hardness of the rock in order to provide a better understanding regarding the relationship between MW and ROP. In addition, this study seeks to investigate what could improve ROP, and also take a linear approach to determine the economic effects of this variable on the drilling operation.
2 Approach
Data of more than 800 wells drilled in the Basra oil fields, Iraq were gathered from many sources. The data were taken from different formations, thus formations were categorized as weak, medium, hard, and very hard based on the UCS of the formations as shown in Table 1. After finishing the data collection, the next step was data preparation. In the data preparation stage, the data were examined for any outliers. Boxplots are utilized to test for outliers in the data, the elements of the boxplot are shown in Fig. 1 (Hazra and Gogtay, 2016). Any data point falls outside the minimum or the maximum values is considered an outlier (Norman and Streiner, 2014). The last step of data preparation is to see whether the data have a normal distribution or not. The decision of which method of analyzing the data is based on the normality of the data. There are different methods used to analyze the relationship between data, the most common method used for normally distributed data is called the Pearson product-moment correlation coefficient. Other methods such as Spearman, Kendall, or Hoeffding correlations are used for non-normally distributed data (or non-parametric data); these methods utilize the rank of the data, not the data itself (Hollander et al., 2014). It is recommended to try to convert the data to a normal distribution (there are different methods to transfer the data depending on the skewness of the data) even when dealing with non-normally distributed data. If the data cannot be transferred to a normal distribution, the non-parametric statistical tools should be used (e.g. Spearman, Kendall, or Hoeffding correlations) (Box and Cox, 1964, JMP: Release 7, 2007).
Hardness
UCS (Psi)
Weak
8000–7000
Medium
8000–18000
Hard
19000–29000
Very Hard
greater than 80,000
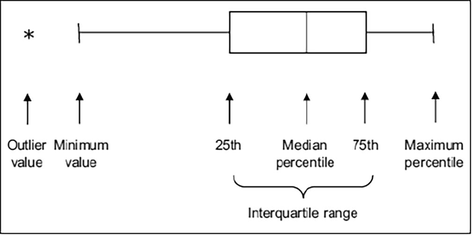
Elements of Boxplot (Hazra and Gogtay, 2016).
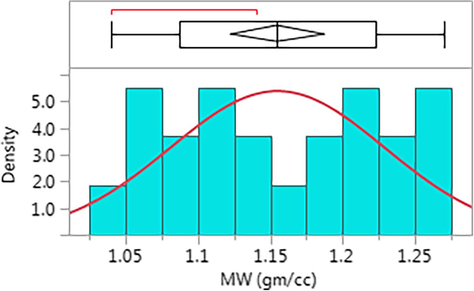
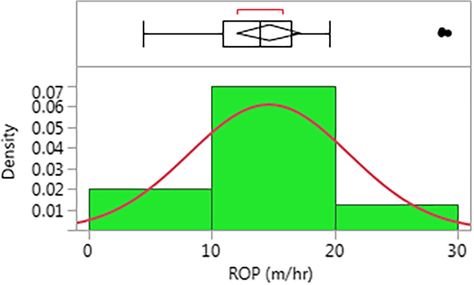
Figs. 2–5 show boxplots and histograms of MW for weak, medium, hard, and very hard data respectively. Figs. 6–9 show boxplots and histograms of MW for weak, medium, hard, and very hard data respectively. Data points falling outside the boxplot limits were removed. All histograms show that the data have a decent normal distribution (given that the data are real field data and it is hard to have a perfect normally distributed data in real field data). Thus, the Pearson product-moment correlation coefficient is utilized to analyze the data.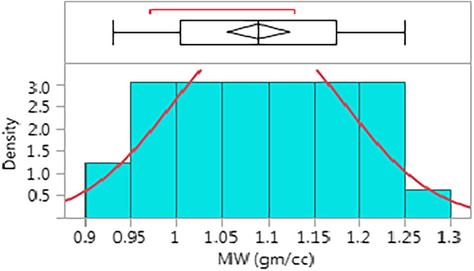
Histogram and Boxplot of MW for Weak Formations.
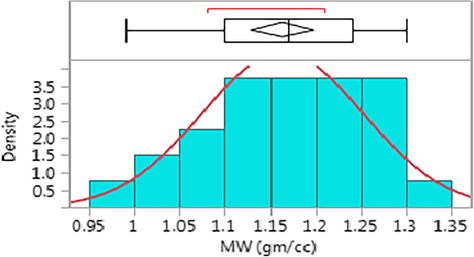
Histogram and Boxplot of MW for Medium Formations.
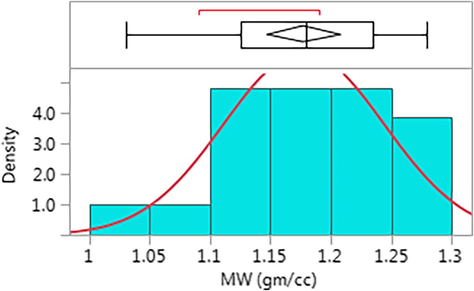
Histogram and Boxplot of MW for Hard Formations.
Histogram and Boxplot of MW for Very Hard Formations.
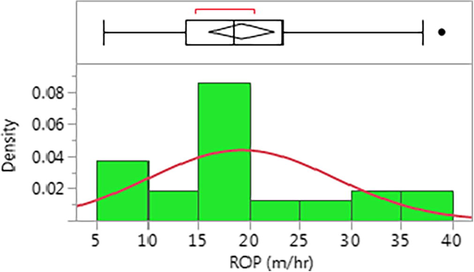
Histogram and Boxplot of ROP for Weak Formations.
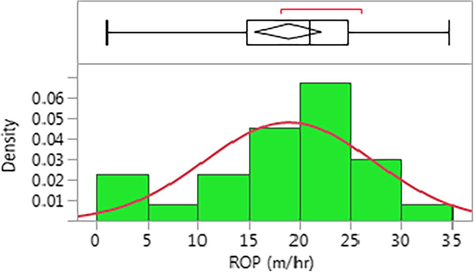
Histogram and Boxplot of ROP for Medium Formations.
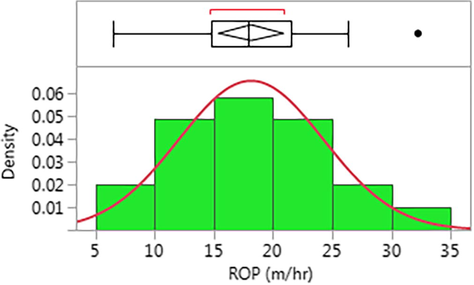
Histogram and Boxplot of ROP for Hard Formations.
Histogram and Boxplot of ROP for Very Hard Formations.
The Pearson product-moment correlation coefficient (also known as the correlation coefficient (CC)) is utilized to assess the relationship between MW and ROP based on the UCS of the formations in order to optimize the drilling operation. The CC is the simplest method used to measure the strength of the linear relationship between two variables. The values of CC ranges from + 1 (the strongest positive relationship) to -1 (the strongest negative relationship). A value of zero indicates that there is no relationship between the variables. A negative value indicates that the relationship is negative; in other words, as one variable increases, the other variable decreases and vice versa. However, a positive value indicates a positive relationship between the variables; in other words, as one variable increases, the other variable increases as well (Mukaka, 2012).
Sample CC can be calculated using the following equation (Swinscow, 1997):
3 Results and Discussion
Fig. 10 shows a plot of ROP against MW for the weak formations. The CC for the weak formations is calculated to be −0.57. This suggests that the MW and ROP have an inverse relationship in the weak formations. Thus, MW has to be maintained as minimum as possible when drilling weak formations in order to maximize ROP.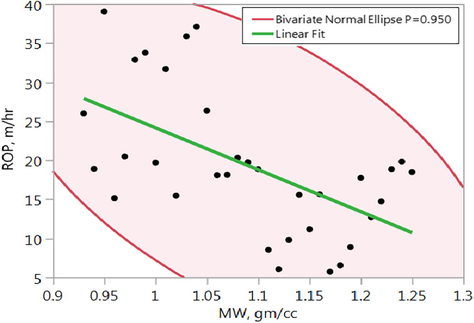
ROP vs MW for the Weak Formations.
Figs. 11–13 show plots of ROP against MW for medium, hard, and very hard formations respectively. MW has a direct relationship with ROP for medium, hard, and very hard formations with CC of 0.31, 0.4, and 0.42 respectively. Hence, MW has to be maintained as high as possible to maximize ROP for medium, hard, and very hard formations. However, it is important to mention that the relationship between ROP and MW is not very significant in the medium formation (CC of 0.31 is considered relatively low).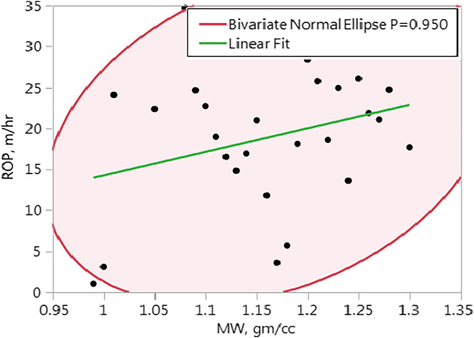
ROP vs MW for the Medium Formations.
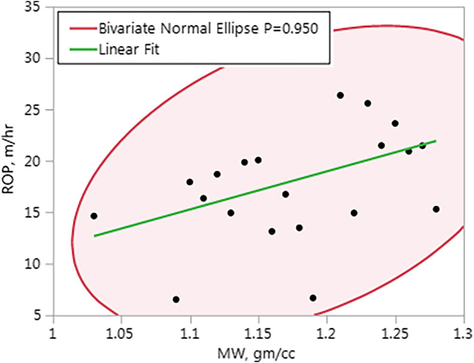
ROP vs MW for the Hard Formations.
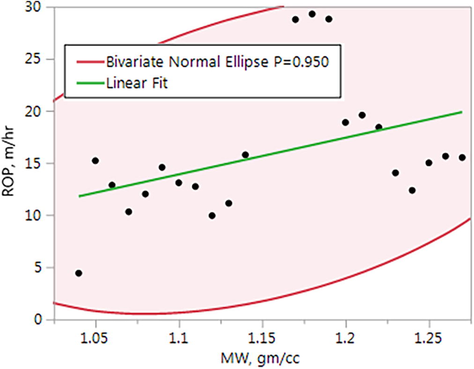
ROP vs MW for the Very Hard Formations.
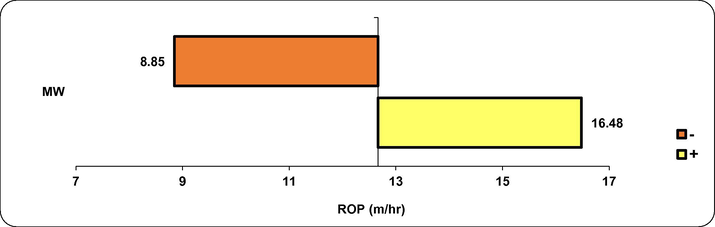
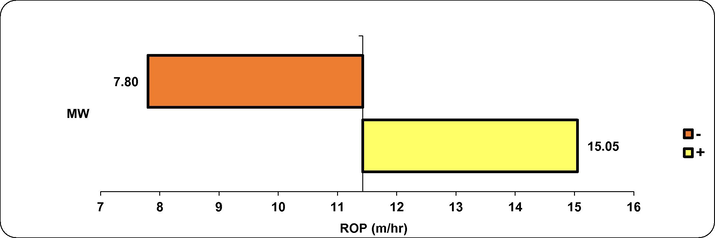
Figs. 14–17 show sensitivity analysis tornado chart with 10% sensitivity and MW of 1.03 gm/cc for weak, medium, hard, and very hard formations respectively. It is clear that for the weak formation, as the MW increases, the ROP will be decreased (as shown in Fig. 14). For medium, hard, and very hard formations, the MW has a direct relationship with the ROP, this relationship gets stronger as moving from medium to hard then to very hard which presents the strongest relationship.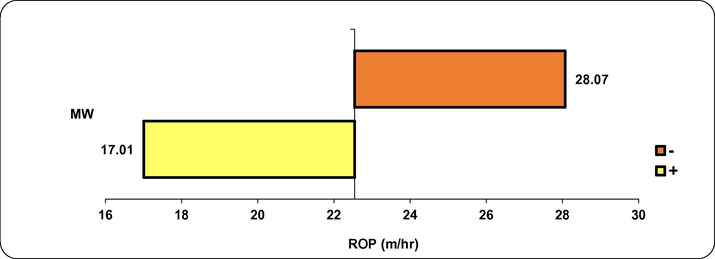
Sensitivity Analysis Tornado Chart for the Weak Formations.
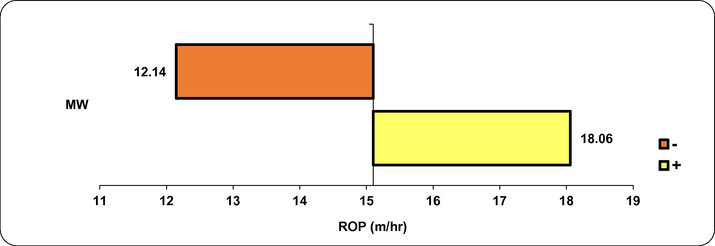
Sensitivity Analysis Tornado Chart for the Medium Formations.
Sensitivity Analysis Tornado Chart for the Hard Formations.
Sensitivity Analysis Tornado Chart for the Very Hard Formations.
4 Conclusion
A comprehensive literature has been conducted to investigate the relationship between MW and ROP. However, a strong discrepancy in regard to the relationship between MW and ROP was observed. Some literature mentioned that the relationship between them is inverse, and the other said that it was direct. Thus, real field data have been gathered (over 800 wells) to investigate the relationship between MW and ROP. Practically, data have been categorized based on the UCS of the rocks to better understanding this relationship.
Field data analysis indicated that a significant increase in ROP can be obtained by the appropriate choice of MW based on the hardness of the rock. Selecting the correct MW for drilling individual sections constitutes a key factor in avoiding borehole problems. Low MW may result in collapse issues, while high MW may result in mud losses or pipe sticking. Drilling practice has also shown that excessive variations in MW may lead to borehole failure, thus a more constant MW program should be targeted. MW has to be chosen carefully to avoid unwanted consequences. As a result, the following highlights have been concluded from this study:
-
The results showed that the relationship between ROP and MW is highly affected by the UCS of the rock. Thus, it is important to combine both the mechanical and fluid parameters to better predict and enhance the ROP.
-
For the weak formations, there is an inverse proportionality between the ROP and MW.
-
ROP is not significantly dependent on the MW during drilling the medium formations.
-
A direct relationship between ROP and MW through drilling hard lithology.
-
A significant direct relationship between ROP and MW through drilling very hard rocks.
-
The best practice to drill weak formations is keeping the MW as minimum as possible in order to maximize ROP. On the other hand, when drilling medium, hard, and very hard formation, the best practice is to maintain the MW as high as possible (within an acceptable range that doesn’t cause induce fractures or mud losses) in order to maximize ROP.
Acknowledgment
The authors would like to acknowledge Basra Oil Company from Iraq and British Petroleum Company for providing us various real field data.
References
- Akgun F. 2002. How to Estimate the Maximum Achievable Drilling Rate without Jeopardizing Safety,” SPE 78567 presented at Abu Dhabi International Petroleum Exhibition and Conference, Abu Dhabi, United Arab Emirates, pp. 13–16 October.
- The effect of drilling mud density on penetration rate. Int. Res. J. Eng. Technol.(IRJET) (02)
- [Google Scholar]
- Alum, M.A., Egbon, F. 2011. Semi-Analytical Models on the Effect of Drilling Fluid Properties on Rate of Penetration (ROP). Paper SPE-150806 presented at Nigeria Annual International Conference and Exhibition, Abuja, Nigeria, 30 July–3 August.
- Bourgoyne A.T., Millheim K.K., Chenevert M.E., and Young F.S. 1986. Applied Drilling Engineering. Society of Petroleum Engineers Text Book Series, Vol. 1, Richardson, TX.
- An Analysis of Transformations. J. R. Statist. Soc. 1964 pp. 211-243, discussion pp. 244-252
- [Google Scholar]
- Eckel J.R. 1954. Effect of Mud Properties on Drilling Rate. Paper API-54-119 presented at Drilling and Production Practice, New York, 1 January.
- Cutting Efficiency of a Single PDC Cutter on Hard Rock. Petroleum Society of Canada; 2007. doi: 10.2118/2007-082
- Calculating Unconfined Rock Strength From Drilling Data. American Rock Mechanics Association; 2007.
- Biostatistics series module 1: Basics of biostatistics. Indian J. Dermatol.. 2016;61(1):10.
- [CrossRef] [Google Scholar]
- Nonparametric Statistical Methods. Hoboken, NJ: John Wiley & Sons; 2014.
- Fundamentals of Sustainable Drilling Engineering. Scrivener Publishing LLC.. 2015;27:Feb.
- [Google Scholar]
- JMP: Release 7. (2007). Cary, NC: SAS Institute.
- Mitchell, J. 2001. “Trouble-Free Drilling”. Pre-Edition version “s” of Volume 1
- A guide to appropriate use of Correlation coefficient in medical research. Malawi Med. J. J. Med. Assoc. Malawi. 2012;24(3):69-71.
- [Google Scholar]
- Biostatistics: The Bare Essentials. Peoples. Medical Publishing House; 2014.
- Rate of Penetration Estimation Model for Directional and Horizontal Wells. the Graduate School, Middle East Technical University; 2007. Master Thesis
- Effect of Drilling Fluid Properties on Rate of Penetration. NAFTA. 2009;60(3):129-134.
- [Google Scholar]
- SPE 117109 Real-time drill bit wear prediction by combining rock energy and. Drilling Strength Concepts; 2008.
- Applying a neuro-model reference adaptive controller in drilling optimization. World Oil Magazine. 2007;228:29-38.
- [Google Scholar]
- Statistics at square one (Nineth). University of Southampton; Copyright BMJ Publishing Group; 1997.


