

Translate this page into:
Evaluation of the WRF model on simulating the vertical structure and diurnal cycle of the atmospheric boundary layer over Bordj Badji Mokhtar (southwestern Algeria)
⁎Corresponding author. ab.fekih@gmail.com (Abdellali Fekih)
-
Received: ,
Accepted: ,
This article was originally published by Elsevier and was migrated to Scientific Scholar after the change of Publisher.
Peer review under responsibility of King Saud University.
Abstract
The assessment of desert dust and its transport in global atmosphere is highly influenced by the atmospheric boundary layer (ABL) structure and its time evolution over dust sources regions. In this paper, simulations were carried out using three widely used Planetary Boundary Layer (PBL) parameterizations in the Weather Research and Forecasting (WRF) model at the arid site of Bordj Badji Mokhtar, southwest Algeria (BBM, 21.38°N, 0.93°E, 420 m above sea level) characterized by its high dust emission potential. The main objectives were: (1) to investigate the structure and diurnal cycle of wind and temperature in the ABL (2) to evaluate and determine the PBL scheme suitable for mineral dust modelling in this region. Experiments were conducted under dry summer conditions on 08–13 June 2011 using three different PBL schemes: [Mellor–Yamada–Janjic (MYJ), Yonsei University (YSU) and Mellor-Yamada-Nakanishi-Niino (MYNN2)]. Predicted wind and temperature were validated against observed surface and upper air radiosonde data collected during a field measurement campaign undertaken at BBM in June 2011. It was found, that WRF model was able to reproduce the vertical structure and diurnal evolution of the dry ABL mainly during stability conditions. Among the three PBL schemes, WRF-MYNN2 PBL scheme performed better at surface level. However YSU scheme performed better in the ABL level with least errors and was the most suitable for this region.
Keywords
Atmospheric boundary layer
PBL scheme
WRF
Wind profile

1 Introduction
The knowledge of the atmospheric boundary layer is presently a challenge for a number of researchers involved in the fields of wind power assessment, air quality, dispersion and transport of pollutants as meteorological fields are highly variable, and their properties vary from one location to another. When addressing to arid regions of Sahara, accurate observations and acquisition instruments are rarely available leading to a gap of knowledge about the behaviour of the atmospheric boundary layer. Moreover meteorological fields in arid area related to dust uplift and transport are highly influenced by surface conditions as the intense soil heating associate with surface features can highly affect the thermal mixing and the grow of the atmospheric boundary layer depth which determines wind shear (Arya, 2001). In recent years, high resolution simulations have been conducted using numerical weather prediction models as a tool for simulating atmospheric boundary layer parameters (Carvalho et al., 2012; Hu et al., 2010; Hariprasad et al., 2014; Madala et al., 2015). The accuracy of model outputs may vary considerably depending mainly on topography and terrain morphology of the modeled domain and the physical processes taken into account in the model by the use of parameterization schemes. The WRF-ARW model (Skamarock et al., 2008) hereafter WRF is one of the most widely used numerical weather prediction model for estimating high resolution meteorological data (∼1 km) and is always in progress by proposing the latest improvements in parameterization schemes. Nevertheless, many authors have reported a sensitivity of WRF model to the choice of PBL scheme for the simulation of the ABL parameters over various regions of the world as Hu et al. (2010) in South-central United States, Hariprasad et al. (2014) and Madala et al. (2015) in India. To our knowledge, no such study has been carried out in arid Saharan region. The purpose of this study is to evaluate the capability of the WRF model in simulating the structure and time evolution of the ABL wind and temperature fields over Bordj-Badji Mokhtar (southwestern Algeria) under dry summer conditions. In order to choose the appropriate set of physics options, three experiments were performed using widely used PBL schemes, Mellor-Yamada-Janjic (MYJ), Mellor-Yamada-Nakanishi-Niino (MYNN), and Yonsei University (YSU). Results were compared with surface and upper air data collected at BBM site during a field measurement campaign undertaken in June 2011 and made available by Algerian weather service (O.N.M). The paper was structured as follows: the next section described the data sets and methodology used. Model results and evaluations against observations were given in Section 3. Finally, the main conclusions were presented in Section 4.
2 Data and methodology
2.1 Measured data
The data used to validate simulations was provided by the Algerian Weather Service (ONM) as part of the FENNEC project measurement campaign undertaken during June 2011 at Bordj Badji Mokhtar (Fig. 1) in southwestern Algeria close to the BBM weather station (ID: 60686, 21.38°N, 0.93°E, 420 m above mean sea level). The goal of this project was the understanding of the Saharan climate system. For the present study, we used hourly surface data of temperature at 2 m height, wind speed and wind direction at 10 m height together with Three-hourly upper air data of temperature, zonal and meridional wind components
to validate high-resolution WRF simulations in the first 1000 m above ground level (AGL) of the boundary layer over BBM during a dry weather period (08–13 June 2011) with relative humidity less than 20%.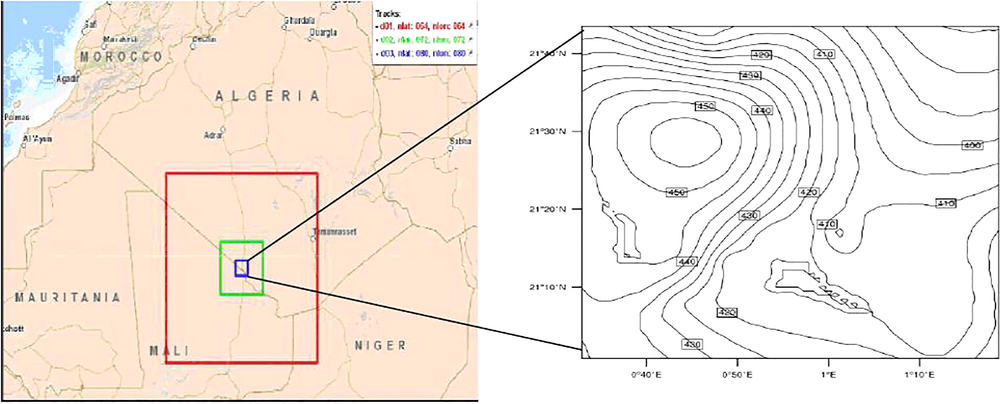
Simulation domains used and topography (m) of the WRF model.
2.2 Model and experimental design
The present study used the Advanced Research WRF (ARW) atmospheric mesoscale model version 3.6. The model was developed by the National Centre of Atmospheric Research (NCAR) and the National Centre for Environmental Prediction (NCEP). The model depends on a set of equations that are fully compressible, non-hydrostatic with a terrain following vertical coordinate with an Arakawa-C grid in the horizontal. The model allows high grid resolution with two-way nesting capabilities. The detailed description of the model is available in Skamarock et al. (2008). In this work, WRF was configured with 3-domains centered at BBM site with 16, 4, 1 km horizontal resolutions covering a large part of central Sahara and north border of Mali (Fig. 1). The characteristics of the three grids were summarized in (Table 1). The vertical domain consisted of 46 atmospheric Eta levels, ranging from surface up to 50 hPa, with the lowest level below 13 m AGL to better resolve the atmospheric boundary layer structure. In this study, WRF was driven by the Final (FNL) operational global analysis data produced by the NCEP and specifying their initial and boundary conditions every 6 h starting from 00 h UTC to 18 h UTC on a 1° x 1° latitude-longitude grid (see http://rda.ucar.edu/datasets/ds083.2). The topographical and land cover features was provided by the United States Geological Survey data (USGS) at resolution of 9 km, 4 km, and 1 km. The common model physics options included: WSM3 microphysics scheme (Hong et al., 2004), shortwave radiation (Dudhia, 1989), RRTM (Mlawer et al., 1997) for long wave radiation, Kain-Fritsh cumulus scheme (Kain and Fritsch, 1993), the 5-layer thermal diffusion scheme (Dudhia, 1996) for land surface model (LSM). Three experiments were conducted using the above common physics options with three different PBL parameterization schemes as follows: The Yonsei University PBL scheme (YSU) is a first- order closure scheme that considers the non-local mixing by adding a counter gradient term in the eddy-diffusion equation. One of the major enhancements of the YSU scheme is the explicit treatment of entrainment process at the top of the PBL. The two remaining PBL schemes, Mellor–Yamada–Janjic (MYJ) and Mellor–Yamada–Nakanishi–Niino (MYNN2) are classified as one-and-half order, local closure schemes requiring an additional prognostic equation of the turbulent kinetic energy (TKE). The entrainment process is represented using computed eddy diffusivity from the prognostic TKE near the top of the PBL. The two TKE-based PBL schemes utilize the same form of TKE but differ in their formulations of the stability and mixing length which are based on the results of large eddy simulation (LES) in the case of MYNN2 scheme. The three PBL schemes were associated with appropriate surface layer scheme as detailed in table 2. The model was initiated at 12 h UTC on 07 June 2011 and integrated for 06 days with the first 12 h of each simulation treated as spin up and the remaining period beginning from 00 h UTC on 08 June 2011 used for evaluations.
Grid
1
2
3
Resolution (km)
16
4
1
Number of points in horizontal
4225
5329
6400
Number of points in vertical
46
46
46
Physics
WRF-YSU
WRF-MYJ
WRF-MYNN2
Surface Layer (SL)
Monin –bukhov -MM5
(Paulson, 1970)Monin –Obukhov –Eta
(Janjic, 2002)MYNN Nakanishi-Niino
(Nakanishi., 2001)
Planetary Boundary Layer (PBL)
Yonsei University (YSU)
(Hong et al., 2006)Mellor-Yamada-Janjic (MYJ)
(Janjic, 2002)Mellor-Yamada Nakanishi-Niino (MYNN2.5)
(Nakanishi and Niino, 2006)
2.3 Model evaluation
Model simulated data of wind and temperature were validated using meteorological surface and radiosonde data measurements. Three statistical parameters were used according to Carvalho et al. (2012). First we used the Root Mean Squared Error (RMSE) which represents the deviation between simulated
and respective observed
data in the same place and time instant and
is the total number of data points.
Second, we used the Bias allow the evaluation of the data tendency. A positive (negative) bias means that the simulations overestimate (underestimate) the measured values:
To evaluate the dispersion of the error between observed and simulated data, we used the Standard Deviation Error (STDE) defined as:
If the standard deviation error is low, the simulation physics is correct. Simulated values are close to observations. If the STDE is high, the error is random.
3 Results and discussion
The results from simulations with 1 km resolution, which showed detailed features and improvements, were considered in this paper. Model validation was performed considering statistical analysis presented in Tables 3 and 4.
Parameter
Simulation
BIAS
RMSE
STDE
Temperature at 2 m
(°C)
(°C)
(°C)
WRF-YSU
−1.88
2.76
1.88
WRF-MYJ
−2.06
2.79
2.02
WRF-MYNN2
−2.64
3.45
2.22
Wind speed at 10 m
(ms−1)
(ms−1)
(ms−1)
WRF-YSU
−1.18
2.35
2.12
WRF-MYJ
−1.66
2.87
2.34
WRF-MYNN2
−1.04
2.36
2.03
Wind direction
(deg)
(deg)
(deg)
WRF-YSU
−15.82
31.36
27.07
WRF-MYJ
−10.19
29.84
28.04
WRF-MYNN2
−15.72
30.13
25.71
Parameter
Simulation
BIAS
RMSE
STDE
Potential temperature
(°K)
(°K)
(°K)
WRF-YSU
−0.40
1.04
0.99
WRF-MYJ
−0.13
1.12
1.11
WRF-MYNN2
−0.13
1.12
1.12
Wind speed
(ms−1)
(ms−1)
(ms−1)
WRF-YSU
−0.72
2.89
2.61
WRF-MYJ
−1.26
3.16
2.89
WRF-MYNN2
−1.23
2.91
2.82
Wind direction
(deg)
(deg)
(deg)
WRF-YSU
−11.63
38.33
35.95
WRF-MYJ
−6.68
42.68
42.15
WRF-MYNN2
−13.30
43.56
41.98
3.1 Time evolution of surface parameters
3.1.1 Temperature at 2 m
The temporal variation of surface 2-m temperature for the study period was shown in Fig. 2. All the three model experiments (WRF-YSU, WRF-MYJ, and WRF-MYNN2) were able to capture the time evolution of the surface temperature. The change in magnitude and timing of the temperature was well reproduced by the three PBL schemes. However a cold bias was noticed during the night-time and early morning with an underestimation of the temperature minima, which occurs around 06 h UTC. We also noticed the better performance of the YSU PBL scheme being closer to the observations compared with the two other schemes (MYJ and MYNN2) which were similar. This findings was also reported by Boadh et al. (2016) over India, Garcıa-Dıez et al. (2013) over Europe, Hu et al. (2010) over south central USA. During the daytime, the YSU PBL scheme was able to better reproduce the observed temperature and its maxima, which occurs around 15hUTC. This was followed by MYJ scheme, which slightly underestimate the observed temperature maxima. The lower performance was made by MYNN2 PBL scheme with a pronounced cold bias reaching 2 °C registered during daytime at 15 h UTC. Globally, the three PBL schemes were able to successfully reproduce the evolution of surface temperature with a good performance of the WRF-YSU scheme which indicated less error according to table 3.
Time evolution of simulated and observed 2-m temperature (°C) during the study period (8–13 June 2011) over BBM site.
3.1.1 Wind speed and direction at 10 m
Fig. 3 showed the observed and modeled temporal evolution of surface wind for the entire study period. The three experiments WRF-YSU, WRF-MYJ, WRF-MYNN2 showed globally similar trend and were able to capture the general behaviour of wind speed (Fig. 3a) despite the differences in terms of timing and magnitude. Also all the model experiments slightly underestimated the wind speed and its minima and maxima which occur around 09 h UTC for wind speed maxima and around 06 h UTC for wind speed minima. The underestimation of surface wind by WRF may be attributed to global model initial and boundary conditions which underestimate observations over Sahel region (Bain et al., 2010). According to Table 3, mean statistical errors showed that among all PBL schemes, experiment with MYNN2 was the best in reproducing the evolution of surface wind speed especially during nighttime since it showed the lowest errors followed by the YSU PBL scheme. Similar results were reported in term of performance by Hariprasad et al. (2014), Madala et al. (2015). The simulated and observed temporal evolution of surface wind direction over BBM was shown in Fig. 3b. To avoid the large errors committed when comparing the directional angle slightly below 360° and the angle slightly over 0°, a value of 360° was added to the angle of lower value which allowed the wind direction axis to extend to 405° according to Risch and Estham (2011). It was clearly seen that all model experiments (YSU, MYJ, MYNN2) were able to accurately reproduce the wind direction despite a large directional shears in the simulations conducted by the non local schemes (MYJ, MYNN) during the first 06 h initial period (00–06 h UTC). In addition, model was able to capture the change in wind flow, which rotates from north sector to the southeast sector in 13 June at 00 h UTC. Among the three PBL schemes, simulation with MYNN2 was the best PBL scheme in reproducing the evolution of surface wind direction followed by the YSU scheme as mentioned in Table 3. A more detailed analysis to evaluate model performance in simulating surface wind was performed by comparing simulated and observed wind speed and direction for all study period using wind roses diagrams showed in (Fig. 4) and histograms of angle differences between simulated and observed wind direction (Fig. 5). Observed wind rose (Fig. 4a) showed that most wind blowing directions were from the north and northwest sectors. All PBL schemes showed similar patterns with differences in magnitude. The most observed wind flow component was from north sector while the most simulated winds indicated northwesterly flow. WRF model failed to capture high wind speeds (8–10 ms−1) blowing from north. MYNN2 and YSU PBL schemes (Fig. 4b and c) showed similar patterns and were able to capture moderate and high wind speeds (4–8 ms−1) blowing from north and northwest sectors while WRF-MYJ scheme (Fig. 5d) indicated a predominance of low wind speed component (2–4 ms−1) blowing from northwest. Wind direction evaluation was also made through the analysis of histograms of angle differences between observed and simulated wind directions as presented in Fig. 6. Results confirmed that MYNN2 was the best PBL scheme in reproducing the wind flow direction with 32.5% of the sample presented an angle difference of 10° and in 96% of cases the angle was around 45°. This is followed by the WRF-YSU scheme with 27.5% of cases presented an angle of 10° and in 96% an angle difference of 45°. The WRF-MYJ scheme was the last with 32.5% of the sample presented an angle difference of 10° and in 90% of cases presented an angle of 45°. These findings agreed with statistical errors presented in Table 3, which indicated the best performance of the two PBL schemes WRF-MYNN2 and WRF-YSU.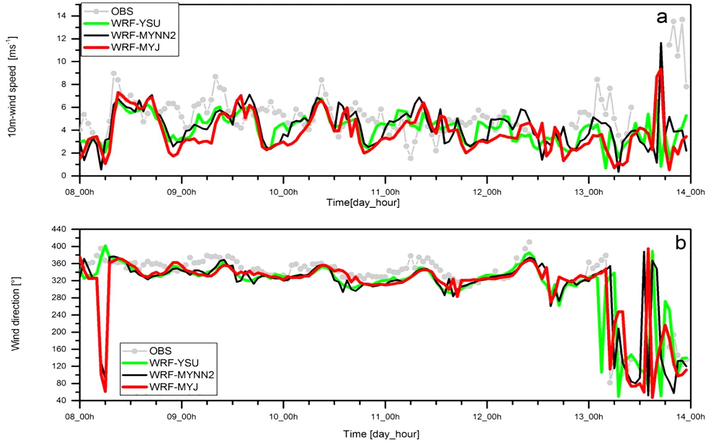
As in Fig. 2, but for (a) 10-m wind speed (ms−1), (b) wind direction (degree).
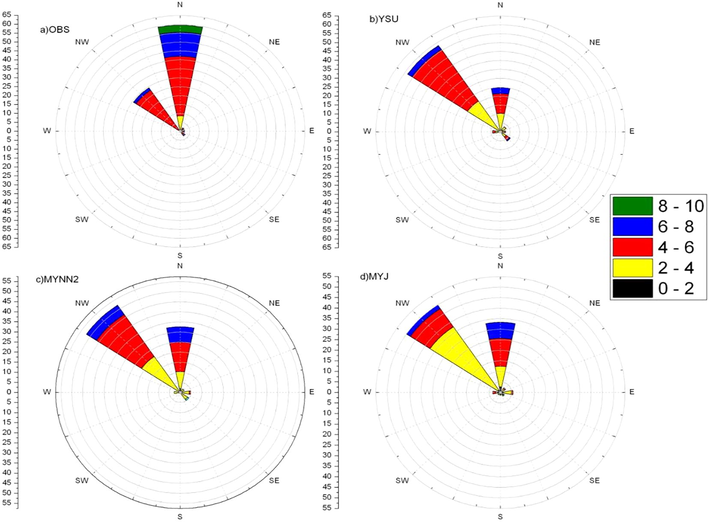
Simulated and observed surface wind roses: (a) observations, (b) YSU, (c) MYNN2, (d) MYJ, during the study period (8–13 June 2011) over BBM.
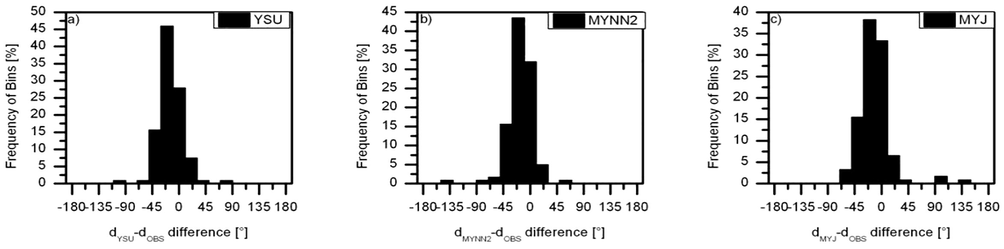
Histograms of angle differences (degree) between observed and simulated surface wind direction: (a) YSU-OBS, (b) MYNN2-OBS, MYJ-OBS, during the study period (8–13 June 2011) over BBM.
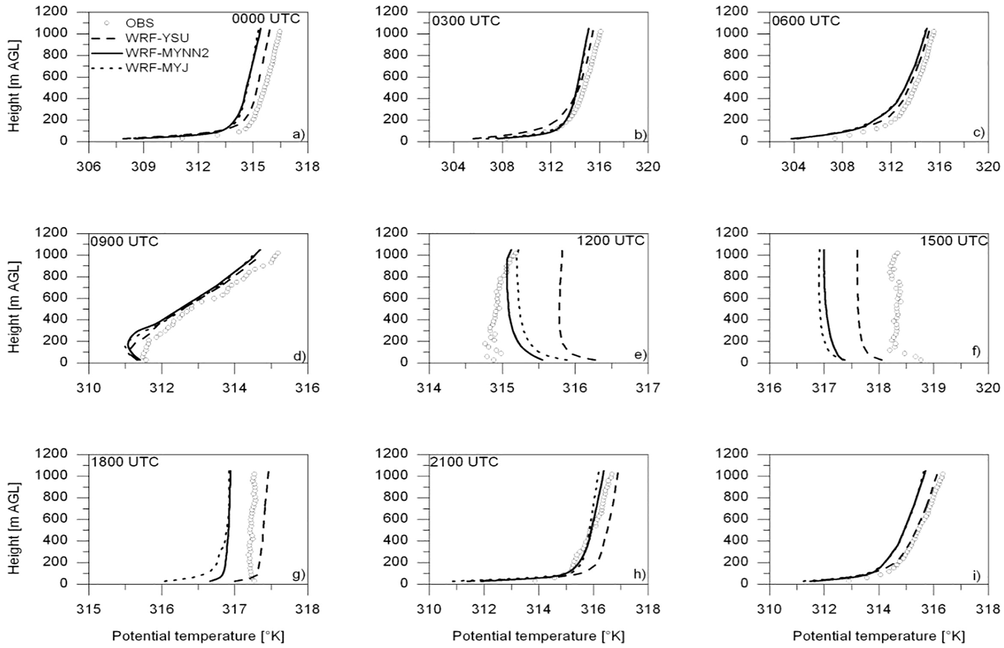
Observed and simulated potential temperature profiles (°K) averaged for synoptically hours (a–h) and daily mean (i) for the study period (8–13 June 2011) over BBM.
3.2 Vertical ABL structure
Simulated and observed vertical profiles of potential temperature, wind speed and wind direction were averaged for the synoptically hours (00, 03, 06, 09, 12, 15, 18, 21 UTC) which represent the time launching of radiosondes over BBM site during the experiment period (08–13 June 2011). This was resulting in composite profiles of potential temperature, wind speed and wind direction as respectively shown in Figs. 6–8.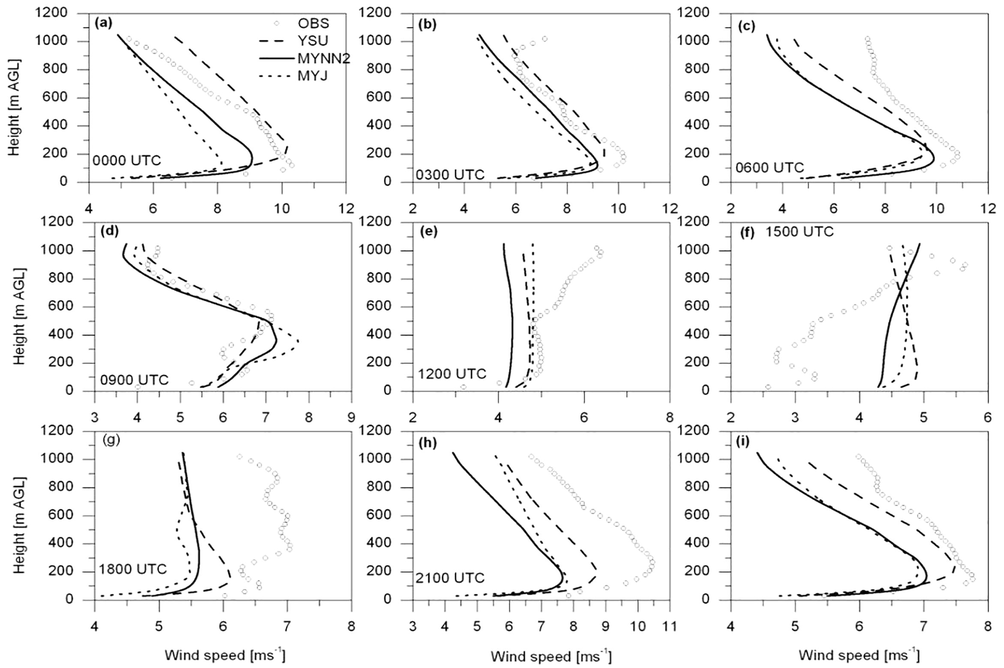
As in Fig. 6, but for wind speed profiles (m/s).
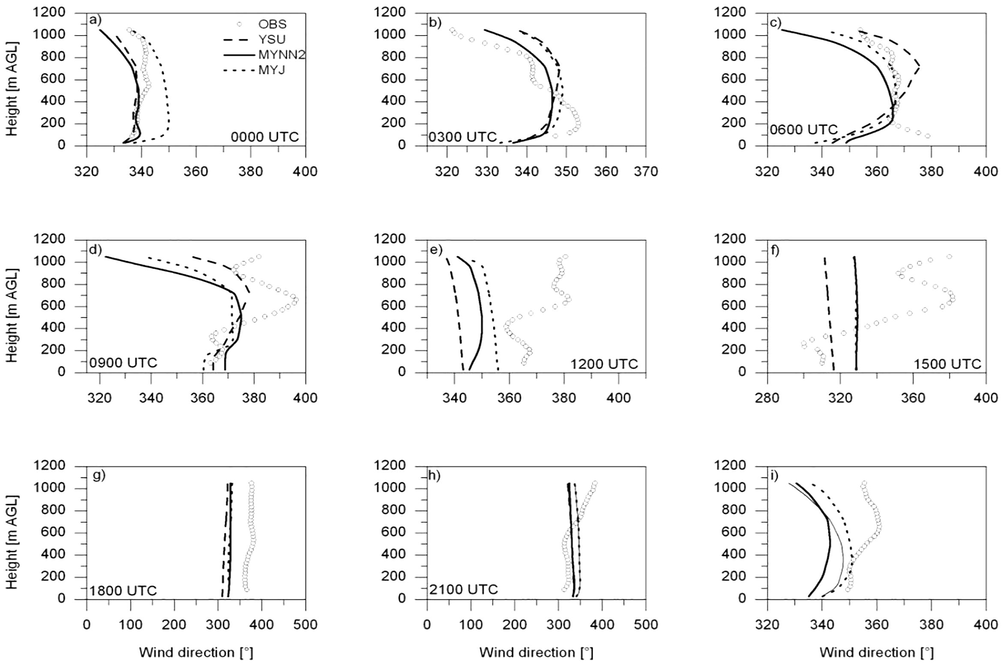
As in Fig. 6, but for wind direction profiles (degree).
3.2.1 Potential temperature profiles
Potential temperature profiles simulated with the three PBL schemes were similar to the observed profiles during the nighttime and early morning, mainly the surface cooling, and the inversion layer were well-reproduced (Fig. 6a–c, h). The Profiles simulated by WRF-YSU scheme were the closest to the observations and best reproduced the vertical temperature evolution during the night end morning. However, the case of 21 h UTC (Fig. 6 h) indicated a slightly overestimation of the observed temperature by the WRF-YSU scheme. During daytime, model succeeded in reproducing the time occurring of the surface layer warming starting around 09 h UTC after sunrise as shown in Fig. 6d. Also all PBL schemes were able to qualitatively capture the observed mixed layer growing up to 1000 m AGL as shown in (Fig. 6e and f). However, a jump in the observed profile of temperature greater than 3°K was identified between 12 h and 15 h UTC. Thus the mixed layer was overestimated at 12 h UTC (Fig. 6e) with good performance of the WRF-MYNN2 scheme, and underestimated at 15 h UTC (Fig. 6f) with the WRF-YSU scheme being the closest to the observed mixed layer. This behaviour of the temperature profiles could not be explained but may be due to surface layer parameterization or local flow conditions. Among the three PBL schemes, WRF-YSU leaded to better results according to the mean statistical errors indicated in Table 4.
3.2.2 Wind speed profiles
The simulated vertical wind speed profiles (Fig. 7) were in better agreement with observations during the nighttime and early-morning periods (Fig. 7a–c, h) despite a slightly underestimation of the wind speed in most cases. This negative bias recorded in this region was related to the global model data driving WRF model. Carvalho et al. (2012) also reported an underestimation of wind speed over Portugal. Also when stability occurs by night, the three PBL schemes were able to satisfactory capture the low level wind shear at a height of 200 m AGL with a slightly differences in magnitude and height of the wind speed maximum. In all nighttime cases, wind speed simulated with YSU scheme increased more rapidly than the two other schemes (MYJ, MYNN2) in the first layer (0–200 m AGL) with wind maximum close to the observations. The difference between observed and YSU-simulated wind maximum was about 1 ms−1. The other schemes (MYJ, MYNN2) followed the same behaviour but simulated lower wind speeds. The performance of the YSU PBL scheme was attributed to the enhanced vertical mixing by the account of an explicit term in the diffusion equation for the treatment of the entrainment zone at the top of PBL. Simulated wind speed profiles during daytime (Fig. 7d–g) were less satisfactory compared to nighttime profiles. However, the model captured the general behaviour of observed profiles at 09 h, 12 h and 18 h UTC. Large discrepancy was noticed in the profile of 15 h UTC (Fig. 7f) which was unclear, but it may be related to the strengthening in the convection and the influence of local flow. Over all PBL schemes, WRF-YSU experiment gave better results and succeeded in reproducing wind speed profile. This was confirmed when analyzing the daily composite wind profile for the study period in Fig. 7i. In addition the performance of the YSU PBL scheme was confirmed by the evaluation of mean statistical errors parameters indicated in Table 4 showing the lowest errors followed by MYNN2 PBL scheme. This results agree in term of performance with the findings of Boadh et al. (2016), Carvalho et al. (2012), Hariprasad et al. (2014), Madala et al. (2015).
3.2.3 Wind direction profiles
The simulated wind direction profiles were compared with observations data and results were depicted in Fig. 8. All model experiments (YSU, MYNN2, and MYJ) showed similar pattern and captured qualitatively the wind direction profiles during nighttime and early morning (Fig. 8a–d, h). During daytime, large shape differences in observed and simulated profiles were shown and the model failed in reproducing the observed wind directional shear as depicted in (Fig. 8e and f). This behaviour of the model was unclear and may be due probably to sensitivity of model to surface parameterization and initial conditions. The histograms of angle difference between observed and simulated wind directions presented in Fig. 9 showed that YSU was the best PBL scheme in reproducing the wind flow direction with 57% of the sample presented an angle difference of 10° and in 89% of cases the angle was around 45°.The second was the WRF-MYNN2 scheme with 32% of cases presented an angle of 10° and in 89% of cases presented an angle difference of 45°. The WRF-MYJ scheme was the last with 32% of the sample presented an angle difference of 10° and in 86% of cases presented an angle difference of 45°. These findings were in agreement with statistical errors presented in Table 4, which indicated a better performance of the WRF-YSU followed by WRF-MYNN2 scheme.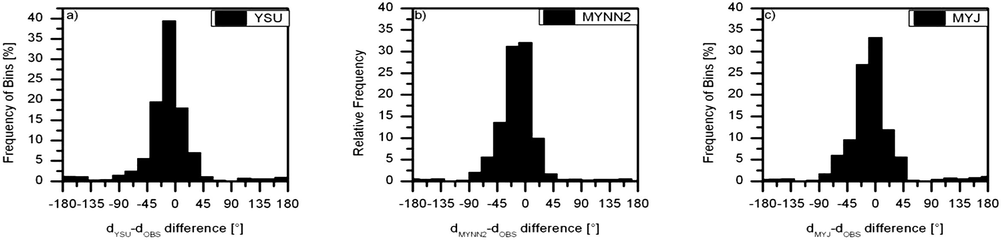
As in Fig. 5, but for wind direction profiles.
3.3 Diurnal cycle of ABL
The mean diurnal cycle of observed potential temperature and wind speed in the atmospheric boundary layer as derived from the 3-hourly radiosonde date over BBM was compared with the WRF simulated diurnal cycle for the period of study. The results were shown in Figs. 10 and 11.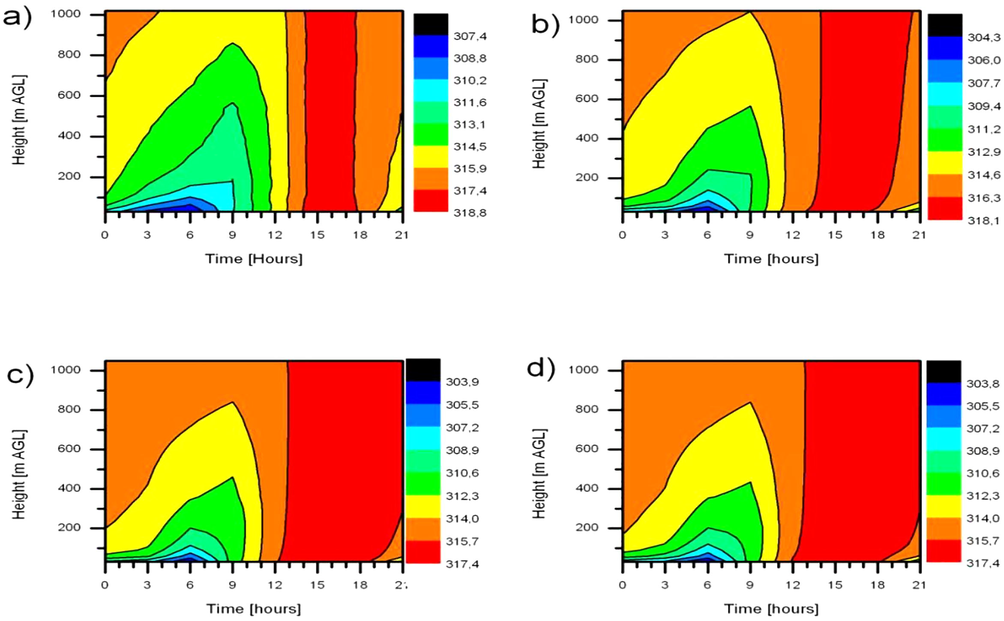
Mean Simulated and observed diurnal cycle of potential temperature (°K), (a) observations, (b) WRF-YSU, (c) WRF-MYNN2, (d) WRF-MYJ, averaged for the study period (8–13 June 2011) over BBM.
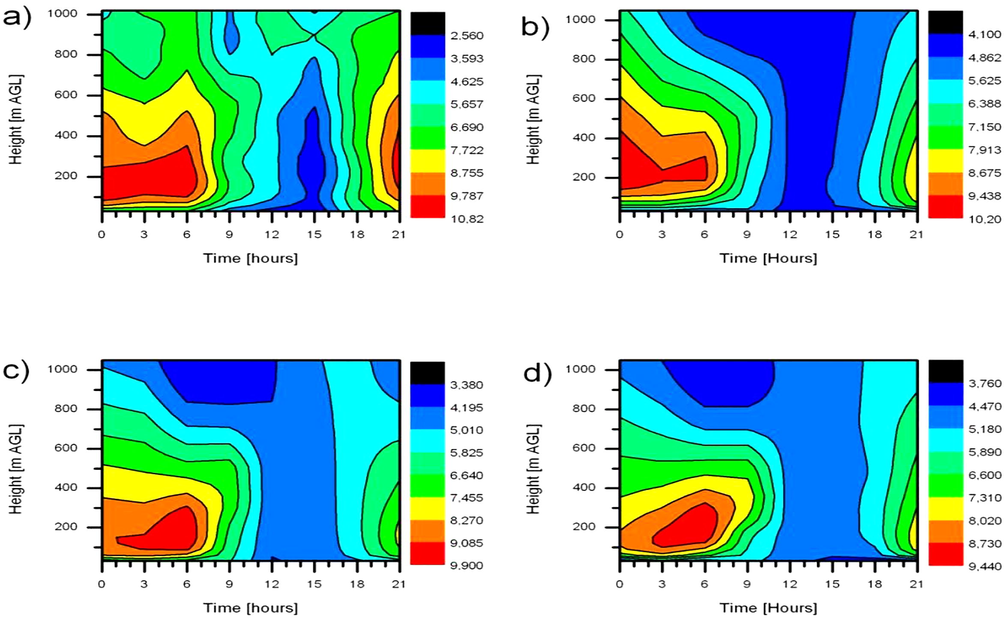
As in Fig. 10, but for wind speed (m/s).
3.3.1 Potential temperature
For potential temperature, the model was able to predict well the observed diurnal cycle for all the PBL schemes (Fig. 10a). During night-time and early morning, the surface cooling and the increase in temperature with height were successfully reproduced by the three experiments (Fig. 10b–d) with differences in the height of the inversion layer and the cold bias at the near surface. During the day with the increase of turbulence between 12 h and 15 h UTC, all the three ABL experiments (YSU, MYNN2, MYJ) were able to reproduce the mixing layer with a slightly differences in timing.
3.3.2 Wind speed
In the same manner, as presented above, the ABL diurnal cycle of the wind speed simulated by the three model experiments (WRF-YSU, WRF-MYNN2, and WRF-MYJ) was compared with observations data averaged for the study period and results were depicted in Fig. 11. The three model experiments represented in Fig. 11b–d showed similar patterns with observations data Fig. 11a and were able to capture the vertical and temporal characteristics of the mean observed wind speed over BBM site. According to Fig. 11a, when sunset occurs after 18 h UTC, the turbulence decreased and the low-level wind speed decreased from the surface up to 500 m AGL. When stability strengthens by night, the maximum mean wind speed was around 11 m/s with a height of 100–200 m AGL and a time occurring between 21 h and 06 h UTC in agreement with results of Bain et al. (2010) in semiarid region. This behaviour was satisfactory captured by the three PBL schemes with differences in timing, height, and magnitude. Thus the WRF-YSU experiment (Fig. 11b) showed better results and simulated well the low level wind speeds with a good timing and with a wind maxima around 10 m/s. The two other experiments WRF-MYNN2, WRF-MYJ (Fig. 11c and d) showed a slightly differences in timing and magnitude. After sunrise, the wind speed decreased with height around 09 h UTC and reached a value less than 4 m/s around 15 h UTC due to the surface heating and the increase in mixing process. This feature was well reproduced by WRF model. Also Among the three ABL experiments, the WRF-YSU scheme was able to better simulate the diurnal cycle of ABL over BBM.
4 Conclusions
In this paper, numerical simulations were carried out with WRF model to study the characteristics of the Atmospheric Boundary Layer vertical structure and time evolution at arid site of Bordj-Badji Mokhtar in southwest Algeria known with its high dust potential. Three widely used atmospheric planetary boundary layer schemes (WRF-YSU, WRF-MYJ, and WRF-MYNN2) were evaluated in WRF model during a dry summer period (08–13 June 2011) to assess the ability of the model in reproducing ABL observed features. The model results were analyzed and evaluated against surface observations and upper air radiosonde data collected at BBM site during June 2011. The results indicated that the model was able to capture the main ABL features over Bordj Badji Mokhtar under dry conditions. The analysis of surface and upper air parameters (wind and temperature) showed that they were sensitive to the choice of boundary layer applied in the WRF model. Thus the analysis of surface and upper air temperature indicated that the model agreed well with observations with better performance of the YSU scheme. In term of surface wind flow, the MYNN2 followed by YSU scheme performed better with a slightly underestimation in magnitude. The upper air structure indicated that for all PBL experiments, WRF model was able to capture with satisfaction the stable boundary layer with better performance of the YSU PBL scheme in simulating the vertical structure of the ABL in term of temperature and wind flow followed by MYNN2 scheme. Also noticed that the daytime upper air profiles were less satisfactory compared with night-time profiles. Considering the diurnal cycle, all WRF model experiments were able to capture the ABL mean diurnal cycle with better results of the YSU PBL in term of magnitude, and timing. In general the YSU PBL scheme was appropriate in simulating the stable boundary layer under dry conditions over arid region. WRF model needed to be assessed under moistly conditions to further study the performance of these PBL schemes in arid areas.
Acknowledgement
The authors wish to thank the support of Office National de la Météorologie (ONM ,Algérie) for providing data. Global FNL data for this study are from the research data archive (RDA) at the National Center for Atmospheric Research (NCAR) Computational and Information System Laboratory (CISL). URL:http://dx.doi.org/10.5065/D6M043C6.
References
- Introduction to Micrometeorology. New York: Academic Press; 2001. 420 pp
- Observations of the nocturnal boundary layer associated with the West African Monsoon. Mon. Wea. Rev.. 2010;138:3142-3156.
- [Google Scholar]
- Sensitivity of PBL schemes of the WRF-ARW model in simulating the boundary layer flow parameters for their application to air pollution dispersion modeling over a tropical station. Atmosfera. 2016;29:61-81.
- [Google Scholar]
- A sensitivity study of the WRF model in wind simulation for an area of high wind energy. Environ. Model. Soft.. 2012;33:23-34.
- [Google Scholar]
- Numerical study of convection observed during the winter monsoon experiment using a mesoscale two dimensional model. J. Atmos. Sci.. 1989;46:3077-3107.
- [Google Scholar]
- Dudhia, J., 1996. A multi-Layer soil temperature model for MM5. In: Preprints, 6th Annual MM5 User Workshop, Boulder, CO.
- Seasonal dependence of WRF model biases and sensitivity to PBL schemes over Europe. Q. J. R. Meteorol. Soc.. 2013;139:501-514.
- [Google Scholar]
- Numerical simulation and intercomparison of boundary layer structure with different PBL schemes in WRF using experimental observations at a tropical site. Atmos. Res.. 2014;145:27-44.
- [Google Scholar]
- A revised approach to ice microphysical processes for the bulk parameterization of clouds and precipitation. Mon. Weather Rev.. 2004;132:103-120.
- [Google Scholar]
- A new vertical diffusion package with an explicit treatment of entrainment processes. Mon. Weather Rev.. 2006;134:2318-2341.
- [Google Scholar]
- Evaluation of three planetary boundary layer schemes in the WRF Model. J. Appl. Meteor. Climatol.. 2010;49:1831-1844.
- [Google Scholar]
- Janjic, Z.I., 2002. Nonsingular implementation of the Mellor-Yamada level 2.5 scheme in the NCEP Meso model. NCEP Office Note. No.437, 61pp.
- Convective parameterization for mesoscale models: the Kain-Fritcsh scheme. In: Emanuel K.A., Raymond D.J., eds. The Representation of Cumulus Convection in Numerical Models. Boston, MA, USA: Amer. Meteor Soci; 1993. p. :165-170.
- [Google Scholar]
- Mesoscale atmospheric flow-field simulations for air quality modeling over Complex terrain region of Ranchi in Eastern India using WRF. Atmos. Environ.. 2015;107:315-328.
- [Google Scholar]
- Radiative transfer for inhomogeneous atmospheres: RRTM, a validated correlated-k model for the longwave. J. Geophys. Res.. 1997;102:16663-16682.
- [Google Scholar]
- Nakanishi, M., 2001. Improvement of Mellor-Yamada turbulence closure model based on large-Eddy simulation data. Bound.-Layer Meteorol. 99, 349–378.
- Nakanishi, M., Niino, H., 2006. An improved Mellor-Yamada level-3 model: its numerical stability and application to a regional prediction of advection fog. Bound.-Layer Meteorol. 119, 397–407.
- The mathematical representation of wind speed and temperature profiles in the unstable atmospheric surface layer. J. Appl. Meteorol.. 1970;9:857-861.
- [Google Scholar]
- Risch, C., Estham, E., 2011. Correlation of sodar and met tower measurements. pp.15 Marshall University for Western Virginia Division of Energy. CBER Technical Report. http://www.wvcommerce.org/App_Media/assets/doc/energy/MU_SODAR-Met_Correlation_Report_for_web_April_2011.pdf (accessed 11 Nov 2017).
- Skamarock, W.C Klemp, J.B., Dudhia, J., Gill, D.O., Barker, D.M., Huang, X.Y., Wang, W., Powers, J.G., 2008. A description of the Advanced Research WRF version 3. NCAR technical Note NCAR/TN-475+STR, pp.113.


