

Translate this page into:
Evaluation of mechanical and erosive wear properties of hybrid nano composites basalt/E-glass fiber + MWCNTs/SiO2
⁎Corresponding author. sathisht.sse@saveetha.com (T. Sathish)
-
Received: ,
Accepted: ,
This article was originally published by Elsevier and was migrated to Scientific Scholar after the change of Publisher.
Peer review under responsibility of King Saud University
Abstract
The extensive study conducted has revealed that the mechanical and other characteristics of hybrid composites are greatly influenced by several aspects, such as the kind of fibre reinforcement, nanofillers, matrix materials, and the manufacturing methods employed. In the context of structural applications, the incorporation of Multi-wall Carbon Nanotubes (MWCNTs) as fillers in E-Glass fibres had a significant impact on the rapid alteration of mechanical properties, particularly strength, in the composites. This study aimed to create hybrid nanocomposites by including multi-walled carbon nanotubes (MWCNTs) and silicon dioxide (SiO2) as filler materials, Basalt/E-glass as fibres, and epoxy with hardener as the matrix. This study utilises statistical methods, specifically the Taguchi L16 Orthogonal Array (OA), to analyse the impact of various operating factors. The parameters selected for this study include MWCNTs/SiO2 fillers at varying weight percentages (0 %, 1 %, 2.9 %, and 3 %), an epoxy matrix with decreasing weight percentages (40 %, 39 %, 38 %, and 37 %), compression pressures ranging from 5 MPa to 35 MPa, and moulding temperatures ranging from 40 °C to 100 °C. The mechanical parameters being examined are the tensile strength and erosive wear. The utilisation of the hand layup and compression moulding technique achieved the development of these composites. By optimising the moulding temperature, significant improvements were achieved in the tensile strength, which reached 184.38 MPa. Similarly, reducing the percentage of fillers resulted in a substantial decrease in erosive wear, with a value of 95.06 mg/kg.
Keywords
Hybrid Fillers
Compression Pressure
Moulding temperature
Taguchi optimization

1 Introduction
Composite materials are replacing ceramics, wood, and metals due to their processing ease and productivity (Pani et al., 2019). Polymeric composites are preferred for their strength and stiffness in maritime, chemical, electrical, automotive, aerospace, and biomedical applications (Shettar et al., 2020) Synthetic or natural fibres in polymeric composites give them unique features for these applications. Carbon, Glass, and Basalt synthetic fibres are appropriate for bearing fabrication since they are stiffer and stronger than MMC (Namdev et al., 2022; Natrayan et al., 2022; Chin et al., 2020). Glass-fiber reinforcement is ideal for aerospace applications due to its mechanical and thermal qualities. Polymer composites with matrix materials like polyurethane, polyester, epoxy, polypropylene, and polyvinyl butyrate are used in ballistic armour, bulletproof vests, and helmets. Hybrid composites are used in many applications because epoxy resin increases their mechanical strength (Baby et al., 2019; Hsissou et al., 2021; Jiang et al., 2021). Epoxy matrix materials lower composite density, making them useful for lightweight component production. For aerospace applications, glass-fiber epoxy composites have strong adhesive bonding (Choudhary et al., 2019). Industrially important research into epoxy-based synthetic fibre composite materials' processing methods for polymer-based composite strength and hardness (Deeban et al., 2023).
Polymer-based epoxy composites, especially those with glass and carbon fibres, have excellent tribological, mechanical, and physical properties, making them appropriate for various applications (Singh et al., 2021). Carbon, glass, and other fibres strengthen PMCs, while epoxy, phenolic, polylactic acid, polyester, and vinyl ester provide toughness, corrosion resistance, and heat resistance (Kim et al., 2021). Although several matrix materials are used, epoxy resins are particularly helpful in aerospace, automotive, and marine applications due to their strength. Since its introduction as a matrix material, epoxy resin has improved in wear resistance in excavator engine hoods, stiffness and strength in engine frames, energy absorption, tensile, bending, and impact strength and load carrying capacity, hydraulic cylinder weight reduction, and more (Velmurugan et al., 2023; Yao et al., 2021; et al., 2021).
Composites are made by compression moulding, vacuum infusion, manual lay-up, spray-up, vacuum bag moulding, resin transfer moulding, extrusion, injection moulding and filament winding. (Omran et al., 2021). Every process has pros and cons, but compression moulding's inexpensive tooling stands out. Compression moulding improves production rates, dimensional stability, repeatability, surface smoothness, mechanical properties, flame resistance, and more. (Li et al., 2020; Jose et al., 2022; Dani et al., 2021). Compression moulding procedures for epoxy-based fibre-reinforced polymer composites need more research, according to the literature. In the automotive and aerospace industries, compression moulding produces high-strength composite components (Murasing et al., 2021). This method creates complex-shaped carbon-fiber epoxy composites with exceptional mechanical properties. High-temperature compression moulded natural fibre and polylactic acid non-woven mats are also available (Thooyavan et al., 2021). Taguchi optimising compression moulding parameters like temperature, pressure, and duration enhanced polylactic acid polymer/woven flax composite tensile strength. Compression moulding has increased the stiffness and strength of carbon fiber-reinforced composites in most aerospace products (Jeemo et al., 2021).
Recently developed glass fibre polymer composites have used various natural fibres to improve mechanical properties and wear resistance. Reinforcing glass fibre composites using sisal and wood improves their tensile, hardness, flexural, and impact properties (Singh et al., 2019; Ogbonna et al., 2021; Bhat et al., 2021). Glass fiber-reinforced epoxy composites with silica nanoparticles have quintupled fatigue strength. Interlaminar shear, bending, fracture, and impact strengths have improved significantly with basalt, jute, and flax fibres in glass fibre-reinforced polymer composites (Alshahrani et al., 2022; Chiang et al., 2020). Natural fibre should weigh less than glass fibre for hybrid composites to have the best mechanical strength. In hybridization, 10 % of jute and tea leaf fibres produced mechanical strength greater than glass fibre composites (Mouad Chakkour et al., 2023).
Sisal, kenaf, and jute reinforcement of glass fibre or polymer composites have consistently improved mechanical properties (Ahmedizat et al., 2019). Hard particles in material erosion cause wear, one of several forms of material degradation. Polymer composites are used in many industrial situations; hence they must be worn-tested before use. Several studies have examined polymer composites' erosive wear using different fibres and fillers (Bhat et al., 2022; Jeemol et al., 2021). Vacuum-assisted manufacturing created glass fiber-reinforced polymer composites with micro silica and zinc oxide, which were tested for erosive wear at various impingement angles. In the study, zinc oxide increased erosive wear while silica fumes strengthened the composite (Tian et al., 2021). Larger erodent particles and higher incursion angles increased erosive wear. Marble dust reduces erosive wear in glass fiber-reinforced polymer composites by enhancing stiffness and hardness (Eayal et al., 2021). To reduce composite wear, matrix type, filler type, and production methods can be changed.
This study focuses on hybrid nanocomposites made with MWCNT and SiO2 filler materials to reinforce basalt/E-glass fibres and epoxy with a hardener. These composites are hand-laid and compressed moulded. The Taguchi technique optimises process parameters for composite preparation.
2 Materials and methods
Two filler materials were used in this study. Multi-Walled Carbon Nanotubes (MWCNTs) with specified characteristics were the first filler. The inner and outer diameters of these MWCNTs are 3 and 6 nm. MWCNTs average 18 mm long and 98 % pure. Ultrananotech Private Limited in Karnataka supplied these MWCNTs. A second filler material used in this investigation is silicon dioxide. These 30 nm SiO2 particles are 99.95 % pure. SiO2 filler was also purchased from Ultrananotech Private Limited in Karnataka, like MWCNTs.
Basalt and E-Glass fabric fibres were purchased in sufficient amounts for this study's structural components. Table 1 shows their chemical compositions. Chennai-based HAYAEL Aerospace Pvt Ltd supplied these fibres. Araldite LY 556 was the basic resin and Aradur HY 951 the hardener in the epoxy matrix composite production process. Bisphenol-A-derived Araldite LY 556 is medium-viscosity, unaltered liquid resin. Aradur HY 951 is a low-viscosity, unaltered aliphatic polyamine. These ingredients provide a solvent-free, low-viscosity system that cures at room temperature. This system's reactivity can be changed to meet varied processing and curing circumstances by adjusting Aradur HY 951 concentration from 10 to 12 parts. Hand layup and compression moulding were used to make nanocomposites.
Fiber Element
FeO/Fe2O3 [wt%]
CaO [wt%]
Na2O [wt%]
SiO2 [wt%]
K2O [wt%]
Al2O3 [wt%]
MgO [wt%]
TiO2 [wt%]
Basalt
8.6
7.6
2,8
50.6
2.6
19.5
4.7
2.2
E - Glass
0.28
20.03
0.40
58.20
0.41
11.78
0.52
0.38
3 Experimental procedure
Deionized water was used to thoroughly clean MWCNTs and SiO2 surfaces. MWCNTs and SiO2 were then combined with epoxy resin at 40 %, 39 %, 38 %, and 37 % weight percentages. Ultrasonication with a Q700 sonicator @ 30 Hz for 4 h followed mixing. For homogenous nanoparticle dispersion, epoxy, MWCNTs, and SiO2 were mixed with a hardener using a magnetic stirrer. The epoxy-to-hardener mixing ratio was 10:1, using 350 g epoxy and 35 g hardener. Composite samples were made with Basalt/E-Glass fibres and several hybrid combinations (BGFR-E1, BGFR-E2, BGFR-E3, BGFR-E4) and MWCNTs/ SiO2 weight percentages. Fig. 1 shows experimental details.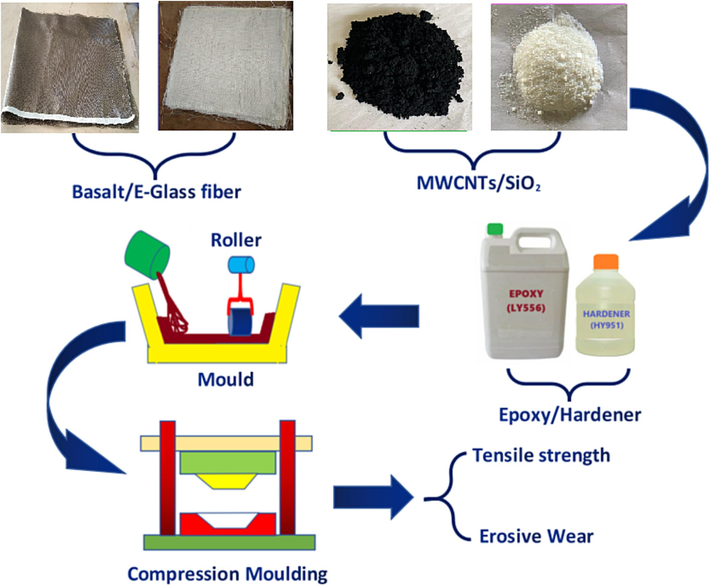
Experimental flow chart.
3.1 Fibre reinforcing ratio of basalt/E-glass maintained 60 %
A new 12-layer stacking sequence of laminates using 6 layers of Basalt fibre and 6 layers of E-Glass fibre created multiple layers of composite materials. The epoxy-filler mixture was mixed and hand-laid to make these laminated composites. Epoxy-filler solutions were put between 12 alternate layers of Basalt/E-Glass fabric. A flat roller compressed laminate surfaces to produce uniform stack thickness. The assembled laminates in the mould were then compressed at various pressures (5 MPa, 15 MPa, 25 MPa, and 35 MPa) and temperatures (40 °C, 60 °C, 80 °C, and 100 °C). Once curing was complete, 200 mm x 200 mm × 6 mm sheets were taken from the mould for testing.
3.2 Tensile test
A Universal Testing Machine (UTM) from Shimadzu Corporation in Kyoto, Japan, was used to test composites' tensile strength. Tensile testing specimens were prepared according to ASTM D 638–03. Each test was conducted numerous times, using 30 × 30 × 5 mm samples. Fig. 2 shows the raw sheet and tensile test specimens.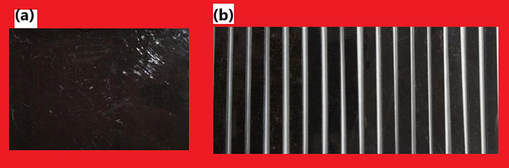
Basalt/E-Glass fiber/ MWCNTs/SiO2 Hybrid nanocomposite: (a) Fabricated Panel (b) Tensile test specimens.
3.3 Erosive wear analysis
The erosion wear test was conducted according to ASTM-G 76 standards, using specimens measuring 30 × 30 × 5 mm3. The investigation utilized an air jet erosion tester supplied by DUCOM.
For this study, various erodent was considered, with a specific focus on silica particles measuring 150 nm in size. The impingement force was applied to the specimen surfaces for a duration of 20 min, achieved through a tungsten carbide nozzle. The selected parameters for this study included an impact velocity of 40 m/s and an impingement angle of 45 degrees, with different experimental conditions. Each sample was weighed both before and after the test to calculate the weight loss.
This investigation employed the Taguchi optimization technique to assess the tensile strength and erosive wear characteristics of laminated composites under various operational conditions. Table 2 furnishes the process parameters, their corresponding levels and responses for all sixteen experimental runs.
Exp. Runs
Fillers (%)
Epoxy matrix (%)
Compression pressure (MPa)
Moulding temperature (oC)
Tensile Strength (MPa)
Erosive Wear (mg/kg)
Predicted Tensile strength (MPa)
Predicted Erosive Wear (mg/kg)
1
0
40
5
40
164.02
184.37
163.57
184.17
2
0
39
15
60
172.96
103.88
173.21
101.1
3
0
38
25
80
175.08
103.47
174.84
102.96
4
0
37
35
100
182.98
95.06
183.42
98.54
5
1
40
15
80
173.87
224.16
174.31
227.64
6
1
39
5
100
180.18
145.78
179.94
145.27
7
1
38
35
40
170.46
194.85
170.71
192.07
8
1
37
25
60
178.68
196.64
178.23
196.44
9
2
40
25
100
181.28
347.05
181.53
344.27
10
2
39
35
80
180.4
302.27
179.95
302.07
11
2
38
5
60
175.52
192.4
175.96
195.88
12
2
37
15
40
172.61
271.66
172.37
271.15
13
3
40
35
60
178.77
413.06
178.53
412.55
14
3
39
25
40
171.55
406.38
171.99
409.86
15
3
38
15
100
184.38
249.45
183.93
249.25
16
3
37
5
80
179.98
297.26
180.23
294.48
4 Results and discussion
Table 2 provides a comprehensive summary of the analysis conducted on tensile and erosive wear, comprising sixteen experimental runs. The highest recorded tensile strength was 184.38 MPa, which occurred when 3 % fillers were present, along with a 38 % epoxy matrix, a compression pressure of 15 MPa, and a moulding temperature of 100 °C. Conversely, the absence of fillers, coupled with maximum compression pressure and moulding temperature, resulted in superior wear resistance like 95.38 mg/kg. As both the key properties are important here they are discussed comparatively.
In the tensile strength analysis of tensile strength, control factor values were converted into mean and S/N ratio values, effectively illustrating the factors influencing tensile strength. Table 3 displays the mean and S/N ratio values for the tensile strength analysis, revealing that moulding temperature had the most significant impact, followed by fillers percentage, epoxy matrix, and compression pressure. The optimized parameters for achieving maximum tensile strength were identified as follows: 3 % fillers, 40 % epoxy matrix, 35 MPa compression pressure, and a moulding temperature of 100 °C.
Level
Means of Tensile Strength
S/N ratio for Tensile Strength
Fillers (%)
Epoxy
Compression
Moulding
Fillers (%)
Epoxy
Compression
Moulding
matrix
pressure
Temperature
matrix
pressure
temperature
(%)
(MPa)
(oC)
(%)
(MPa)
(oC)
1
173.8
178.6
174.9
169.7
44.79
45.03
44.85
44.59
2
175.8
176.4
176
176.5
44.9
44.92
44.9
44.93
3
177.5
176.3
176.6
177.3
44.98
44.92
44.94
44.97
4
178.7
174.5
178.2
182.2
45.04
44.83
45.01
45.21
Delta
4.9
4.1
3.2
12.5
0.25
0.21
0.16
0.62
Rank
2
3
4
1
2
3
4
1
Criteria
Larger is better for Tensile Strength
Level
Means of erosive wear
S/N ratio for erosive wear
1
121.7
215.2
205
264.3
−41.38
−45.89
−45.93
−47.99
2
190.4
185
212.3
226.5
−45.49
−44.93
−45.99
−46.05
3
278.3
239.6
263.4
231.8
−48.7
−46.35
−47.29
−46.59
4
341.5
292.2
251.3
209.3
−50.48
−48.86
−46.82
−45.4
Delta
219.8
107.1
58.4
55
9.1
3.93
1.36
2.6
Rank
1
2
3
4
1
2
4
3
Criteria
Smaller is better for erosive wear
In the assessment of erosive wear, a “smaller is better” criterion was adopted, and all parameter values were converted into mean and S/N ratio values. Table 4 illustrates the mean and S/N ratio values for the erosive wear analysis. Among all the parameters examined, the filler percentage exhibited the most substantial influence, followed by the epoxy matrix, moulding temperature, and compression pressure. Ultimately, the optimal parameters identified for the erosive wear analysis were as follows: 0 % fillers, 38 % epoxy matrix, 5 MPa compression pressure, and a moulding temperature of 100 °C.
Fig. 3a and b depict main effect plots for both mean values and Signal-to-Noise (S/N) ratio. It is evident from the figure that as the filler percentage increases (reaching 3 %), there is a notable enhancement in tensile strength. This trend is also observed with compression moulding pressure at 35 MPa and moulding temperature at 100 °C. In contrast, when it comes to the epoxy matrix, the lowest level (37 %) exhibits the highest tensile strength. As the percentage of epoxy matrix increases beyond this point, there is a decrease in tensile strength observed. Fig. 3c and d illustrate an interaction plot that effectively depicts the impact of various parameters on erosive wear. The plot unmistakably demonstrates that superior erosive wear performance is associated with lower values of the parameters. Notably, in this analysis, when no filler material is added, reducing the epoxy matrix content, decreasing compression moulding pressure, and increasing moulding temperature all lead to a marked reduction in wear rates, signifying a significant enhancement in erosive wear resistance.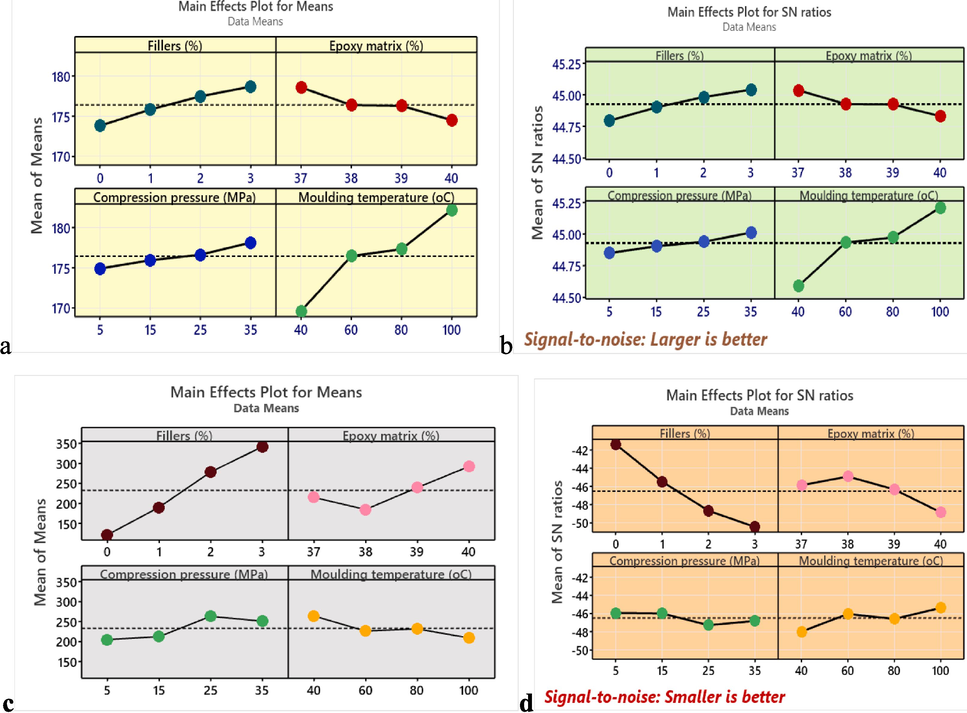
Mean and S/N ratio plots for the responses of tensile strength and erosive wear.
In Fig. 4a, the interaction plot displays the relationship between tensile strength and various parameters. It is evident from the plot that higher values of these parameters correspond to superior tensile strength. Specifically, as the percentage of filler material, compression moulding pressure, and moulding temperature increase, there is a noticeable improvement in tensile strength. Fig. 4b illustrates an interaction plot that effectively depicts the impact of various parameters on erosive wear. The plot unmistakably demonstrates that superior erosive wear performance is associated with lower values of the parameters. Notably, in this analysis, when no filler material is added, reducing the epoxy matrix content, decreasing compression moulding pressure, and increasing moulding temperature all lead to a marked reduction in wear rates, signifying a significant enhancement in erosive wear resistance.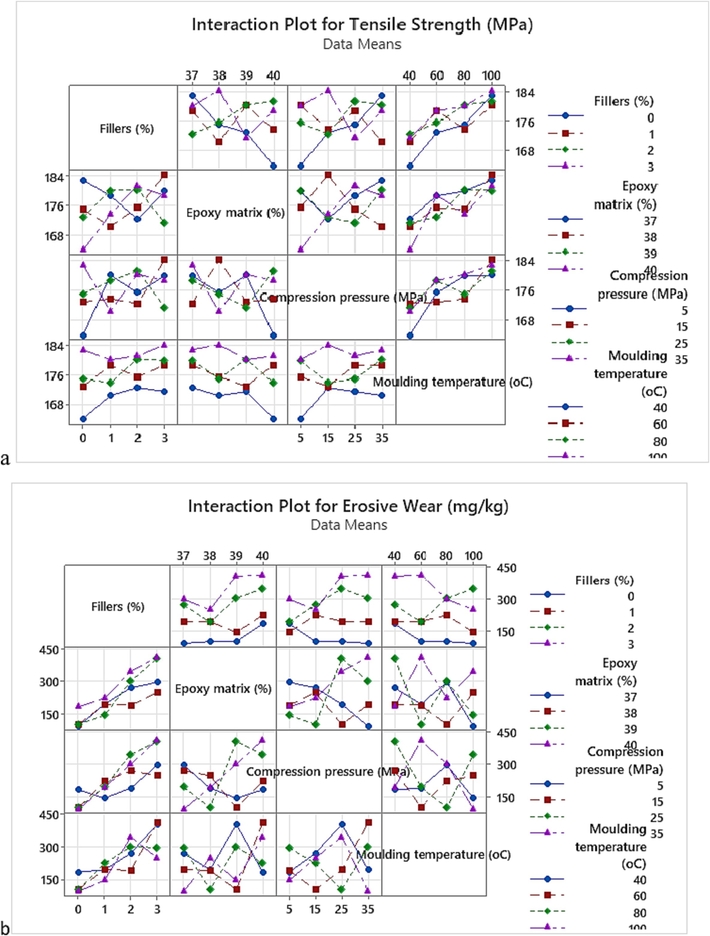
Interaction plot (a) for tensile strength (b) for Erosive wear.
The statistical significance of the control factors in the tensile strength analysis was assessed using Analysis of Variance (ANOVA) at a 95 % confidence level, and the results are presented in Table 4. In this table, the p-values for all process parameters were clearly reported. Notably, all of these p-values were found to be less than 0.05, indicating a high level of significance. This compelling evidence from the ANOVA results underscores that the selected parameters and their respective levels have a substantial influence on the tensile strength. Furthermore, when examining the percentage of contribution to the tensile strength, it becomes evident that the moulding temperature played the most significant role, accounting for 68.59 % of the variation. Following closely behind was the filler percentage at 12.43 %, the epoxy matrix at 7.03 %, and the compression pressure at 4.98 %. In the case of erosive wear, Table 4 presents the results of the Analysis of Variance (ANOVA) conducted to assess the statistical significance of the control factors in the analysis of erosive wear. This analysis was performed at a 95 % confidence level. The table includes F-values for all process parameters, which were used to determine the contribution percentage of each parameter. Importantly, all the p-values for these parameters were found to be less than 0.05, indicating a high level of significance. The ANOVA results provide strong evidence that the selected parameters and their respective levels significantly influence erosive wear. Upon closer examination of the percentage of contribution to the erosive wear analysis, it becomes clear that the Moulding temperature (oC) has the highest influence (p = 0.001) followed by the filler’s percentage (p = 0.012), epoxy matrix (p = 0.023) and compression pressure (p = 0.042). The prediction model was developed and presented to predict the tensile strength and erosive wear in Equation (1) and Equation (2) respectively.
Source
DF
Adj SS
Adj MS
F-Value
P-Value
Tensile Strength
Regression
4
401.80
100.449
36.72
0.000
Fillers (%)
1
53.69
53.694
19.63
0.001
Epoxy matrix (%)
1
30.36
30.356
11.10
0.007
Compression pressure (MPa)
1
21.53
21.528
7.87
0.017
Moulding temperature (oC)
1
296.22
296.219
108.28
0.000
Error
11
30.09
2.736
Total
15
Erosive Wear
Fillers (%)
3
54.367
18.122
26.33
0.012
Epoxy matrix (%)
3
33.440
11.147
16.20
0.023
Compression pressure (MPa)
3
22.018
7.339
10.66
0.042
Moulding temperature (oC)
3
320.002
106.667
154.98
0.001
Error
3
2.065
0.688
Total
15
431.891
Regression Equation
In Fig. 5a, all parameter values have exceeded the reference line. The moulding temperature for D has surpassed the maximum level, followed by Fillers percentage for A, Epoxy matrix percentage for B, and Compression pressure for C. Fig. 5b displays a Pareto chart that facilitates the analysis of parameter contributions in the erosive wear analysis. With the exception of the moulding temperature (D), all other parameter values have surpassed the reference line. Notably, the filler percentage for parameter A clearly exceeds the maximum level indicated by the reference line when compared to the other parameters. Following this, parameter B, representing the epoxy matrix, and parameter C, corresponding to compression pressure, also exhibit values that exceed the reference line.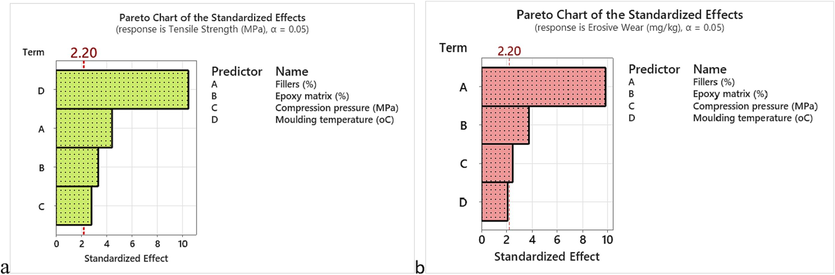
Pareto analysis (a) for Tensile strength (b) for Erosive wear.
Fig. 6a illustrates a comparative analysis between the experimental and predicted tensile strength values, revealing that the majority of the experimental results closely matched the predicted values. This suggests that the tensile tests were effectively executed, and the influence of each process parameter was evident throughout all the experimental runs. Fig. 6b illustrates a comparative analysis between the experimental and predicted erosive wear data. The analysis demonstrates that a significant portion of the experimental results closely align with the predicted values. This indicates that the erosive wear results were obtained with a high degree of accuracy, reflecting the effectiveness of the test execution. Furthermore, it is evident that each process parameter had a discernible impact on the outcomes across all experimental runs.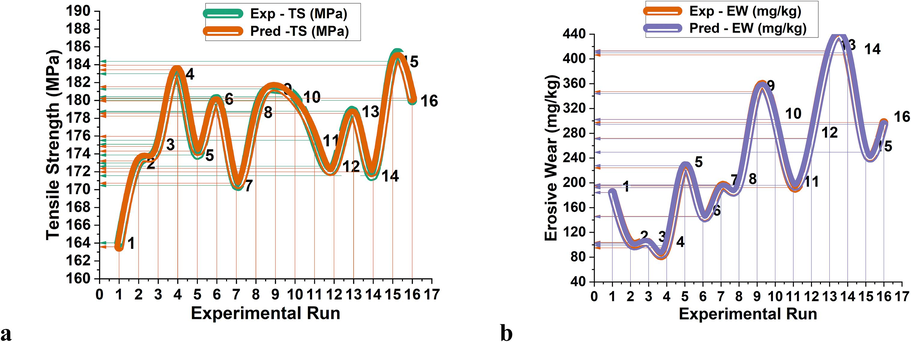
Run-wise Experimental & Predicted (a) tensile strength (b) Erosive wear.
Fig. 7 presents a 3D trajectory plot that visually depicts the influence of two key parameters, namely filler percentage and epoxy matrix percentage, on the analysis of tensile strength. In Fig. 7(a), it is evident that the highest levels of filler percentage and epoxy matrix percentage contribute to greater tensile strength. Conversely, Fig. 7(b) demonstrates that the lowest level of epoxy matrix percentage, coupled with the minimum compression pressure, results in an increase in the tensile strength of the composites. Fig. 7(c) shows that the combination of minimal compression pressure and the highest moulding temperature leads to a significantly elevated tensile strength. Finally, Fig. 7(d) illustrates that when both filler percentage and moulding temperature are at their maximum values, the composites exhibit outstanding tensile strength. Fig. 7 e to h provides a visual representation of a heat map plot that illustrates the impact of two critical parameters in the analysis of erosive wear. In Fig. 7 (e), it is evident that the composites exhibited excellent wear resistance when a minimal filler percentage and a higher epoxy matrix percentage were employed. Conversely, Fig. 7 (f) demonstrates that a lower epoxy matrix percentage and elevated compression values led to increased wear resistance. Fig. 7 (g) highlights that both compression pressure and moulding temperature were conducive to achieving good wear resistance. Furthermore, Fig. 7 (h) reveals that a higher moulding temperature, in the absence of fillers, resulted in outstanding wear resistance for the composites.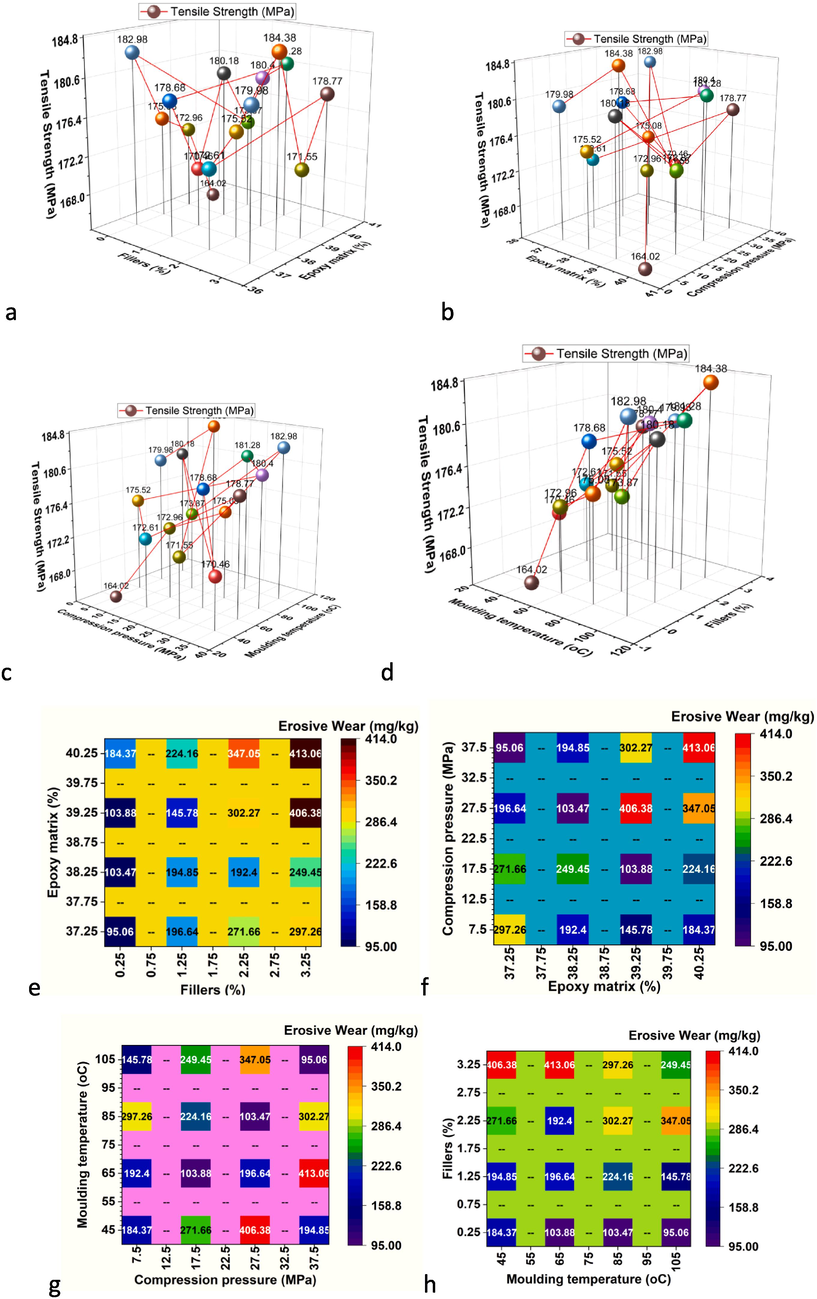
Factors Influencing analysis for Tensile strength (a) Fillers (%) Vs Epoxy matrix (%), (b) Epoxy matrix (%) Vs compression pressure, (c) Compression pressure Vs moulding temperature, (d) Moulding temperature Vs Filler (%) for Erosive wear analysis: (e) Fillers (%) Vs Epoxy matrix (%), (f) Epoxy matrix (%) Vs compression pressure, (g) Compression pressure Vs Moulding temperature, (h) Moulding temperature Vs Filler (%).
5 Conclusion
Hybrid nanocomposites were successfully fabricated using Basalt/E-Glass fabric fibers, MWCNTs/SiO2 fillers, and an epoxy matrix via hand layup and compression moulding techniques. The study yielded the following key findings:
Tensile Strength Analysis:
-
The most significant factor impacting tensile strength was the moulding temperature, followed by the filler percentage, epoxy matrix content, and compression pressure.
-
Optimal conditions for achieving maximum tensile strength were determined as follows: 3 % fillers, 40 % epoxy matrix, 35 MPa compression pressure, and a moulding temperature of 100 °C.
-
The ANOVA results highlighted the dominant role of moulding temperature, contributing to 68.59 %, followed by filler percentage at 12.43 %, epoxy matrix content at 7.03 %, and compression pressure at 4.98 %.
Erosive Wear Analysis:
-
Filler percentage exerted the most significant influence on erosive wear, followed by the epoxy matrix, moulding temperature, and compression pressure.
-
Optimal parameters for minimizing erosive wear were determined as follows: 0 % fillers, 38 % epoxy matrix, 5 MPa compression pressure, and a moulding temperature of 100 °C.
-
In the erosive wear analysis, the highest impact was attributed to the fillers percentage at 72.98 %, followed by the epoxy matrix at 10.65 %, compression pressure at 4.72 %, and moulding temperature at 3.33 %.
-
Overall, the investigation yielded promising results with a maximum tensile strength of 184.38 MPa and a minimal erosive wear rate of 95.06 mg/kg.
CRediT authorship contribution statement
V. Boobalan: Conceptualization, Writing – original draft, Writing – review & editing. T. Sathish: Conceptualization, Data curation, Investigation, Validation, Formal analysis, Methodology, Writing – original draft, Writing – review & editing. Abdullah M. Al-Enizi: Funding acquisition, Writing – review & editing. Bidhan Pandit: Software, Writing – review & editing. Manish Gupta: Visualization, Supervision, Writing – review & editing. Chander Prakash: Resources, Project administration, Writing – review & editing.
Acknowledgement
The authors extend their sincere appreciation to the Researchers Supporting Project number (RSP2024R55), King Saud University, Riyadh, Saudi Arabia for the support.
Declaration of competing interest
The authors declare that they have no known competing financial interests or personal relationships that could have appeared to influence the work reported in this paper.
References
- Comparative study of erosion wear of glass fiber/epoxy composite reinforced with Al2O3 nano and micro particles. Mat. Today Procd.. 2019;20:420-427.
- [CrossRef] [Google Scholar]
- Alshahrani, H, Arun, V.R., Prakash., 2022. Mechanical, thermal, viscoelastic and hydrophobicity behavior of complex grape stalk lignin and bamboo fiber reinforced polyester composite. Int J Biol Macromol. 223, 851–859. http://dx.doi.org/10.1016/j.ijbiomac.2022.10.272.
- Mechanical and morphological characterization of carbonized egg-shell fillers/borassus fibre reinforced polyester hybrid composites. Mater. Res. Express. 2019;6:105342
- [CrossRef] [Google Scholar]
- Bhat, V.G., Narasagoudr, S.S., Masti, S, P., Chougale, R.B., Vantamuri, A.B., Kasai, D., 2022. Development and evaluation of moringa extract incorporated chitosan/guar gum/poly (vinyl alcohol) active films for food packaging applications. Int J Biol Macromol, 200, 50–60. 10.1016/j.ijbiomac.2021.12.116..
- Chiang, C.L., Chou, H.Y., Shen, M, Y., 2020. Effect of environmental aging on mechanical properties of grapheme nano platelet/nano carbon aero gel hybrid-reinforced epoxy/carbon fiber composite laminates. Compos Part A. 130. http://dx.doi.org/10.1016/j.compositesa.2019.105718.
- Thermal and mechanical properties of bamboo fiber reinforced composites. Mater. Today Commun. 2020;23(100876):2352-4928.
- [CrossRef] [Google Scholar]
- Choudhary, M., Sharma, A., Shekhawat, D., Kiragi, V. R., Nigam, R., Patnaik, A., 2019. Parametric optimization of erosion behavior of marble dust filled aramid/epoxy hybrid composite Epoxy Hybrid Composite. Int Conf Sust Comp Sci Tech $ Mang, 2484-2490. https://doi.org/10.2139/ ssrn.3363100.
- Role of surface functionalized crystalline nano-silica on mechanical, fatigue and drop load impact damage behaviour of effective stacking sequenced e-glass fibre-reinforced epoxy resin composite. Silicon. 2021;13(3):757-766.
- [CrossRef] [Google Scholar]
- Experimental investigation of properties and aging behavior of pineapple and sisal leaf hybrid fiber-reinforced polymer composites. E-Polymers. 2023;23
- [CrossRef] [Google Scholar]
- Eayal, Awwad, K.Y., Yousif, B.F., Fallahnezhad, K., Saleh, K., Zen, X., 2021., Influence of graphene nanoplatelets on mechanical properties and adhesive wear performance of epoxy-based composites. Friction 9(4), 856–876. https://doi.org/10.1007/s40544-020-0453-5.
- Polymer composite materials: a comprehensive review. Compos. Struct.. 2021;262:113640
- [CrossRef] [Google Scholar]
- Itaconimide telechelics of polyethers, synthesis, and their impact on mechanical properties of unsaturated polyester resins. Polym. Adv. Technol.. 2021;32(4):1727-1741.
- [CrossRef] [Google Scholar]
- Jiang, L., F.U. J., Liu, L., Du, P., 2021. Wear and thermal behavior of basalt fiber reinforced rice husk/polyvinyl chloride composites. J Appl Polym Sci, 138, 1–7. https://doi.org/10.1002/app.50094.
- Jose, S., Shanumon, P, S., Paul, A., 2022. Physico-mechanical, thermal, morphological, and aging characteristics of green hybrid composites prepared from wool-sisal and wool-palf with natural rubber. Polymers 14. https://doi.org/10.3390/polym14224882.
- Kim, J, S., Yoon, K.H., Lee, Y, S., Han, J, H., 2021. Mechanical properties and thermal conductivity of epoxy composites containing aluminum-exfoliated graphite nanoplatelets hybrid powder. Macromol Res 29(3), 252–256. http://dx.doi.org/10.1007/s13233-021-9032-5.
- Recent advancements of plant-based natural fiber–reinforced composites and their applications. Compos. B Eng.. 2020;200:108254
- [CrossRef] [Google Scholar]
- Mouad Chakkour, MO., Moussa IK., Balli M. (2023) Tarak Ben Zineb, Effects of humidity conditions on the physical, morphological and mechanical properties of bamboo fibers composites. Ind Crops Products 192:116085. http://dx.doi.org/10.1016/j.indcrop.2022.116085.
- Effect of altitude on the mechanical strength of Grewia optiva fiber in Garhwal Himalaya. India J. Nat. Fibers. 2021;19:6638-6647.
- [CrossRef] [Google Scholar]
- Optimization of dry sliding wear behavior of epoxy nano composites under different conditions. Mater. Res. Express. 2022;9
- [CrossRef] [Google Scholar]
- Natrayan, L., Kumar, P.V.A., Baskara., Sethupathy, S., 2022. Effect of nano TiO2 filler addition on mechanical properties of bamboo/polyester hybrid composites and parameters optimized using Grey Taguchi method. Adsorpt Sci Technol 2022, 11. https://doi.org/10.1155/2022/6768900.
- A review on the recent advances on improving the properties of epoxy nanocomposites for thermal, mechanical, and tribological applications: challenges and recommendations. Polym.-Plast. Technol. Mater. 2021
- [CrossRef] [Google Scholar]
- Micro- and nanocellulose in polymer composite materials: a review. Polymers. 2021;13:231.
- [CrossRef] [Google Scholar]
- Investigation of erosion behaviour of an iron-mud filled glass-fibre epoxy hybrid composite. Bull. Mater. Sci.. 2019;42:217.
- [CrossRef] [Google Scholar]
- Experimental investigation on mechanical and wear properties of nano clay epoxy composites. J. Mater. Res. Technol.. 2020;9(4):9108-9116.
- [CrossRef] [Google Scholar]
- Fabrication of waste bagasse fiber-reinforced epoxy composites: study of physical, mechanical, and erosion properties. Polym. Compos. 2019
- [CrossRef] [Google Scholar]
- Effect of silica nanoparticles on physical, mechanical, and wear properties of natural fiber reinforced polymer composites. Polym. Compos.. 2021;42:2396-2407.
- [CrossRef] [Google Scholar]
- Influence of SiC micro and nano particles on tribological, water absorption and mechanical properties of basalt bidirectional mat/vinyl ester composites. Compos. Sci. Technol.. 2021;219:109210
- [CrossRef] [Google Scholar]
- Reciprocating friction and wear performances of nanometer sized-TiO2 filled epoxy composites. Polym. Compos.. 2021;42:2061-2072.
- [CrossRef] [Google Scholar]
- Experimental investigation of high filler loading of SiO2 on the mechanical and dynamic mechanical analysis of natural PALF fibre-based hybrid composite. Silicon 2023
- [CrossRef] [Google Scholar]
- Yao X, Raine TP., Liu M., Zakaria M, Kinloch IA., Bissett MA. (2021) Effect of graphene nanoplatelets on the mechanical and gas barrier properties of woven carbon fibre/epoxy composites. J Mater Sci. 56, https://link.springer.com/article/10.1007%2Fs10853-021-06467-z.
Appendix A
Supplementary material
Supplementary data to this article can be found online at https://doi.org/10.1016/j.jksus.2024.103148.
Appendix A
Supplementary material
The following are the Supplementary data to this article:


