

Translate this page into:
Evaluation of GC × GC-TOF-MS untargeted metabolomics, cytotoxicity and antimicrobial activity of leaf extracts of Artemisia afra (Jacq.) purchased from three local vendors
⁎Corresponding author. oyinolaokun@yahoo.com (O.O. Olaokun)
-
Received: ,
Accepted: ,
This article was originally published by Elsevier and was migrated to Scientific Scholar after the change of Publisher.
Peer review under responsibility of King Saud University.
Abstract
Objectives
As microorganisms are developing resistance to therapies, the search for potent antimicrobial compounds continues. The potential of detecting new compound(s) with antimicrobial activities from extracts of Artemisia afra, a South African plant frequently used for the treatment of diseases and widely traded in the market was explored. A. afra was purchased from three vendors. Methods: The dried leaf powder extracted separately with butanol, chloroform, and water were evaluated for cytotoxicity and antimicrobial activity using standard methods, and characterized for antimicrobial compounds using untargeted metabolomics. Results and Conclusion: All the extracts exhibited antibacterial activity. Butanol extract of vendor B sample was the most active against P. aeruginosa while the antibacterial activity of water extract of vendor A against S. aureus, E. coli, and E. faecalis was similar to butanol extract of vendor B. All other extracts were less cytotoxic than the chloroform extract of vendor B (LC50 value = 414.56 ± 4.81 µg/mL). GC × GC-TOF-MS detected 436 compounds, 280 identifications were confirmed with 34 having known antimicrobial properties. The concentrations of compounds varied among the vendors’ samples with the highest in all samples and particularly in samples from vendor C (14.85 µg/mg) being Bicyclo[2.2.1]heptan-2-one 1,7,7-trimethyl-(1S)-, an antimicrobial compound. While two compounds were undetectable in vendor A sample, four were undetected in vendor C sample and eleven compounds in vendor B sample. The antibacterial activity of extracts could not be related to the metabolites variations and concentration. The A. afra species purchased from vendors from the traditional medicinal market showed antibacterial potential. To our knowledge, this was the first study to report the metabolomics of A. afra in respect to antimicrobial activities.
Keywords
Artemisia afra
Cytotoxicity
GC×GC-TOF-MS
Untargeted metabolomics
Antimicrobial compounds

1 Introduction
Emerging infectious diseases are increasing probably due to travel, overcrowding caused by urbanization and inadequate healthcare systems leading to new interactions between human beings, and animals as well as other diseases (Alirol et al., 2011; Muleya et al., 2014). Therefore, resolving the challenges associated with infectious diseases is of utmost importance. Man has been able to utilize the natural resources in the environment (the flora and fauna) to alleviate pain and improve health (Patil et al., 2011). The exploration of natural resources has led to the discovery of medicinal plants with diverse health benefits. Consequently, medicinal plants are the target for investigation in drug discovery as they are the primary sources of bioactive phytochemicals (Agbor and Ngogang, 2005; McGaw et al., 2008; Singh et al., 2016). An estimated 80% of the population of Asian and African as well as an estimated 65% of the world’s population depend on traditional herbal remedy to cure and prevent infectious ailments, and chronic diseases (Patil et al., 2011). Several studies in South Africa have documented traditional plants with therapeutic benefits against conditions associated with coughing, respiratory ailments and fever (McGaw et al., 2008; Van Wyk, 2011; Mahomoodally, 2013). Therefore, Artemisia afra (Jacq.), a commonly used plant is explored as a possible source of phytochemicals with high potency against microorganism associated infectious diseases.
A. afra (Jacq.) commonly called African wormwood is a popular medicinal plant with wide application in many parts of Africa (Van Wyk, 2011). It is used traditionally to cure various ailments or assuage the pain caused by sicknesses such as common colds, coughs, sore throat, influenza, asthma (van Wyk and Wink, 2004; Patil et al., 2011; More et al., 2012; Hübsch et al., 2014). The traditional use of A. afra as an anti-infectious remedy was studied as potential antimicrobial activities (McGaw et al., 2008; More et al., 2012; Martini et al., 2020). A. afra was reported to have a broad spectrum of inhibitory activity against microorganisms (Muyima et al., 2002). It exhibited antifungal properties (Abad et al., 2012) as well as antibacterial potency against a range of Gram-positive and Gram-negative bacteria (Jäger, 2003; More et al., 2012; Martini et al., 2020). Other pharmacological investigations demonstrated A. afra to possess spasmolytic, antidepressant, cardiovascular and antioxidant activity (More et al., 2012).
Although many rural communities rely on commercially sold medicinal plants for their primary health care, investigations have often focused on extracts of medicinal plants collected from known sources and processed in accordance with standard guidelines. There is a dearth of information on the therapeutic effectiveness of A. afra sold in the traditional herbal markets. To our knowledge, this is the first study to investigate the activity of A. afra purchased from the traditional market. The challenge associated with extracts of medicinal plants of unknown sources includes quality of the plant materials and post-harvest handling. This may compromise the secondary metabolite constituents and invariably the efficacy, and safety. Metabolomics is the metabolic profiling of metabolites in a biological system including plants under specific conditions (Satheeshkumar et al., 2012; Mukherjee et al., 2016). This approach has been utilized in comprehensive profiling of secondary metabolites of plant extracts and applied for quality control of plant materials, and discovery of lead compound(s) (Satheeshkumar et al., 2012; Mukherjee et al., 2016). Untargeted metabolomics attempt to profile all the known and unknown metabolites of plant extracts (Cai et al., 2015). The techniques used for metabolic profiling of extracts of plants includes spectral (nuclear magnetic resonance (NMR), infrared (IR), ultraviolet–visible (UV), mass spectrometry (MS)), chromatographic techniques (gas chromatography (GC), high-performance liquid chromatography (HPLC), capillary electrophoresis (CE)) or their hyphenated techniques (GC–MS) or (LC-NMR) (Satheeshkumar et al., 2012). Therefore the first objective of this research was to investigate the antimicrobial and cytotoxic activity of the extracts of A. afra purchased from different vendors in the traditional medicinal plant market. The second was to characterize and compare the phytochemicals, and antimicrobial compounds of the plant extracts using 2-dimensional untargeted GC × GC-TOFMS (gas chromatography/time-of-flight mass spectrometry) metabolomics analysis.
2 Material and methods
2.1 Reagent and chemical
Chloroform and butanol were from Merck (South Africa), Gentamycin (Virbac, South Africa), doxorubicin (Pfizer, South Africa), Mueller-Hinton agar, p-iodonitrotetrazolium violet, dimethyl sulfoxide, 3-(4,5-dimethylthiazol-2-yl)-2,5-diphenyltetrazolium bromide, Minimum essential medium growth medium, phosphate buffered saline, 3-Phenylbutyric acid, methoxyamine hydrochloride N,O-Bis(trimethylsilyl)trifluoroacetamide (BSTFA), trimethylchlorosilane (TMCS) were from Sigma Aldrich (South Africa). All organic solvents used for the GC × GC analysis were ultra-pure Burdick & Jackson brands (Honeywell International Inc., Muskegon, MI, USA).
2.2 Collection of plants
Samples of the plant Artemisia afra (Jacq.) were purchased at the Soshanguvhe Muthi-Market, Pretoria (GPS coordinates −25° 31′ 22.19″ S and 28° 06′ 19.20″ E), South Africa from three different vendors designated as vendor A, B and C. These were identified and authenticated at SANBI (South African National Biodiversity Institute). Sample specimens for the plants were deposited to the Department of Biology, Sefako Makgatho Health Sciences University under the code: vendor A (SMU-MMC001), vendor B (SMU-MMC002), and vendor C (SMU-MMC003). The dried leaves were ground to powder and stored in air amber bottles until needed for the extraction process.
2.3 Extraction of plants
The powdered leaves (3 g) from each vendor were separately extracted with 30 mL each of solvent (chloroform, butanol and water) in a 50 mL polyester centrifuge tube on a platform shaker for 30 min. The tubes were centrifuged for 10 min at 70 rpm and the tubes were left overnight. The supernatants were filtered using Whatman No. 1 filter papers into pre-weighed glass containers and were allowed to evaporate to a constant weight to calculate the yield.
2.4 Antibacterial activity assay
Four bacterial strains available during the period of the study were used; two Gram-positive bacteria [Staphylococcus aureus (S. aureus) (ATCC 29213) and Enterococcus faecalis (E. faecalis) (ATCC 29212)] and two Gram-negative bacteria [Escherichia coli (E. coli) (ATCC 25922) and Pseudomonas aeruginosa (P. aeruginosa) (ATCC27853)]. The bacterial strains were maintained on Mueller-Hinton (MH) agar. The minimum inhibitory concentrations (MIC) of plant extracts were determined using the broth microdilution method in 96-well microtitre plates (Jadaun et al., 2007; Makhafola et al., 2019). The lowest concentration containing clear wells was measured as the MIC values.
2.5 Cytotoxicity assay using 3-(4,5-dimethylthiazol-2-yl)-2,5-diphenyltetrazolium bromide (MTT)
Cultured Vero cells were harvested, counted and seeded at a density of 1 × 10⁶ cells/mL Minimum essential medium growth medium (100 µl) into each well of 96-well plates and treated using the method described by Olaokun et al. (2017). The extracts of A. afra were tested for cytotoxicity, using the Vero cell lines by 3-(4,5-dimethylthiazol-2-yl)-2,5-diphenyltetrazolium bromide (MTT) assay (Mosmann, 1983). The lethal concentration values (LC50) calculated from a plot of the log of concentration versus average absorbance represents the concentration of plant extract that resulted in a 50% reduction of absorbance in comparison to the untreated cells.
2.6 GC × GC-TOFMS (gas chromatography/time-of-flight mass spectrometry)
The analysis was performed using the comprehensive two-dimensional gas chromatography (GC × GC) (Pegasus 4D GC × GC-TOFMS Leco Corporation, St. Joseph, MI, USA) consisting of a GC system (7890A series, Agilent, Atlanta, GA) coupled to a time of flight mass spectrometer (TOFMS) (Leco Corporation, St. Joseph, MI, USA). The system is equipped with a Gerstel Multi-Purpose Sampler (MPS) (Gerstel GmbH & co. KG, Eberhard-Gerstel- Platz 1, D-45473 Mülheim an der Ruhr) and a cryogenic cooler. The temperature of the primary GC oven was automated to start at 70 °C for 2 min, thereafter to increase at 4 °C/min and finally held at 300 °C for 2 min. The temperature of the secondary GC oven programmed at 85 °C for 2 min was to increase at 4.5 °C/min and finally to 300 °C, at which it was held for 4.5 min. The modulator automated with a starting temperature of 100 °C for 2 min was increased by 4.0 °C/min to a final temperature of 310 °C where it was sustained for 12 min.
2.6.1 Metabolome extraction method
A single-phase extraction method was utilized for the test samples and the two quality control (QC) samples (approx. 50 mg each). To each sample was added 50 µl of internal standard (3-Phenylbutyric acid 50 ppm). Thereafter the extraction solution mixture (1 mL) comprising of chloroform, methanol and water (1:3:1), and 3 mm tungsten carbide bead was added. The sample mixtures were shaken in a vibration mill at 30 Hz for 10 min and centrifuged at 12,000 × g for 5 min. Thereafter, 800 µl of the supernatant was dispensed into a GC tube and evaporated to dryness under a stream of nitrogen at 37 °C. For derivatization purposes, each dried sample extract was incubated at 60 °C for 60 min after the addition of 50 μl methoxyamine HCl (150 mg/10 mL), and again for 60 min at 40 °C after adding 40 μl BSTFA (N,O-Bis(trimethylsilyl)trifluoroacetamide) + 1% TMCS (trimethylchlorosilane). The derivatized sample was then centrifuged for 5 min at 2000 × g and the supernatant was transferred to a 0.1 mL insert in a GC–MS sample vial which was capped prior to GC × GC-TOFMS analysis.
2.6.2 Data processing information and peak identification
ChromaTOF software version 4.71 (Leco Corporation, St. Joseph, MI, USA) was utilized for data processing; for peak finding and mass spectral deconvolution. By employing the mass fragmentation patterns produced by the MS, combined with their corresponding GC retention times, the identities of these peaks were resolved by matching it with commercially available NIST spectral libraries (mainlib, replib).
2.7 Statistical analysis
All the assays were executed in three replicates and the results were expressed as mean ± standard deviation (SD). Data were analysed by one-way analysis of variance (ANOVA) and by a two-tailed t-test after Bonferroni where significant difference was found using the Microsoft Excel 2010 statistical package. The p values less than 0.05 were considered statistically significant.
3 Result
3.1 Extraction of plants
The average percentage yield of extractable materials from the dried powdered leaves of A. afra is presented in Table 1. Compared to other solvents chloroform was an efficient solvent for the extraction of phytochemicals from A. afra. The chloroform extract of Vendor B’s sample had the highest yield (2.65 ± 0.34%). The percentage extraction yield of the water extracts was not different from those of butanol extracts. Yield calculated as mean ± standard deviation of mean of three sets of extractions.
Artemisia afra
Solvents
Water
Butanol
Chloroform
Vendor A
1.02 ± 1.65
1.06 ± 0.5
2.10 ± 0.25
Vendor B
1.08 ± 0.45
1.13 ± 0.04
2.65 ± 0.34
Vendor C
1.05 ± 0.82
1.35 ± 0.02
2.09 ± 0.46
3.2 Antimicrobial activity assays
The inhibition of the activity of selected bacterial strains by the chloroform, butanol, and water extracts of A. afra reported as MIC values is presented in Table 2. All the extracts exhibited antibacterial activity. There were no trends in the antibacterial activity of all the extracts against the four bacteria strains. The butanol extracts of plants of all three vendors strongly inhibited P. aeruginosa having the lowest MIC values and the sample from vendor B (4.82 ± 0.39 μg/mL) was the strongest. No significant difference (p < 0.05) was found between the antibacterial activity of the water extract of vendor A and butanol extracts from vendor B against S. aureus, E. coli, and E. faecalis. Gentamicin (positive control) MIC = 0.01 ± 0.00 μg/mL.
Antibacterial activity (MIC)
Plant extracts
Bacterial strains
E. coli
E. faecalis
P. aeruginosa
S. aureus
Vendor A
Water
4.42 ± 1.16
4.42 ± 0.16
9.88 ± 0.43
4.49 ± 0.38
Butanol
5.21 ± 1.80
8.85 ± 1.81
6.25 ± 0.01
5.21 ± 0.82
Chloroform
8.33 ± 0.95
4.69 ± 1.61
6.25 ± 0.00
4.69 ± 0.71
Vendor B
Water
5.20 ± 0.02
4.89 ± 0.13
6.07 ± 0.56
6.92 ± 0.22
Butanol
4.03 ± 1.03
4.09 ± 1.04
4.82 ± 0.39
4.95 ± 0.45
Chloroform
5.30 ± 0.06
4.29 ± 1.01
8.80 ± 0.32
6.34 ± 0.86
Vendor C
Water
8.28 ± 1.07
4.75 ± 0.12
8.96 ± 0.46
6.39 ± 0.75
Butanol
5.82 ± 0.58
6.32 ± 1.56
7.28 ± 0.23
6.22 ± 0.82
Chloroform
5.29 ± 1.06
6.28 ± 1.07
8.25 ± 0.45
9.05 ± 0.45
3.3 Cytotoxicity assay against Vero cells
The chloroform, butanol, and water extracts of A. afra from all the vendors were less cytotoxic against Vero monkey kidney cells than doxorubicin, the positive control (Fig. 1). All the extracts exhibited relatively low cytotoxic effect against the Vero cells with LC50 value ˃500 µg/mL with the exception of the chloroform extract of A. afra purchased from vendor B having the LC50 value of 414.56 ± 4.81 µg/mL. The positive control doxorubicin was very cytotoxic exhibiting a high LC50 value of 57.83 ± 3.02 µg/mL.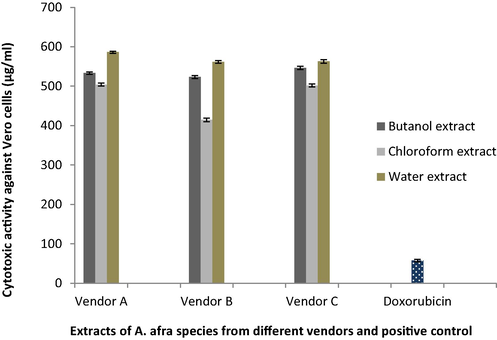
Cytotoxic effect of A. afra extracts purchased from three vendors (A, B, C) and positive control (doxorubicin) against Vero monkey kidney cell lines expressed in comparison to the untreated control cells ± standard error of mean.
3.4 Untargeted GC × GC-TOFMS metabolites profiles analysis of butanol extracts
GC × GC-TOFMS analysis was conducted to identify and quantify all the metabolites composition of the butanol extracts of A. afra. The classical total ion chromatograms of the extracts of A. afra from each of the vendors measured by GC × GC-TOFMS are presented in Fig. 2. In total, 22,293 ion features were measured across all three samples and translating to the identification of 436 compounds (Supplementary Table) using the automated data processing software (Progenesis QI). The identity of 280 compounds were confirmed with 34 of them already demonstrated to exhibit antimicrobial properties, using the in-house database containing authenticated standards (Supplementary Table and Table 3). The extracts of A. afra samples from the three vendors (A, B, C) showed variations of compounds in respect to constituents and quantity. The most abundant compounds were Bicyclo[2.2.1]heptan-2-one 1,7,7-trimethyl-(1S)- (14.85 µg/mg, 13.38 µg/mg, and 12.01 µg/mg) and 3-Penten-2-one 3,4-dimethyl- (4.23 µg/mg, 4.13 µg/mg, and 3.60 µg/mg) respectively for vendor C, vendor A, and vendor B samples in decreasing order (Table 3). The concentration of Myo-Inositol 4-C-methyl- was 3.26 µg/mg, 2.56 µg/mg, and 2.48 µg/mg for vendor B, vendor C, and vendor A samples in decreasing order. The sample from vendor A contained more compounds while those from vendor B contained the least amount of compounds (including identified and unidentified compounds) (Supplementary Table). While two compounds were below detectable limits for vendor A sample, four were undetected in vendor C sample and eleven compounds were below detectable limits in vendor B samples. Glycerine and 2H-Tetrazole −2-methyl- were among the compounds not detected in the samples from vendors B and C. Internal standard added: 50 µl (50 µg/mL); Samples: 2.5 µg added per sample. Relative concentrations of the metabolites were calculated as: detected area of metabolite/detected area of internal standards × 2.5 µg. Compound name were identified using in-house mass spectral libraries (NIST). Key: RT: Retention Time, s: seconds, ***Compounds with highest concentration (12–15 µg/mg sample), **Compounds with second highest concentration (2.4–5.0 µg/mg sample), *Compound with third highest concentration (0.85–2.0 µg/mg sample)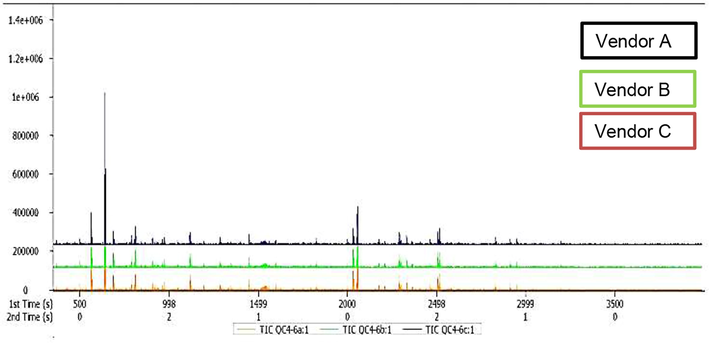
Total ion chromatograms (TIC) of the butanol extracts of A. afra species from three vendors (A, B, C) measured by GC × GC-TOFMS.
S/N
Sample name
Mass
Mean RT (s)
A. afra from vendor A (µg/mg sample)
A. afra from vendor B (µg/mg sample)
A. afra from vendor C (µg/mg sample)
Metabolite name
1
3,3,6-Trimethyl-1,4-heptadien-6-ol
59
365
0.368
0.320
0.383
2
Glycerin
61
371
0.288
0
0
3
2H-Tetrazole, 2-methyl-
56
398
0.049
0
0
4
o-Cymene
119
419
0.303
0.187
0.189
5
Pyridine*
52
417.5
0
2.041
1.698
6
3-Penten-2-one, 3,4-dimethyl-
69
560
4.126
3.597
4.234
7
Bicyclo[3.1.0]hexan-3-one, 4-methyl-1-(1-methylethyl)-*
81
560
0.888
0
1.062
8
Bicyclo[3.1.1]heptan-3-ol, 6,6-dimethyl-2-methylene-, [1S-(1à,3à,5à)]-
92
626
0.076
0.062
0.080
9
Bicyclo[2.2.1]heptan-2-one, 1,7,7-trimethyl-, (1S)-***
95
638
13.381
12.009
14.853
10
7-Octen-2-ol, 2-methyl-6-methylene-
59
680
0.067
0
0.072
11
2-(1-Cyclopent-1-enyl-1-methylethyl)cyclopentanone
109
683
0.033
0
0.063
12
p-Mentha-1,5-dien-8-ol
59
731
0.046
0
0.042
13
2-Hexanone, 3-methyl-
72
761
0.236
0.241
0.261
14
Borneol, trimethylsilyl ether*
95
785
1.056
0.943
1.148
15
Butane, 1,1-dibutoxy-
57
839
0.410
0.298
0.372
16
Glycerol, tris(trimethylsilyl) ether
73
884
0.360
0.319
0.321
17
Bicyclo[2.2.1]heptane-2-carboxylic acid, 3,3-dimethyl-
67
959
0.320
0.314
0.309
18
Ethanedioic acid, dibutyl ester
57
1043
0.278
0.175
0.257
19
5-Hepten-2-one, 6-methyl-*
108
1118
0.926
0.861
0.941
20
Bicyclo[3.2.0]heptan-2-one, 5-formylmethyl-6-hydroxy-3,3-dimethyl-6-vinyl-
107
1127
0.019
0.018
0.028
21
Binapacryl
83
1136
0.187
0.168
0.183
22
Acetophenone, 4′-hydroxy-
121
1196
0.750
0.759
0.727
23
D-Allose*
60
1280
1.844
2.076
1.842
24
trans-calamenene
159
1349
0.282
0.222
0.241
25
(-)-Spathulenol
91
1445
0.298
0.325
0.304
26
Benzoic acid, 4-[(trimethylsilyl)oxy]-, trimethylsilyl ester
73
1526
0.134
0.100
0.128
27
Myo-Inositol, 4-C-methyl-**
87
1531
2.487
3.261
2.563
28
Isoaromadendrene epoxide
71
1820
0.164
0.185
0.186
29
cis-Z-à-Bisabolene epoxide
55
1829
0.059
0.029
0
30
Scopoletin*
192
2031
1.690
1.865
1.743
31
n-Hexadecanoic acid**
60
2053
2.456
2.467
2.418
32
5-Benzofuranacetic acid, 6-ethenyl-2,4,5,6,7,7a-hexahydro-3,6-dimethyl-à-methylene-2-oxo-, methyl ester*
120
2516
1.151
1.344
1.330
33
Ingol 12-acetate
111
2831
0.539
0.530
0.558
34
1-Cyclohexyl-5-(4-methoxy-benzyl)-pyrimidine-2,4,6(1H,3H,5H)-trione
121
3098
0.250
0.260
0.255
4 Discussion
Despite advances in technology and science in the battle against diseases, there is an increased emergence of threatening infectious diseases, as result of an increase in the transient attribute of viral, fungal, bacterial, and parasitic diseases (Cohen, 1998). The search for potent antimicrobial compounds continues and medicinal plants are seen an alternative for new chemical entity because they contain variety of secondary metabolites. Medicinal plants such as A. afra utilized in folk medicine for curing and preventing diverse diseases related to infections was selected for investigation and there is a dearth of study on the efficacy of A. afra traded in the traditional market. The scientific basis of evidence-based medicine for herbal remedies is still very poor, especially for those traded in the traditional medicinal plant market. Investigation of parameters such as the quality of plant materials, standardization of secondary metabolites, safety and efficacy is vital for plants from unidentifiable sources. Thus, this study explored metabolomics analysis to assess the extracts of A. afra purchased from three vendors in South Africa.
Untargeted GC × GC-TOFMS metabolomics analysis comprehensively highlighted the variations of chemical constituents of the extracts of A. afra from the three vendors. The differences may be due to either the environmental influence on the chemical profile or genetic mutations which increase genetic diversity or geographic influences (Viljoen et al., 2006). The environment influence is minimal on chemical composition of plants except when treated with insecticide (Arundale et al., 2015). While a total of 436 compounds were detected, none of the A. afra extracts possessed all the compounds. The extract of sample from vendor A had the highest amount of the chemical composition while extract from sample from vendor B had the lowest amount of chemicals composition. Some authors using NMR spectroscopic analysis to identify the secondary metabolites of Rhodiola rosea rhizome extracts from three geographic areas, found differences in the sample composition of the plants (Satheeshkumar et al., 2012). Also, Chatterjee et al. (2010) with NMR, HPLC and GC–MS, identified 62 metabolites from the leaves and 48 from the roots of Withania somnifera (Ashwagandha) and found only twenty-nine compounds were common to the two tissues. Therefore metabolomics fingerprinting may be valuable for the evaluation of quality of medicinal plants (Satheeshkumar et al., 2012).
The safety of medicinal plants is very critical because plant extracts have been shown to have low lethal concentration (LC50 ≤ 20 μg/mL) which is very cytotoxic (Zirihi et al., 2005). All the extracts of A. afra were relatively non-cytotoxic against Vero cell (LC50 ≥ 414.56 ± 4.81 µg/mL) than doxorubicin, the positive control. This result was different from those of authors (Mativandlela et al., 2008), who showed that the crude ethanol extract of A. afra (LC50 value of 113.0 ± 2.05 µg/mL) was cytotoxic against Vero cells. The solvent of extraction may be responsible for this because it had been demonstrated that a sesquiterpene lactone isolated from A. afra ethanol extract was cytotoxic (Jenett-Siems et al., 2002).
Based on the acceptable MIC values ≤ 1.0 mg/mL (Ndhlala et al., 2009); all the extracts of A. afra were potent inhibitors against all the bacterial strains. All the butanol extracts of the plants strongly inhibited P. aeruginosa while the antibacterial activity of water extract of vendor A was not significantly different from those of butanol extract of vendor B for the other bacterial strains examined. This indicates that the activity of the A. afra extracts probably resides in the polar solvent. Although metabolomics analysis detected more antimicrobial compounds in the sample from vendor A (33) than those from vendor B (28) and C (31), the lack of significant difference between the antimicrobial activity of water extract of vendor A and butanol extract of vendor B cannot be clearly understood with the metabolomics profiling. Neither can the superior antimicrobial activity of butanol extract of vendor B sample against P. aeruginosa be explained. However, about eight antimicrobial compounds in relatively high concentrations were identified in all the vendors’ samples (Table 3) including Bicyclo[2.2.1]heptan-2-one 1,7,7-trimethyl-(1S)- (Al-Marzoqi et al., 2015) with the highest concentration in the three samples, followed by Myo-Inositol, 4-C-methyl (Gaitonde and Ramesh, 2018), n-Hexadecanoic acid (Mehdi, et al., 2021) and Scopoletin (More et al., 2012). Probably these antimicrobial compounds and perhaps some other compounds are exhibiting numerous modes of actions which have synergistic antimicrobial potentials irrespective of compound composition, and quantity within the plant extract.
5 Conclusion
The study has shown that metabolomics analyses are vital for the quality evaluation of medicinal plants for the therapeutic benefit of the consumers. The chemical composition of medicinal plants, efficacy and safety may be dependent on the plants’ growth, the climate and soil, the collection time, and method of drying. The profiling of metabolites is also dependent of the sensitivity of the analytical methods used for empirical and numerical assessment of the numerous plants phytochemicals. All the A. afra species purchased from the three vendors in the traditional medicine market has been shown to possess potential antibacterial activity. Although no relationship was found between the chemical constituents of A. afra extracts purchased from the vendors and the antibacterial activity, none of the extracts were cytotoxic.
Acknowledgments
Sefako Makgatho Health Sciences University provided the University Research Grant utilised for this study. Mr M.T. Olivier assisted in conducting the anti-bacterial assays
Declaration of Competing Interest
The authors declare that they have no known competing financial interests or personal relationships that could have appeared to influence the work reported in this paper.
References
- The Artemisia L. genus: A review of bioactive essential oils. Molecules. 2012;17(3):2542-2566.
- [Google Scholar]
- Urbanisation and infectious diseases in a globalised world. Lancet Infect. Dis.. 2011;11:131-141.
- [Google Scholar]
- Analysis of bioactive chemical components of two medicinal plants (Coriandrum sativum and Melia azedarach) leaves using gas chromatography-mass spectrometry (GC-MS) Afr. J. Biotechnol.. 2015;14(40):2812-2830.
- [Google Scholar]
- Environment has little effect on biomass biochemical composition of Miscanthus × giganteus Across Soil Types, Nitrogen Fertilization, and Times of Harvest. Bioenergy Res.. 2015;8:1636-1646.
- [Google Scholar]
- An integrated targeted metabolomic platform for high-throughput metabolite profiling and automated data processing. Metabolomics. 2015;11(6):1575-1586.
- [Google Scholar]
- Comprehensive metabolic fingerprinting of Withania somnifera leaf and root extracts. Phytochemistry. 2010;71:1085-1094.
- [Google Scholar]
- Resurgent and emergent disease in a changing world. Br. Med. Bull.. 1998;54:523-532.
- [Google Scholar]
- Gaitonde, S. S., and Ramesh, R. 2018. Screening plant products for Ralstonia solanacearum inhibition and characterization of antibacterial compounds in Garcinia indica and Tamarindus indica. Proceedings of the National Academy of Sciences, India Section B: Biological Sciences, 88(1), 265-276.
- Interactive antimicrobial and toxicity profiles of conventional antimicrobials with Southern African medicinal plants. S. Afr. J. Bot.. 2014;93:185-197.
- [Google Scholar]
- Determination of ethambutol MICs for Mycobacterium tuberculosis and Mycobacterium avium isolates by resazurin microtitre assay. J. Antimicrob. Chemother.. 2007;60(1):152-155.
- [Google Scholar]
- Evaluation of antibacterial activity of traditionally prepared South African remedies for infections. S. Afr. J. Bot.. 2003;69(4):595-598.
- [Google Scholar]
- Cytotoxic constituents from Exostema mexicanum and Artemisia afra, two traditionally used plant remedies. Pharmazie. 2002;57:351-352.
- [Google Scholar]
- Traditional medicines in Africa: an appraisal of ten potent African medicinal plants. Evidence-Based Complementary Alternative Med. 2013:617-659.
- [Google Scholar]
- Cytotoxic and antibacterial activity of selected medicinal plants used in south african traditional medicine. Asian J. Chem.. 2019;31(11):2623-2627.
- [Google Scholar]
- Artemisia annua and Artemisia afra extracts exhibit strong bactericidal activity against Mycobacterium tuberculosis. J. Ethnopharmacol.. 2020;262:113191
- [Google Scholar]
- Activity against Mycobacterium smegmatis and M. tuberculosis by extract of South African medicinal plants. Phytother. Res.. 2008;22:841-845.
- [Google Scholar]
- The potential of South African plants against Mycobacterium infections. J. Ethnopharmacol.. 2008;119:482-500.
- [Google Scholar]
- Analysis of bioactive chemical compounds of leaves extracts from tamarindus indica using FT-IR and GC-MS Spectroscopy. Asian J. Res. Biochem. 2021:22-34.
- [Google Scholar]
- More, G., Lall, N., Hussein, A., and Tshikalange, T. E. 2012. Antimicrobial constituents of Artemisia afra Jacq. ex Willd. against periodontal pathogens. Evidence-Based Complementary and Alternative Medicine, 2012
- Rapid colorimetric assay for cellular growth and survival: Application to proliferation and cytotoxicity assays. J. Immunol. Methods. 1983;65(1–2):55-63.
- [Google Scholar]
- Metabolomics of medicinal plants–a versatile tool for standardization of herbal products and quality evaluation of Ayurvedic formulations. Curr. Sci. 2016:1624-1630.
- [Google Scholar]
- Evaluation of anti-microbial, anti-inflammatory and anti-oxidative properties Artemisia afra, Gunnera perpensa and Eucomis autumnalis. J. Nutr. Food Sci.. 2014;4:312.
- [Google Scholar]
- The potential application of some novel essential oils as natural cosmetic preservatives in an aqueous cream formulation. Flavour Fragrance J.. 2002;17:258-266.
- [Google Scholar]
- In vitro pharmacological effects of manufactured herbal concoctions used in KwaZulu-Natal South Africa. J. Ethnopharmacol.. 2009;122:117-122.
- [Google Scholar]
- Phytochemical screening, antioxidant, anti-inflammatory and glucose utilization activities of three south african plants used traditionally to treat diseases. J. Biol. Med.. 2017;9:412.
- [Google Scholar]
- Artemisia afra and Modern Diseases. J. Pharmacogenom. Pharmacoproteom.. 2011;2:105.
- [Google Scholar]
- Analytical profiling of bioactive constituents from herbal products, using metabolomics-a review. Nat. Prod. Commun.. 2012;7(8):1111-1115.
- [Google Scholar]
- Role of medicinal plants for health perspective: special reference to antioxidant potential. J. Chem. Biol. Therapeut.. 2016;1:106.
- [Google Scholar]
- The potential of South African plants in the development of new medicinal products. S. Afr. J. Bot.. 2011;77(4):812-829.
- [Google Scholar]
- The geographical variation and antimicrobial activity of African wormwood (Artemisia afra Jacq.) essential oil. J. Essent. Oil Res.. 2006;18:19-25.
- [Google Scholar]
- In vitro antiplasmodial activity and cytotoxicity of 33 West African plants used for treatment of malaria. J. Ethnopharmacol.. 2005;98:281-285.
- [Google Scholar]
Appendix A
Supplementary data
Supplementary data to this article can be found online at https://doi.org/10.1016/j.jksus.2021.101422.
Appendix A
Supplementary data
The following are the Supplementary data to this article:


