

Translate this page into:
Estimation of fractional vegetation cover dynamics based on satellite remote sensing in pakistan: A comprehensive study on the FVC and its drivers
⁎Corresponding author at: Beijing Key Laboratory of Precision Forestry, Forestry College, Beijing Forestry University, Beijing 100083, PR China. zhangxl@bjfu.edu.cn (Xiaoli Zhang)
-
Received: ,
Accepted: ,
This article was originally published by Elsevier and was migrated to Scientific Scholar after the change of Publisher.
Peer review under responsibility of King Saud University.
Abstract
The present investigation exposes the significant variations of Fractional Vegetation Cover (FVC) and drivers from year 2003 to 2013 in Pakistan. It is directly calculated by remote-sensing data using Moderate Resolution Imaging Spectroradiometer-Normalized Difference Vegetation Index (MODIS-NDVI) and Compound Night Light Index/Defense Meteorological Program/Operational Line-Scan System (CNLI/DMSP/OLS). The spatial patterns of FVC variation are mainly categorized into three levels, low (<10%), medium (40%) and high (70%), with consequent findings. The FVC time series analysis exhibited the fitting curve with straight lines at 0.29 (29%). These findings displayed the utmost annual mean values 26% to 31% and 28% and 29% correspond to level 70% and 40%, respectively. Among all levels, level 10% has the lowest mean. The trend analysis displayed the low FVC for the southwest and south-eastern regions. This is attributed to industrialization, urbanization, land use, land cover change, and related climatic factors: the northeast and the northwest areas displayed medium and high FVC due to less human disturbance. Using different remotely sensed data, human activities (industrialization and urbanization, etc.) and climatic factors such as rainfall and temperature are considered driving factors of FVC dynamics. Finally, the correlation value of the coefficient verified the link between climatic factors, FVC and CNLI. These findings present the positive correlation of FVC with rainfall and the negative with compounded night light index and temperature.
Keywords
CNLI
NDVI
FVC dynamics
MODIS
Driving factors

- FVC
-
Fractional Vegetation Cover
- MODIS
-
Moderate Resolution Imaging Spectroradiometer
- NDVI
-
Normalized Difference Vegetation Index
- CNLI
-
Compound Night Light Index
- DMSP
-
Defense Meteorological Program
- OLS
-
Operational Line-Scan System
- (NOAA)
-
National Oceanic and Atmospheric Administration
- NEO
-
NASA Earth Observations
- VNIR
-
Visible and near-infrared
- PERSIANN-CDR
-
Precipitation Estimation from Remotely Sensed Information using Artificial Neural Networks-Climate Data Record
- CHRS
-
Center for Hydrometeorology and Remote Sensing
- UCI
-
University of California Irvine
- CDR
-
Climate Data Record
- NCDC
-
National Climatic Data Center
- LST
-
Land Surface Temperature
- CMG
-
Climate Modeling Grid
- L3
-
Level 3
- V006
-
Version 6
Abbreviations
1 Introduction
Biodiversity and the world's ecosystem were adversely affected by increasing population, economic expansion and human activities during the last five decades (Haynes, 2014; Tong et al., 2016). An important and sensitive ecological parameter for explaining the variation in global/regional vegetation and biomes is fractional vegetation cover (FVC) (Gitelson et al., 2002; Haynes, 2014). The estimation of FVC has tremendous importance for ecological and social structures (Shobairi et al., 2018). In the model simulation of environmental and climatic systems, the most critical issues for FVC are elevated human activities and changes in the natural environment (Raskin, 2005; Yang et al., 2010). The vegetation has changed dynamically over time, influenced by the environmental policies and changes in the global climate (Liu et al., 2016; Matteucci et al., 2016).
Several researchers have used FVC to discuss spatial variation's driving factors and laws (Cao et al., 2015). Zhang et al. showed a spatial change pattern in the vegetation coverage. They analyzed the variations in vegetation patterns of a classic oasis area in the River Tarim Watershed (Zhang et al., 2013). Huang et al. and Sun et al. concluded that the temperature shows a negative impact. Conversely, precipitation positively affects vegetation based on the NDVI (Huang et al., 2016; Sun et al., 2013). Increasing population and human-induced activities are the main elements affecting the browning and greening of vegetation. Feng et al. explored the comparative roles of climate change and human activities by using pooled regression model in desertification areas (Feng et al., 2015). The influential factors and quantified the varying vegetation changes using remote sensing were analyzed by Lü et al. (2015); Peng et al. (2015); Tong et al. (2016). FVC long-term estimation is also important for global and regional information of the environment Due to its importance as an important indicator of vegetation dynamic changes (Yue et al., 2021). According to imagery's importance, the remotely sensed satellite data can show fewer variations from very small to more significant levels (Salimi Kouchi et al., 2013). Therefore, to predict the FVC, selecting a suitable vegetation index has tremendous importance (Estel et al., 2015).
Similarly, a longer-term dataset of acceptable spatial resolution at sub-hectare spatial resolutions covers several decades for practical observation of FVC (Kim et al., 2014). In this perspective, the signature of thermal, visible and mid-infrared FVC dynamics can be detected by satellite-borne sensors (Chand et al., 2006). MODIS from NASA is one of the most common satellite systems used in the present investigation. The growing season was well-defined by numerous studies within forest cover masks based on MODIS-NDVI (Potapov et al., 2015). NDVI is a simple graphical indicator that can be used to investigate the remote sensing measurements and evaluate whether the target being observed covers live green vegetation or not. For example, Values near zero (-0.1 to 0.1) are usually related to rock, sand, or snow of barren lands. NDVI's negative values (values approaching −1) relate to water. Positive values describe grass and shrubland (about 0.2 to 0.4), while greater values specify tropical rainforests and temperate forests (values approaching 1) (Seo et al., 2004).
The FVC is computed directly by using NDVI images (Shobairi et al., 2018; Zhang et al., 2013). Furthermore, one of the most significant driving forces is observed by CNLI. It is calculated by data series of DMSP/OLS nighttime lights with visible pixels values from 0 to 63 instead of total values in watts per m2 to assess urbanization, social-economic activities, light consumption, settlements, energy, electricity consumption and gas emissions (Huang et al., 2014; Shobairi et al., 2018). Amongst the conventional census method with its deficiencies of data scarcity, bias and uncertainty in nighttime light emissions (NTLEs) with remote sensing leading to the introduction of a novel technology for examining human activities footprint (Bagan and Yamagata, 2015; Ghosh et al., 2013).
This research's main objective is to analyze the dynamic, classification, time series, and trend analysis of FVC. Finally, the significant aspects of FVC dynamics, such as social activities and climatic factors from 2003 to 2013, were computed. The new idea is to analyze driving forces for FVC in Pakistan through remote sensing data by using night light data in Pakistan. We got spatial and temporal characteristics of FVC dynamics in an ecosystem and the accurate picture of vegetation cover changes in Pakistan. We also got information through remote sensisng that which factor is more responsible for FVC changes in different areas of Pakistan and how vegetation cover changed in past years.
2 Materials and methods
2.1 Study area
Pakistan is a south asian country bounded by 30.3753° N latitude and 69.3451° E longitude. Pakistan covers a territory of 87.98 million ha; this includes 4.57 million ha of woodlands, i.e., forest, covering 5.2 percent of the land (Yaqoob, 2018). Presently, Pakistan is the sixth most populated country globally, with an average density of about 2.6 persons per ha (Baig et al., 2021). In 1947 at independence time, the country's population increased from 32.5 million to 208 million till 2017, equal to a 2.7% mean growth rate per year (Statistics, 2017). Forest resources face serious issues. Cover of the forest consists of 2.99 million ha or 3.9 % of the land area; so, between 195 countries, Pakistan ranks 110th in the ratio of the land area with forest. 32.8 % of the forest area practiced commercial forestry, with the remaining two-thirds protected due to its essential part in protecting the watershed, conservation of soil, and climate functions. Climatically, Pakistan appreciates a significant proportion of variety. North and northwestern high mountainous areas are amazingly cold in winter, while the mid-year-long periods of april to september are pleasing. The indus valley fields are hot in summer, with a cold and dry climate in winter. The coastline in the south has a pleasant environment. There is overall less precipitation observed in this region, normal yearly ranges from 16 cm in the northern part of the lower plain of indus to 120 cm in the Himalayan area. Because of the precipitation and high daytime ranges of temperature, humidity is low (Baig et al., 2021). Fig. 1 shows the map of Pakistan with the province boundary.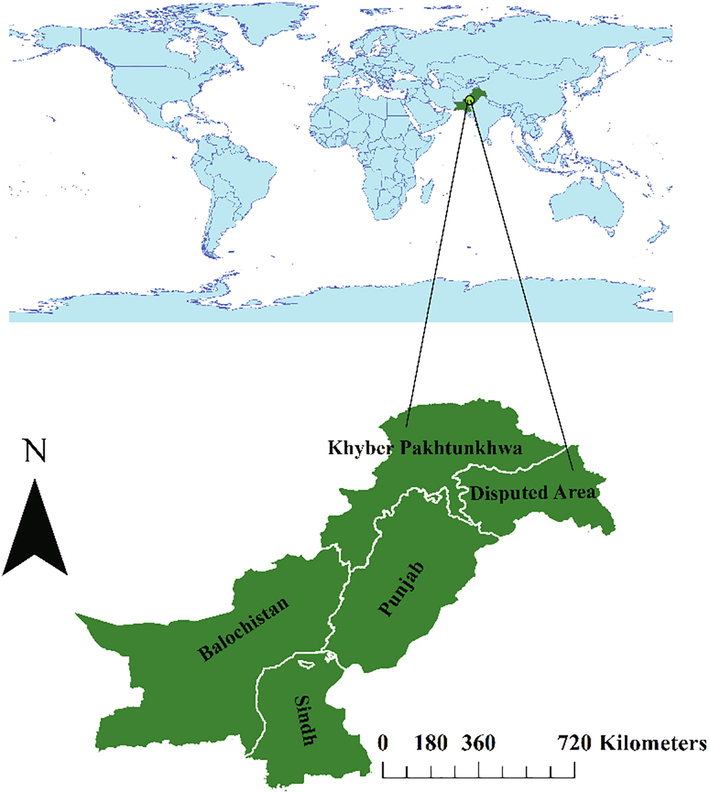
Geographical Location of the study area along with provinces.
2.2 Data source and data process method
Choice of main NDVI images from the MODIS using limiting atmosphere noise is taken out from the NASA Earth Observations (NEO) datasets (Small et al., 2005), using suitable dependent on phonological time series. The required data was chosen from the beginning to the completion of the growing season (April to October 2003-2013). MODIS assumes an essential part in improving approved, worldwide, intelligent earth's system models, capable of foreseeing worldwide change. The second dataset is DMSP/OLS satellites, for example, F14, F15, and F16 from 2003 to 2013 in synchronous orbits of the sun with night overpasses ranging from 8 to 10 pm locally (Shobairi et al., 2018). Given the sensor's affectability at nighttime, DMSP/OLS information can be utilized to identify the collection of visible and near-infrared (VNIR) radiations. This data was acquired from the National Oceanic and Atmospheric Administration (NOAA). The accessibility of long-time information with a moderate spatial resolution (1 km) has empowered analysts to investigate a progression of worldwide, public and territorial research subjects (Gao et al., 2015; Shobairi et al., 2018).
2.2.1 Calculation of FVC
FVC was determined by Eq (1). Where NDVImin is the lowest and NDVImax is the highest value Fig. 2.
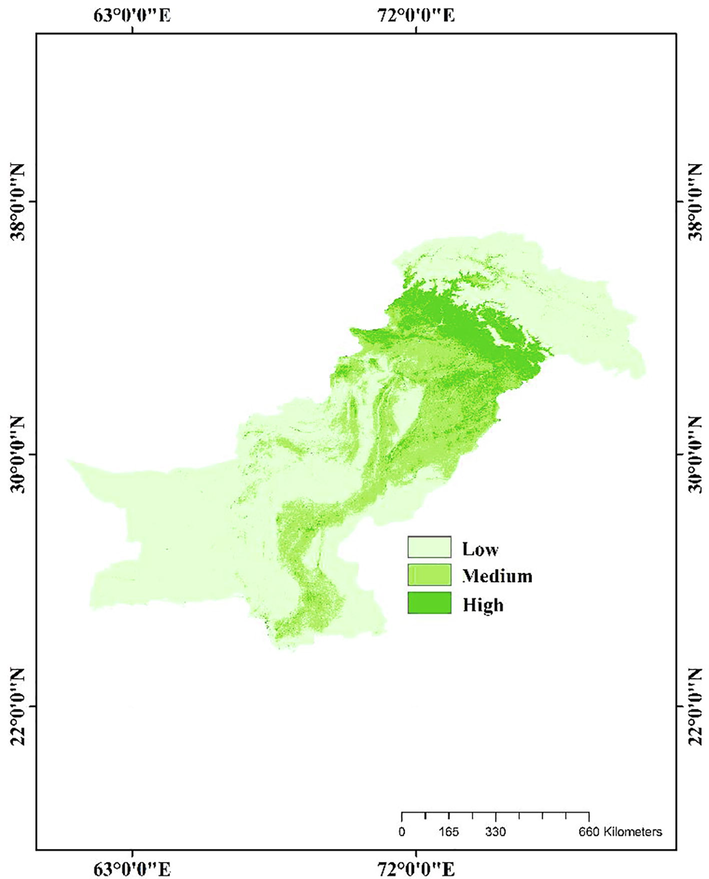
The FVC was reclassified into three categories. Low (<10%), medium (40%), and high (70%). Distribution of FVC values determined through MODIS based on fractional vegetation coverage of study area in 11 years.
2.2.2 Time series and trend analysis of FVC
Analysis of time series was determined using data of annual FVC from 2003 to 2013 with SPSS statistical software. An expert model for time series forecasting was used to fit the yearly data of FVC. The linear trend test was applied to analyze the dynamics of FVC as a dependent variable with the time by using SPSS 19.0 (SPSS Inc., Chicago, IL) (Kirkman et al., 2013)
2.2.3 CNLI calculation
CNLI was calculated using DMSP/OLS data by Eq (2).
DNi shows the ith gray level value of DN, belonging to the ith gray level ni is the number of lit pixels, P is the ideal starting point for the extraction of the lighted cities from the images of DMSP/OLS. The highest DN value is DNM, and the total lit pixels with a DN value among P and DNM shows NL. S is the ratio of lit cities to the whole zone of an area as follows:
2.2.4 LST data
Land Surface Temperature (LST) data from 2003 to 2013 was acquired from MODIS/Aqua Land Surface Temperature and Emissivity Monthly Level 3 (L3) Global 0.05° climate modeling grid (CMG) V006 (MYD11C3). The data has regained using a night/day algorithm that monitors 10:30 and 22:30 local solar time from clear-sky observations. On a 0.05°, the product MYD11C3 is designed latitude/longitude CMG with a spatial resolution of 5.6-km. Day and nighttime LST data type is an unsigned integer of 16-bit, and degree kelvin is its unit. The valid LST range is 7500 to 65635, and 0.02 is the scaling factor followed to calculate the mean using different years' data. We multiplied the scaling actors (0.02) by LST for more remarkable results, then subtracted coefficient of conversion (273.15) subtracted between degrees Celsius and degrees Kelvin to change into centigrade temperature (Li et al., 2019).
2.2.5 Rainfall data
The Precipitation Estimation from Remotely Sensed Information using Artificial Neural Networks- Climate Data Record (PERSIANN-CDR) rainfall data were used from 2003 to 2013. The PERSIANN-CDR is a satellite-based dataset of daily precipitation. Center for Hydrometeorology and Remote Sensing (CHRS) used it at the University of California Irvine (UCI). The Climate Data Record (CDR) program of the National Oceanic, National Climatic Data Center (NCDC) and NOAA was established to give high-resolution datasets of precipitation worldwide for climate studies and rainfall globally (Santos et al., 2021). The PERSIANN-CDR is used to assess the global precipitation trend (Miao et al., 2015).
2.2.6 Driving forces analysis of FVC dynamics
For quantitative correlation analysis between socioeconomic factors and changes in vegetation, we have done correlation analysis by Pearson correlation coefficients to know their correlations. In any case, between each element, there were connections (Zhu et al., 2016). Pearson correlation coefficient affirmed to determine the relation among FVC, CNLI, and factors of climate.
3 Results and discussion
3.1 Time series analysis of FVC
A time-series expert modeler for forecasting was applied to fit the annual FVC information (Shobairi et al., 2018). A yearly fitting line and FVC curve was produced. The fitting curve forms a straight line with a value of 0.29 (29%) parallel to the horizontal year axis, as shown in Fig. 3. From 2003 to 2013, it should be noticed that yearly FVC vacillated around the fitting straight line yet exhibited no broad pattern of addition or reduction. The FVC was equal to an average value of 29% in 2006 and 2012. It was below the average value in 2003, 2004, 2007, and 2009 and the remaining years were beyond the average. As per the information (Chand et al., 2006), a few regions were caught by a severe dry season in 2004 and 2009. During this period, the precipitation was low and the daylight hour was exceptionally long, which unrealistic to advanced vegetation growth and decreasing yearly FVC. Unexpectedly, in a long time from 2005, 2006, 2008, 2010, 2011, and 2013, average yearly precipitation was between 19.68 and 26.37 (inches), causing an enormous vegetation area prompted to develop, setting off the increased FVC.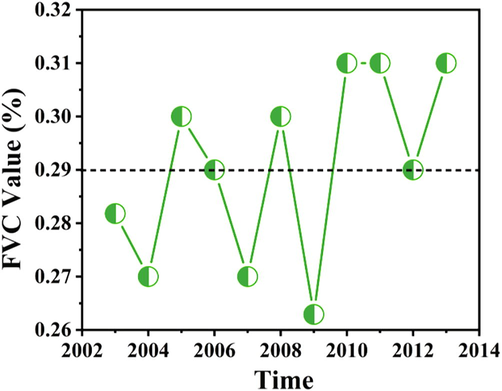
Dynamics of FVC determined through MODIS from 2003 to 2013.
3.2 Trend analysis of FVC
The linear trend test was used to analyze the dynamics of FVC as a dependent variable by time (Kirkman et al., 2013). In 2003, 2004, 2007, 2009, and 2012 the FVC was less than the average value, while in 2005, 2006, 2008, 2010, 2011, and 2013 it is greater than the mean value shown in Fig. 4. The FVC was classified into three categories: low (10%), medium (40%), and high (70%) (Shobairi et al., 2018). During 11 years generally, the spatial distribution of FVC in the southwest and south-eastern parts of the study area are typically occupied by low (10%) due to disturbance of humans and in the northeast and the northwest regions, less human disturbance results in the medium (40%) and high class (70%). This spatial array is closely linked to local variations in industrialization and urbanization. In the northern hilly areas of the province, because of fewer human disruptions, causing a higher FVC. While in the south-eastern area, the human disturbance is at its extreme level resulting in a low FVC.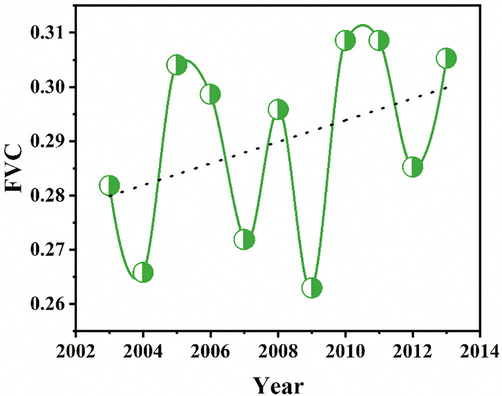
Trend dynamics of FVC determined through MODIS from 2003 to 2013.
3.3 Driving factors of FVC dynamics
3.3.1 Spatial patterns of CNLI and DMSP/OLS
The economy, urbanization and human activities were determined dynamically by computing CNLI information from 2003 to 2013 (Table 1). An increase or decrease in this process starts with one period, then onto the next, and has distinctive years of the trend. By computing, DMSP/OLS information changes in CNLI showed that urbanizations were more dominated in the low vegetation cover part of the study area. CNLI is related closely to human economic activities like urbanization, mine, farming, and it likewise enables the assessment of population density. This phenomenon prompted a decrease in the cover of vegetation in mentioned regions. The CNLI is viewed as a significant sign for assessing the urbanization trend, as shown in Fig. 5(a). DMSP/OLS nighttime satellite informational indexes determined fire areas that were in a good relationship with ground insights and multi-satellite informational indexes with 98% accuracy (Chand et al., 2006). DMSP-OLS has a relationship directly with human activities and affects the dynamics of land cover. For instance, the increase in DMSP-OLS value shows that fire in the forest will be increased, and this procedure can be a stringing factor for the forest. Human activities, urbanization and industrialization, are growing every year, enormously affecting the outcomes.
Year
2003
2004
2005
2006
2007
2008
2009
2010
2011
2012
2013
DMSP/OLS(Mean)
1.762604
2.565418
2.180415
2.545857
2.880753
2.297846
2.383936s
2.275928
2.239623
2.765542
2.612613
CNLI
0.1
0.23
0.16
0.23
0.28
0.19
0.24
0.11
0.11
0.28
0.21
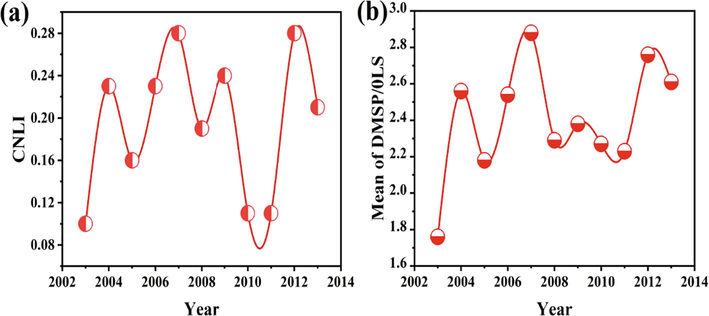
(a) Dynamics of CNLI during 11 years (b) DMSP/OLS (Mean) in Pakistan from 2003 to 2013.
3.4 FVC relationship with different factors
It can be seen clearly from Fig. 6, during the 11 years, the spatial distribution of FVC is generally decreased by an increase in CNLI and temperature from the northern part to the southern part. Confidently this pattern is related closely to urbanization and industrialization level differences in the region. The CNLI and climatic factors for the said period were different and influenced FVC. During the whole period, rainfall had a positive impact on FVC, while analysis of CNLI and temperature data showed that the year in which an increase in CNLI and temperature values was observed had a low FVC, as shown in Table 2.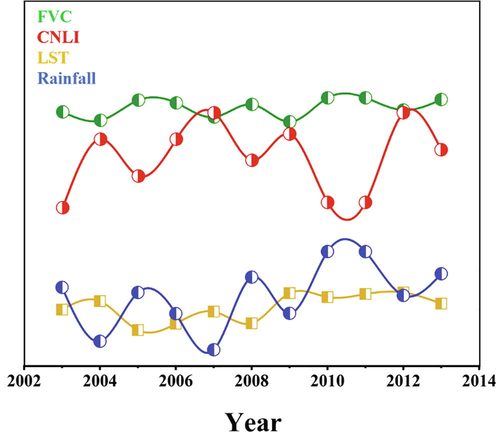
Correlation of FVC with CNLI, LST and rainfall in Pakistan from 2003 to 2013. During 11 years FVC showed positive and negative correlations with different factors.
Year
FVC (mean)
LST (°C)
Rainfall (inches)
CNLI
2003
0.2818
20.12
22.53071
0.1
2004
0.265784
21.04
16.68268
0.23
2005
0.304067
17.9
21.96654
0.16
2006
0.298663
18.59
19.68622
0.23
2007
0.271871
19.9
15.77638
0.28
2008
0.295853
18.64
23.6378
0.19
2009
0.292943
21.91
19.71969
0.24
2010
0.308569
21.47
26.41181
0.11
2011
0.308569
21.81
26.38622
0.11
2012
0.285234
21.97
21.64724
0.28
2013
0.305291
20.77
24.00591
0.21
It has been made clear that the different factors were considered drivers for FVC changes, such as human activities, climate, and environmental factors. The Pearson correlation coefficient was used to investigate the relationship of rainfall, temperature and CNLI with FVC (Table 3). FVC is correlated positively with rainfall mean (inches) and negatively with standard yearly temperature. Moreover, the CNLI also has a negative relationship with FVC. The positive association of FVC with rainfall is attributed to the decreased evaporation rate in the rainy season with no effect on the normal function of plants photosynthesis resulting in increased FVC. The rain causes large vegetation areas to become drought-free, leading to many vegetation and increasing FVC. Similarly, FVC has a negative relation with CNLI throughout the research period. Human activities such as industrialization and urbanization affected the yearly mean FVC (Fig. 7).
Factors
FVC
Mean of Temp
Mean of Rainfall
CNLI
FVC
1.00
−0.245
0.802
−0.549
Mean of Temperature
−0.245
1.00
0.168
0.048
Mean of Rainfall
0.802
0.168
1.00
−0.727
CNLI
−0.549
0.048
−0.727
1.00
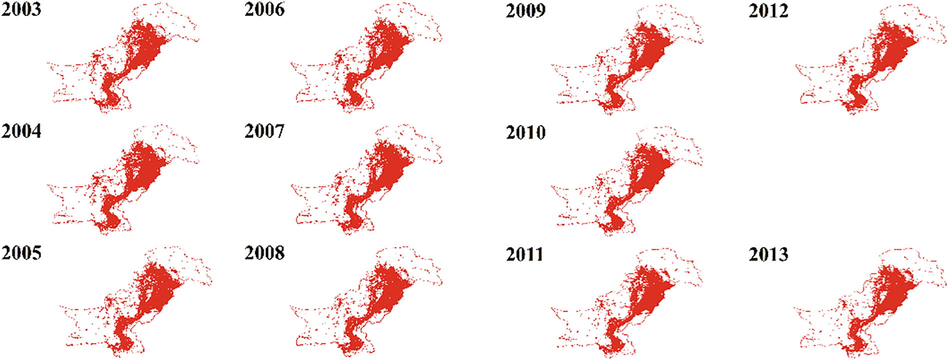
DMSP/OLS nighttime lights of the study area from 2003 to 2013. The CNLI explains industrialization, urbanization dynamics, and population density at the national level. A measure Pearson correlation coefficient is used to assess the relationship between CNLI and FVC during 11 years.
4 Conclusions
The quantitative FVC variations from 2003 to 2013 in Pakistan were investigated, using NDVI images of MODIS, data of meteorology and datasets of DMSP/OLS. FVC time series analysis depicted the mean FVC value to 29 %. The FVC is significantly affected by climate factors (temperature and rainfall) and increased CNLI (human activities urbanization, increased population). In this way, the main variations of FVC have been explained yearly and spatial ranges revealed dynamics of vegetation coverage by all FVC levels. The CNLI showed that urbanization and land use land cover changes are dominant in the study area. Finally, it is concluded that FVC had significant variations in the study area. It has a positive correlation with rainfall and a negative correlation with the temperature and CNLI. Keeping the significance of FVC for the development and conservation of the environment, the future investigation will emphasize FVC measurement.
Funding
This dataset is provided by the National Key R&D Program of China project, “Research of Key Technologies for Monitoring Forest Plantation Resources” (2017YFD0600900).
CRediT authorship contribution statement
Shoaib Ahmad Anees: Conceptualization, Data curation, Methodology, Writing – original draft, Writing – review & editing. Xiaoli Zhang: Supervision. Muhammad Shakeel: Writing – review & editing. Mohamed A. Al-Kahtani: Writing – review & editing. Khalid Ali Khan: Writing – review & editing. Muhammad Akram: Formal analysis. Hamed A. Ghramh: Writing – review & editing.
Acknowledgements
We are grateful to the Beijing Key Laboratory of Precision Forestry, Forestry College, Beijing Forestry University, Beijing (100083), P. R. China, for providing assistance and platforms for this research. The authors appreciate the support of the Research Center for Advanced Materials Science (RCAMS) at King Khalid University Abha, Saudi Arabia through a project number RCAMS/KKU/G002-21.
Conflicts of interest
The authors declare no conflict of interest. It is a free research and the funders had no role in the study's design nor in the decision to publish the results.
References
- Analysis of urban growth and estimating population density using satellite images of nighttime lights and land-use and population data. GIScience Remote Sens.. 2015;52(6):765-780.
- [Google Scholar]
- Agroforestry for healthy ecosystems: constraints, improvement strategies and extension in Pakistan. Agrofor. Syst.. 2021;95(5):995-1013.
- [Google Scholar]
- Impacts of land use and land cover change on regional climate: a case study in the agro-pastoral transitional zone of China. Environ. Res. Lett.. 2015;10(12):124025
- [Google Scholar]
- Monitoring forest fires over the Indian region using Defense Meteorological Satellite Program-Operational Linescan System nighttime satellite data. Remote Sens. Environ.. 2006;103(2):165-178.
- [Google Scholar]
- Mapping farmland abandonment and recultivation across Europe using MODIS NDVI time series. Remote Sens. Environ.. 2015;163:312-325.
- [Google Scholar]
- Dynamics of urbanization levels in China from 1992 to 2012: perspective from DMSP/OLS nighttime light data. Remote Sensing. 2015;7(2):1721-1735.
- [Google Scholar]
- Using nighttime satellite imagery as a proxy measure of human well-being. Sustainability. 2013;5(12):4988-5019.
- [Google Scholar]
- Novel algorithms for remote estimation of vegetation fraction. Remote Sens. Environ.. 2002;80(1):76-87.
- [Google Scholar]
- CRC Handbook of Chemistry and Physics. CRC Press; 2014.
- The influences of climate change and human activities on vegetation dynamics in the Qinghai-Tibet Plateau. Remote Sensing. 2016;8(10):876.
- [Google Scholar]
- Application of DMSP/OLS nighttime light images: a meta-analysis and a systematic literature review. Remote Sensing. 2014;6(8):6844-6866.
- [Google Scholar]
- Global, Landsat-based forest-cover change from 1990 to 2000. Remote Sens. Environ.. 2014;155:178-193.
- [Google Scholar]
- Increased mortality associated with cerebral contusions following trauma in the elderly: bad patients or bad management? J. Neurotrauma. 2013;30(16):1385-1390.
- [Google Scholar]
- Characteristics and trend analysis of the relationship between land surface temperature and nighttime light intensity levels over China. Infrared Phys. Technol.. 2019;97:381-390.
- [Google Scholar]
- Socioeconomic drivers of forest loss and fragmentation: a comparison between different land use planning schemes and policy implications. Land Use Policy. 2016;54:58-68.
- [Google Scholar]
- Recent ecological transitions in China: greening, browning and influential factors. Sci. Rep.. 2015;5(1):1-8.
- [Google Scholar]
- Ecological and social consequences of the Forest Transition Theory as applied to the Argentinean Great Chaco. Land Use Policy. 2016;51:8-17.
- [Google Scholar]
- Evaluation of the PERSIANN-CDR daily rainfall estimates in capturing the behavior of extreme precipitation events over China. J. Hydrometeorol.. 2015;16(3):1387-1396.
- [Google Scholar]
- Vegetation dynamics and associated driving forces in Eastern China during 1999–2008. Remote Sensing. 2015;7:13641-13663.
- [Google Scholar]
- Eastern Europe's forest cover dynamics from 1985 to 2012 quantified from the full Landsat archive. Remote Sens. Environ.. 2015;159:28-43.
- [Google Scholar]
- Global scenarios: background review for the Millennium Ecosystem Assessment. Ecosystems. 2005;8(2):133-142.
- [Google Scholar]
- Geospatial drought severity analysis based on PERSIANN-CDR-estimated rainfall data for Odisha state in India (1983–2018) Sci. Total Environ.. 2021;750:141258
- [Google Scholar]
- Reproducible resistance switching in polycrystalline NiO films. Appl. Phys. Lett.. 2004;85(23):5655-5657.
- [Google Scholar]
- Dynamic estimation model of vegetation fractional coverage and drivers. Int. J. Adv. Appl. Sci.. 2018;5(3):60-66.
- [Google Scholar]
- Spatial analysis of global urban extent from DMSP-OLS night lights. Remote Sens. Environ.. 2005;96(3–4):277-291.
- [Google Scholar]
- Statistics, F. B. 2017. Provisional summary results of 6th population and housing census. Islamabad: Pakistan Bureau Of Statistics, Ministry Of Statistics, Islamabad, Islamic Republic Of Pakistan.
- On the variation of NDVI with the principal climatic elements in the Tibetan Plateau. Remote Sensing. 2013;5(4):1894-1911.
- [Google Scholar]
- Dynamics of fractional vegetation coverage and its relationship with climate and human activities in Inner Mongolia, China. Remote Sensing. 2016;8(9):776.
- [Google Scholar]
- Vegetation cover change with climate and land use variation along main stream of Tarim River. J. Desert Res.. 2010;6:1389-1397.
- [Google Scholar]
- Population Distribution and Water Resources in Pakistan. Università Ca'Foscari Venezia; 2018.
- Method for accurate multi-growth-stage estimation of fractional vegetation cover using unmanned aerial vehicle remote sensing. Plant Methods. 2021;17(1):1-16.
- [Google Scholar]
- Vegetation fractional coverage change in a typical oasis region in Tarim River Watershed based on remote sensing. J. Arid Land. 2013;5(1):89-101.
- [Google Scholar]


