

Translate this page into:
Estimating time series semiparametric regression model using local polynomial estimator for predicting inflation rate in Indonesia
⁎Corresponding author at: Department of Mathematics, Faculty of Science and Technology, Airlangga University, Surabaya 60115, Indonesia. nur-c@fst.unair.ac.id (Nur Chamidah)
-
Received: ,
Accepted: ,
This article was originally published by Elsevier and was migrated to Scientific Scholar after the change of Publisher.
Abstract
A model built from a parametric regression model and a nonparametric regression model is called a semiparametric regression (SR) model. The main problem in the SR model is the estimation of the regression function. In this study, we develop the SR model for time series data that is called Time Series Semiparametric Regression (TSSR) model, and discuss estimation of the TSSR model by using local polynomial. Also, we apply it to data of inflation rate (IR) in Indonesia where IR is as response variable, and both IR and money supply in the previous periods are as predictor variables. Next, we compare the results of estimating the IR using the TSSR with the classical method, namely the ARIMA. Also, the TSSR has high accurate criterion for predicting the IR in Indonesia. The results of this study are useful for analyzing Indonesia’s economic growth rate, which is one of the Sustainable Development Goals (SDGs).
Keywords
TSSR model
Local polynomial
Inflation rate
Money supply
Economic growth rate

1 Introduction
Economic growth (EG) is an increase about national income or production in a country from year to year. To measure the EG of a country, we can look at the level of gross domestic product (GDP) of the country. In macroeconomic, one of references used to measure a country’s economy is inflation that is an economic condition where prices have tendency to rise continuously, or a decrease of money supply in the overall value. (Simanungkalit, 2020). In fundamental economics concept, inflation depends on the circulating quantity of excess money in an economy (Esumanba et al., 2019). In general, inflation is a depreciation of currency or the increasing price of a basic need for instances services and goods. The continuously increasing IR can become an EG obstacle. If a high inflation happened, it would decrease prosperity level and reduce EG, like in Indonesia in 1998. It was caused by the uncontrolled printing of money. Hence, in circulation, the amount of money became huge. Therefore, it is important to keep inflation is to be stable for sustaining EG. Stable condition of inflation is a mandatory prerequisite for sustaining EG, thereby increasing society welfare (Atmaja, 1999; Yu et al., 2023). The IR has a high variance, so there is a fluctuating movement. Hence, an appropriate modeling is required. As one of monetary agencies, Bank of Indonesia controls IR in Indonesia by evaluating whether the target still sets projections of inflation in the future. Saluza (2015) predicted IR in Indonesia based on some information in the past. IR prediction is required for the government and business to make strategic policies in economic field.
As one of statistical models, regression model, can be used for predicting IR. It has two types, namely, parametric regression (PR) model (Yolanda, 2017; Esumanba et al., 2019), and nonparametric regression (NR) model (Aneiros-Perez & Vieu, 2008; Li et al., 2011; Lestari et al., 2018, 2020, 2022; Clark et al., 2022; Chamidah et al., 2020a, 2022, 2024a, 2024b; Aydin et al., 2024). Yolanda (2017) used Time Series Parametric Regression (TSPR) model for analyzing factors that affect inflation and their impact on development index of human and poverty in Indonesia. Next, Nyoni (2019) used TSPR model, namely, ARIMA for predicting inflation in Burundi. Further, Suparti et al. (2018) used Time Series Nonparametric Regression (TSNR) model to model inflation rate in Indonesia. Prahutama et al. (2018) used TSNR for modelling foods sector inflation in Indonesia. According to Chamidah et al. (2012, 2019a); Chamidah & Lestari (2019); and Fibriyani & Chamidah (2021), local polynomial is a very popular approach that can be used to explore localness properties of data. Local polynomial estimator has two special cases. If it has degree of polynomial, , then it will result a kernel estimator or constant local estimator, and if , then it will result a local linear estimator (Chamidah et al., 2020b, 2020c). Furthermore, if we combine these two regression types, we will have a Semiparametric Regression (SR) model (Gao & Hawthorne, 2006; Ramadan et al., 2019; Chamidah et al., 2019b, 2022; Lestari et al., 2023; Aydin et al., 2023; Fibriyani et al., 2024). The SR model can be applied to a time series dataset which is in this study we call it a TSSR model. Time series data is a set of observations taken at different times and periodically collected at a certain time interval. Time series data include one object of research or individual research, for instances, stock prices, currency rates, or inflation rates in several periods such as daily, weekly, monthly, or yearly. Since inflation rate data have high fluctuation pattern, then the use of local polynomial estimator for analyzing this data is very appropriate.
Furthermore, the SR model has more complicated calculation than PR model or NR model. There is no researcher presented above that concerned on estimating TSSR model by using local polynomial estimator. Therefore, this study intends to discuss a new estimation method of the TSSR model by using local polynomial estimator. Next, we apply it to data of IR in Indonesia where IR is as response variable, and both IR and money supply in the previous periods are as predictor variables. Then, we compare the results of estimating the IR using the TSSR with the classical method, namely, ARIMA.
2 Materials and methods
In the following we briefly provide materials and methods used in this study such as TSSR model, Generalized Cross Validation, and Mean Absolute Percentage Error.
2.1 TSSR model
The TSSR model is a SR model applied to time series data. It can be expressed as follows:
, (1) where is a -th response variable, is a parametric component, is an unknown parameter of parametric component, is a nonparametric component that is a smooth function contained in Sobolev space, and is a -th measurement error with mean of zero and variance of .
To estimate
by using local polynomial estimator, we employ a Taylor series expansion as follows:
To estimate
in (6), we carry out a WLS (weighted least square) optimization:
Here, we use kernel function of Gaussian given as follows:
Finally, we substitute equation (9) into equation (3) and we obtain:
2.2 Generalized Cross Validation (GCV)
In estimating TSSR model, we use a criterion of GCV by selecting a minimum value of GCV to obtain an optimal bandwidth (h) value that controls smoothness and goodness of fit to be balance which will affect bias-variance trade-off. Therefore, we obtain:
where
. The optimal value of
can be obtained using GCV criterion as follows (Chamidah et al., 2012):
2.3 Mean Absolute Percentage error (MAPE)
We often use a MAPE value to determine the forecasting accuracy measurement of the estimated model. MAPE obeys the following mathematical expression (Moreno et al., 2013):
MAPE
Criteria
< 10
Highly Accurate
10 – 20
Accurate
20 – 50
Reasonable
>50
Inaccurate
3 Results
The results of this study consist of theoretical results on estimating TSSR model, and application of TSSR model.
3.1 Estimating TSSR model
Suppose given a paired dataset
,
where
represents autoregressive of response variable,
represents autoregressive of predictor variable. The dataset follow the TSSR model:
First, we estimate the NR model by assuming
is known. So, we have:
Based on equation (17), we obtain:
; and .
The local polynomial estimator of
in (20) can be obtained by taking value which minimizes the following weighted least square function:
⇔
⇔ . (22).
Based on equations (17) and (22), we obtain:
3.2 Application
To investigate that the TSSR model is better than the classical time series model, namely, ARIMA, we provide the comparison results of IR estimates by using ARIMA and TSSR approaches.
3.2.1 ARIMA model approach
Dataset of IR in Indonesia from 2004 until 2022 used in this study, shows trend and seasonal patterns. So, the dataset is not stationer in mean and variance. It becomes stationer after doing differencing and Box-Cox transformation. Next, we apply Ljung-Box testing and Kolmogorov-Smirnov testing with significance level of
to investigate whether residual satisfies white-noise and Normality assumptions, and the results are given in Table 2 and Fig. 1.
Model
Parameter
p-Value
White-Noise
Normal
MAPE
In-Samples
Out-Samples
All Samples
SARIMA
(1,1,0)(1,1,1)12
AR 1
SAR 12
SMA 120.042
0.000
0.000Yes
No
SARIMA
(0,1,1)(1,1,1)12
SAR 12
MA 1
SMA 120.000
0.004
0.000Yes
No
SARIMA
(0,1,1)(0,1,1)12
MA 1
SMA 120.000
0.000Yes
No
8.616
10.693
9.655
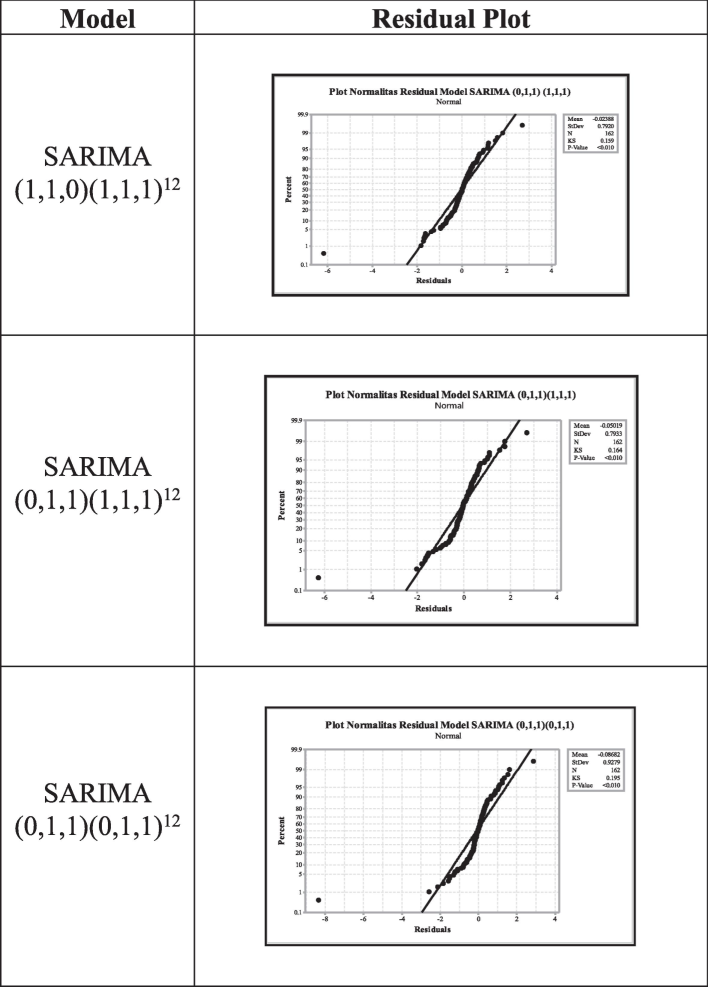
Results of Kolmogorov-Smirnov Testing.
3.2.2 TSSR model approach
Statistical description of inflation dataset from 2004 until 2022 is given in Table 5.
It can be observed from Table 3 that from the start of the reformation era to the present, the average IR has been 5.636 %, with a comparatively large diversity of 12.304 %. In November 2005, when global oil prices and interest rates were rising and local monetary stability was under pressure, Indonesia saw its highest IR of 18.380 %. Domestic fuel prices and the value of the rupiah decreased as a result of this situation. In August 2022, Indonesia had the lowest IR as 1.320 %. The functional link between Indonesia’s IR and money supply (MS) is depicted in Fig. 2. We can observe that it deviates from the traditional definition of a regression. We can observe that the relationship pattern between IR and MS in the previous month is unknown. It can be modeled by using NR approach.
Variable
Statistic
Mean
Variance
Min.
Max.
Inflation Rate
5.636
12.304
1.320
18.380
Money Supply
3.785
4.212
0.995
7.963
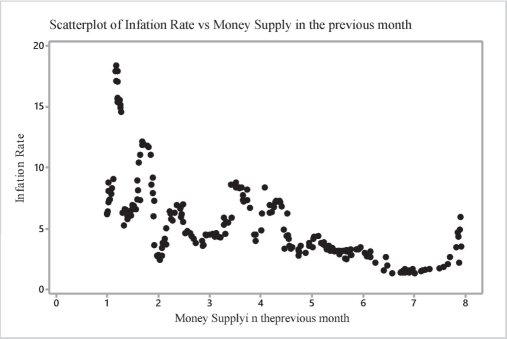
Scatter Plot of IR versus MS in Previous Months.
Fig. 3 shows that the functional relationship between the IR and the previous period’s IR is linear, so it can be modeled by using PR approach. If we combine these models in one case, then we can use SR model approach. Hence, the SR model for this case can be expressed as follows:
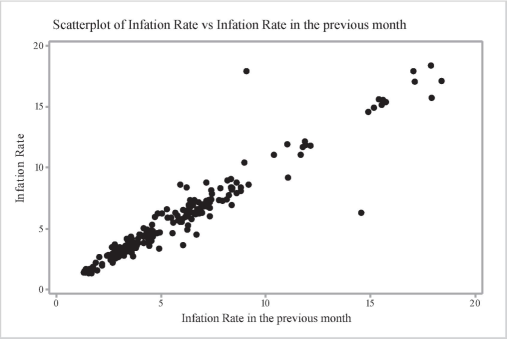
Scatter Plot of IR versus IR in Previous Months.
In this case, these 194 observations serve as the model’s input data. We create degrees of polynomial of
(local linear), and
(local quadratic). We obtained optimal bandwidths of 0.25 and 0.31 for local linear and for local quadratic, respectively. The calculation results using TSSR models (local linear and local quadratic) are given in Table 4 and Table 5.
Optimal Bandwidth
GCV Minimum Value
Degree
Model
MAPE
Training
Testing
Overall
0.25
1.583
1
Local Linear
9.019
8.771
8.949
0.31
1.368
2
Local Quadratic
10.273
8.299
9.286
Orde 1 – Local Linear Model
Criteria
Data
Insample
Outsample
overall
MAPE
0.309
0.474
0.392
R2
96.796
96.759
96.778
AIC
22.362
−37.672
Orde 2 – Local Quadratic Model
Criteria
Data
Insample
Outsample
overall
MAPE
0.306
0.494
0.400
R2
96.741
96.616
96.778
AIC
23.534
−36.399
Orde 3 – Local Qubic Model
Criteria
Data
Insample
Outsample
overall
MAPE
0.311
0.529
0.420
R2
96.715
96.313
96.514
AIC
23.689
−39.955
Table 4 and Table 5 show that overall values of MAPE are 8.949 % and 9.286 % for local linear model and for local quadratic model, respectively. This means that both local linear model and local quadratic model are the best models approach. These models have high accurate criterion because these models have MAPE values which are less than 10 % (see Table 1). Thus, the estimated TSSR model presented in (28) is very suitable for predicting IR in Indonesia. Plots of prediction values using TSSR models (local linear and local quadratic) and actual values are given in Fig. 4.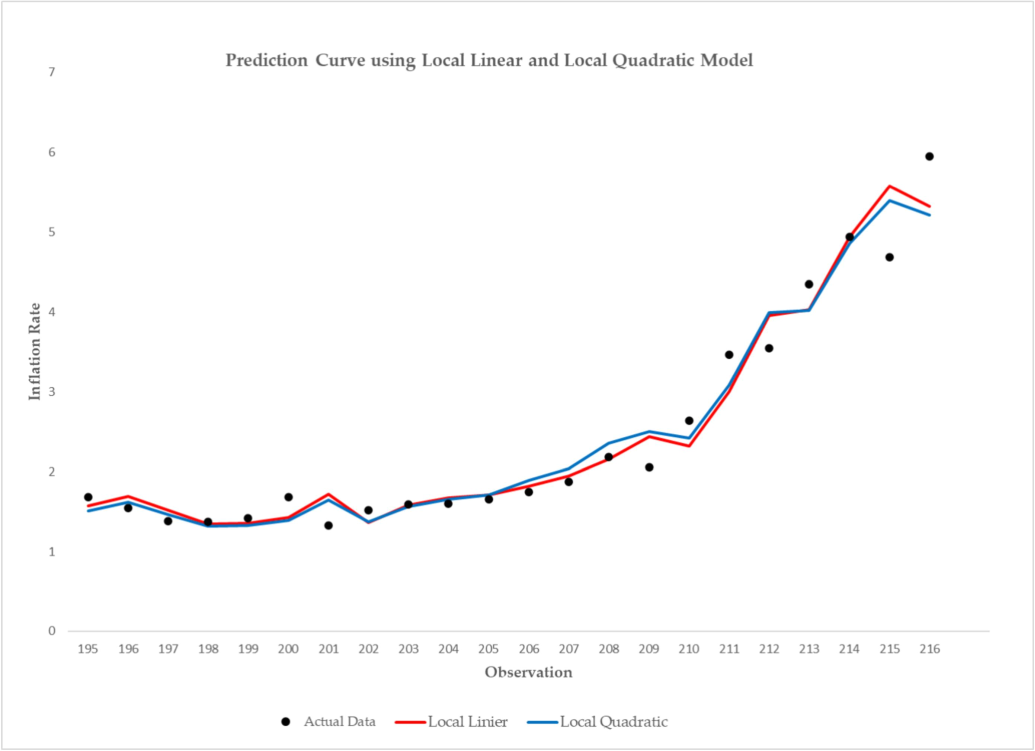
Prediction Curves of Local Linear (red line) and Local Quadratic (blue line).
Fig. 4 shows that the plot between actual data of IR in Indonesia and its predicted values where the red line represents prediction curve of local linear approach and the blue line represents prediction curve of local quadratic approach. We can see that the predicted values of IR in Indonesia by using TSSR models based on local polynomial appear to coincide with the actual data. This means that the prediction error obtained by TSSR model approach is too small.
4 Discussion
Theoretically, the estimation result of the TSSR model by using local polynomial estimator presented in equation (27) is a combination between estimation result of parametric component and estimation result of nonparametric component.
In application, we compare the classical time series model approach, namely, ARIMA, with the TSSR model approach. Modeling of monthly IR in Indonesia by using ARIMA results significant parameters, and it has satisfied white-noise assumption, but three best ARIMA models obtained does not satisfy assumption of normality residual (see Table 2 and Fig. 1). This means that the ARIMA model cannot accommodate factors that affect IR in Indonesia. On the other hand, modeling of monthly IR in Indonesia by using TSSR model based on local polynomial results a small value of MAPE which is less than 10 %. It means that predicted value using TSSR model is highly accurate. Thus, the TSSR model approach is better than ARIMA for prediction of IR in Indonesia.
5 Conclusion
The estimation result of the TSSR model by using estimator of local polynomial is to be combination between estimation result of parametric component and estimation result of nonparametric component of the TSSR model. The classical time series model, namely, ARIMA, cannot be used for prediction IR in Indonesia because its residual does not meet normality assumption. In case of there is no intervention or outlier, the TSSR model approach is suitable for modeling inflation rate in Indonesia. The TSSR can be used to predict inflation rate in Indonesia that is affected by inflation rate and money supply in the previous periods where in this case, the inflation rate in the previous periods is as parametric component, and money supply in the previous periods is as nonparametric component. Also, the predicted values using TSSR model based on local polynomial is highly accurate. It was shown by the MAPE value which is less than 10 %. In addition, it can be used as reference for government in determining policy. Thus, the estimated TSSR model obtained can be used to predict inflation rate in Indonesia for supporting one of the SDGs, namely, economic growth rate.
Funding
Funding of this research was supported by the DRTPM of the Ministry of Education, Culture, Research and Technology, the Republic of Indonesia through the Doctoral Dissertation Research grant (PDD) with a master contract number: 085/E5/PG.02.00.PT/2022, and a derivative contract number: 926/UN3.15/PT/2022.
CRediT authorship contribution statement
Vita Fibriyani: Data curation, Software, Visualization. Nur Chamidah: Conceptualization, Formal analysis, Funding acquisition, Investigation, Project administration, Supervision, Validation, Writing – original draft, Writing – review & editing. Toha Saifudin: Data curation, Investigation, Resources, Software, Visualization.
Acknowledgements
Authors thank the editors, anonymous reviewers of JKSUS, and Dr. Budi Lestari, for useful corrections, criticisms, and suggestions. Also, authors thank Rector of Airlangga University, Indonesia, for supporting facilities of research.
Declaration of competing interest
The authors declare that they have no known competing financial interests or personal relationships that could have appeared to influence the work reported in this paper.
References
- Nonparametric time series prediction: a semi-functional partial linear modeling. J. Multivar. Anal.. 2008;99(5):834-857.
- [Google Scholar]
- Inflasi di Indonesia: sumber-sumber penyebab dan pengendaliannya. J. Akuntansi Dan Keuangan. 1999;1(1):54-67.
- [Google Scholar]
- Right-censored partially linear regression model with error in variables: application with carotid endarterectomy dataset. Int. J. Biostatistics. 2023;2023:1-34.
- [CrossRef] [Google Scholar]
- Right-censored nonparametric regression with measurement error. Metrika. 2024;87(3)
- [CrossRef] [Google Scholar]
- Designing of child growth chart based on multi-response local polynomial modeling. J. Math. Stats.. 2012;8(3):342-347.
- [Google Scholar]
- Estimating of covariance matrix using multi-response local polynomial estimator for designing children growth charts: A theoretically discussion. J. Phys.: Conf. Ser.. 2019;1397(1):012072
- [Google Scholar]
- Z-Score standard growth chart design of toddler weight using least square spline semiparametric regression. AIP Conference Proceedings. 2019;2329:060031
- [Google Scholar]
- Estimating mean arterial pressure affected by stress scores using spline nonparametric regression model approach. Commun. Math. Biol. Neurosci.. 2020;2020:72.
- [CrossRef] [Google Scholar]
- Identification the number of mycobacterium tuberculosis based on sputum image using local linear estimator. Bullet. Elect. Eng. Inform.. 2020;9(5):2109-2116.
- [Google Scholar]
- Consistency and asymptotic normality of estimator for parameters in multiresponse multipredictor semiparametric regression model. Symmetry. 2022;14(2):336.
- [Google Scholar]
- Estimation of multiresponse multipredictor nonparametric regression model using mixed estimator. Symmetry. 2024;16(4):386.
- [Google Scholar]
- Estimating the number of malaria parasites on blood smears microscopic images using penalized spline nonparametric Poisson regression. Commun. Math. Biol. Neurosci.. 2024;2024:60.
- [Google Scholar]
- Clark, Todd, E., Huber, F., Koop, G., Marcellino, M., 2022. Forecasting US Inflation Using Bayesian Nonparametric Models. Federal Reserve Bank of Cleveland, Working Paper No. 22-05. DOI: 10.26509/frbc-wp-202205.
- The impact of money supply on inflation rate in Ghana. Res. J. Finance and Accounting. 2019;10(16):156-170.
- [Google Scholar]
- Prediction of inflation rate in Indonesia using local polynomial estimator for time series data. J. Phys.: Conf. Ser.. 2021;1776(1):012065
- [Google Scholar]
- Modeling case fatality rate of Covid-19 in Indonesia using time series semiparametric regression based on local polynomial estimator. Commun. Math. Biol. Neurosci.. 2024;2024:9.
- [Google Scholar]
- Semiparametric estimation and testing of the trend of temperature series. The Econometrics J.. 2006;9(2):332-355.
- [Google Scholar]
- Spline estimator and its asymptotic properties in multiresponse nonparametric regression model. Songklanakarin J. Sci. Technol.. 2020;42(3):533-548.
- [Google Scholar]
- Estimation of regression function in Multi-response nonparametric regression model using smoothing spline and kernel estimators. J. Phys.: Conf. Ser.. 2018;1097(1):012091
- [Google Scholar]
- Reproducing kernel Hilbert space approach to multiresponse smoothing spline regression function. Symmetry. 2022;14(11):2227.
- [Google Scholar]
- Determining confidence interval and asymptotic distribution for parameters of multiresponse semiparametric regression model using smoothing spline estimator. J. King Saud Univ.–sci.. 2023;35(5):102664
- [Google Scholar]
- Nonparametric time-varying coefficient panel data models with fixed effects. The Econometrics J.. 2011;14(3):387-408.
- [Google Scholar]
- Using the R-MAPE index as a resistant measure of forecast accuracy. Psicothema. 2013;25(4):500-506.
- [Google Scholar]
- Modelling and forecasting inflation in Burundi using ARIMA models. Munich Personal RePEc Archive. MPRA Paper No.. 2019;92444 Retrieved from
- [Google Scholar]
- Modelling fourier regression for time series data – a case study: modelling inflation in foods sector in Indonesia. J. Phys.: Conf. Ser.. 2018;974:012067
- [Google Scholar]
- Standard growth chart of weight for height to determine wasting nutritional status in East Java based on semiparametric least square spline estimator. IOP Conf. Ser.: Mater. Sci. Eng.. 2019;456(5):052063
- [Google Scholar]
- Aplikasi metode jaringan syaraf tiruan backpropagation dalam meramal tingkat inflasi di Indonesia. J. Gradien. 2015;11(1):1075-1078.
- [Google Scholar]
- Pengaruh inflasi terhadap pertumbuhan ekonomi di Indonesia. J. Management (SME's). 2020;13(3):327-340.
- [Google Scholar]
- Modeling inflation in transportation, communication, and financial services using B-Spline time series model. J. Phys.: Conf. Ser.. 2018;1025(1):012104
- [Google Scholar]
- Analysis of factors affecting inflation and its impact on human development index and poverty in Indonesia. European Res. Stud. J.. 2017;XX(4B):38-56.
- [Google Scholar]
- Nonparametric modeling for the time-varying persistence of inflation. Econ. Lett.. 2023;225:111040
- [Google Scholar]
Appendix A
Supplementary material
Supplementary data to this article can be found online at https://doi.org/10.1016/j.jksus.2024.103549.
Appendix A
Supplementary material
The following are the Supplementary data to this article:


