

Translate this page into:
Enhancing skin cancer detection with explainable artificial intelligence: A customized extended deep U-shaped encoder decoder network approach
* Corresponding author E-mail address: sauravmtech2@gmail.com, smallik@hsph.harvard.edu, smallik@arizona.edu (S. Mallik), sujata@nagalanduniversity.ac.in (S. Dash)
-
Received: ,
Accepted: ,
Abstract
One of the most common types of cancer globally is skin cancer. Quick identification of this cancer plays a significant role in patient treatment and successful recovery. It is a condition characterized by the uncontrolled growth of skin cells. Skin cancer consists of two broad categories: melanoma and non-melanoma, each with distinct characteristics and treatment approaches. Recently, deep convolutional techniques have contributed high-quality models to the automation system for the segmentation, visualization, and detection of skin cancer. A deep convolutional neural network architecture, known as U-shaped encoder-decoder network (U-net), is used in various fields, mainly in medical image segmentation. It is also used for various tasks like image processing and computer vision. We proposed a customized extended deep U-net architecture with configured layer dissemination for the classification and segmentation of each image with an affected area and visually explainable visibility of skin cancer consisting of two categorical data samples: melanoma and non-melanoma. The model achieved high accuracy.
Keywords
Gradient-weighted class activation mapping
Segmentation
U-net
Visual explainable

1. Introduction
Worldwide, skin cancer is a public health concern, with the most prevalent types being melanoma and non-melanoma (Sander et al., 2003). Melanoma begins in the body cells with melanocytes, which produce the characteristic color of the skin. It develops due to unrepaired DNA damage (Rodriguez-Rocha et al., 2011) leading to uncontrolled cell growth in the body’s tissues. Non-melanoma skin cancers (Madan et al., 2010) include squamous cell carcinoma (SCC) and Basal cell carcinoma (BCC). The global incidence of skin cancer has shown varying trends. From 1990 to 2019, the annual estimated increase in percentage is 1.78%. Predictions based on a study (Hu et al., 2022) suggest that between 2020 and 2044, the number of deaths, new cases, and disability-adjusted life years attributable to NMSC (non-melanoma skin cancer) will increase by at least 1.5 times. According to the World Cancer Research Fund International, melanoma is the most diagnosed cancer globally, ranking 17th with over 150,000 new cases in 2020. The highest rates of melanoma have been found in Australia and New Zealand. Early detection and identification of both melanoma (Hendrix et al., 2003) and NMSC (Samarasinghe and Madan, 2012) is crucial to prevent their progression and improve outcomes. To reduce the risk of developing skin cancer, it is important to regularly examine the skin, wear protective clothing, and avoid excessive sun exposure. Treatment options for skin cancer include surgical removal (Roenigk and Roenigk, 1990), radiation and chemotherapy (DeHaven, 2014), immunotherapy, and targeted therapy, depending on the stage of the cancer. It is important for individuals to be aware of the symptoms and signs of skin cancer and to seek medical attention for early detection and identification. A proposal for image classification and segmentation, as well as a visually explainable system of skin cancer using deep learning methods and gating mechanisms can aid early detection. Such types of other medical section diagnosis assessments take part in a significant way in some specific diseases like breast cancer detection with deep learning (Muduli et al., 2022) and machine learning approaches (Muduli et al., 2021), diabetes monitoring system (Sharma et al., 2023), etc.
Other researchers have explored FCNs (Fully Convolutional Networks) and DeepLabV3+, which incorporate dilated convolutions and atrous spatial pyramid pooling (ASPP) to capture multiscale contextual information. GAN-based segmentation models, such as SegAN, have also been proposed to refine segmentation boundaries. In recent years, deep learning has significantly advanced skin cancer detection and segmentation, with U-Net and its variations being widely adopted. Many existing works combine U-Net with either encoding-decoding mechanisms or attention mechanisms, while some rely solely on customized U-Net architectures. However, these models primarily focus on segmentation without incorporating classification or visual explanation. Our proposed approach integrates U-Net with both attention mechanisms and encoding-decoding techniques, enhancing feature extraction and segmentation precision. Unlike previous studies, our work extends beyond segmentation by including classification and visual explanations, providing a comprehensive framework for skin cancer analysis. This holistic approach improves interpretability and supports better clinical decision-making.
Bindhu et al. (2023) proposed an MFO-Fuzzy U-net model that processes skin cancer images using IoT-connected Raspberry Pi, with bilateral filtering for noise removal. The Fuzzy U-net segments the affected area, optimized by the May Fly Optimizer to enhance accuracy. The model achieves a high accuracy of 97.57%, outperforming traditional networks like U-net, LinkNet-B7, and FCNs by 0.83%, 3.43%, and 9.21%, respectively. Additionally, they discussed various challenges such as data imbalance, model robustness, and domain adaptation. In another work, Cai et al. (2024) proposed BiADATU-Net, based on Transformer U-Net, which integrates deformable attention Transformer and bidirectional attention blocks for precise skin lesion segmentation. Evaluated on ISIC (2016), ISIC2017, ISIC (2018) (Cassidy et al., 2022), and PH2 datasets, the model achieves an accuracy of over 96%, outperforming state-of-the-art methods. Nazi et al. (2018) proposed a method that employs U-Net for skin lesion segmentation, utilizing spatial dropout to prevent overfitting and data augmentation for increased training samples. Transfer learning was applied to enhance performance, achieving a mean dice score of 0.87 and a Jaccard index of 0.80 on ISIC 2018, and 0.93 and 0.87 on PH2, respectively. For melanoma classification, a DCNN-SVM model was used, achieving 92% accuracy on the PH2 dataset. Narayanamurthy et al. (2018) proposed unique non-invasive techniques for skin cancer detection. They utilized non-invasive diagnostic methods such as dermoscopy-aided analysis in their study. In another work, Nasrin et al. (2019) employed a recurrent residual U-Net (R2U-Net) based autoencoder model for denoising medical images, including digital pathology, dermoscopy, MRI, and CT scans. The model demonstrates promising accuracy in denoising tasks and transfer domain applications between MRI and CT images using publicly available datasets. Karimi et al. (2023) proposed a Dual-Encoder U-Net (DEU-Net) with convolutional and transformer encoders to extract both local features and global context for skin lesion segmentation, enhanced with test-time augmentation. The model achieved Dice coefficients of 92.90% (ISIC 2016), 87.16% (ISIC 2017), 90.81% (ISIC 2018), and 95.65% (PH2), surpassing most state-of-the-art methods. Mohakud et al. (2022) introduced a deep learning model called the fully convolution encoding decoding network (FCEDN) with the Exponential Neighborhood Grey Wolf Optimization (EN-GWO) algorithm for hyperparameter tuning. They achieved high accuracy in segmenting skin cancer disease with Jaccard coefficient values of 98.32% and 95.25%. They used the ISIC (International Skin Imaging Collaboration) 2016 and ISIC 2017 datasets and compared their model with other deep learning models such as SegNet, FCN, Link-Net, and U-Net. Alahmadi et al. (2022) proposed that Multi-Scale Attention U-Net (MSAU-Net) enhances U-Net by incorporating an attention mechanism at the bottleneck and a Bidirectional Convolutional LSTM (BDC-LSTM) to refine feature representation. Evaluated on ISIC 2017, ISIC 2018, and PH2 datasets, the model outperforms existing segmentation methods. Yin et al. (2023) proposed method utilizes a dual-branch interactive U-Net with vertical and horizontal structures, integrating a dual-channel symmetric convolution block (DCS-Conv) and a residual fuse-and-select (RFS) module with self-attention for precise melanoma segmentation. Evaluated on ISIC2016 and PH2 datasets, the model outperforms previous approaches in segmentation accuracy and overall performance.
In our study, we proposed an extended deep U-net architecture consisting of three blocks: encoding, decoding, and an attention gate mechanism, connected with each other individually for the segmentation and classification process. After prediction, we also explored the visual explainable visibility with the extended deep U-net model prediction architecture. We used a customized set of two categorical images of melanoma and non-melanoma from the DermIS and DermQuest databases. Our proposed U-net architecture directly follows the convolutional neural network (CNN) theory, using different sections in our model. Finally, we achieved a high level of accuracy in the segmentation and classification performance of our proposed model, with 97.99% and 92.75% over the ISIC (2016) dataset based on the set of collected customized data samples.
The key points of our whole study:
-
We introduced an enhanced U-Net architecture rooted in a deep CNN that eschews traditional handcrafted feature extraction maps.
-
The model, comprising encoding, decoding, and gating mechanisms, is designed to mitigate overfitting while striving for optimal image segmentation.
-
We gathered two sets of categorical images of melanoma and nonmelanoma, along with their masks, from the DermIS and DermQuest databases. Additionally, we sourced another dataset from ISIC (2016). To ensure consistency, we organized the images in ascending order based on their indices. All data samples are publicly accessible in the DermIS and DermQuest databases. We also compared our findings with the ISIC (2016) dataset, which is available on a public platform.
-
Our research endeavor seeks to accomplish classification, segmentation, and visual explainability for two skin cancer datasets. In tackling the associated challenges, we effectively executed segmentation utilizing image masks and enhanced classification efficacy by integrating deep attention networks with our proposed U-Net architecture.
The remaining sections are structured as follows: Section 2: A detailed description of our proposed U-net architecture, including its three-block connection and block diagram. Section 3: Discussion of the dataset, graphical analysis, model performance, and experimental results. Section 4: Analysis of image segmentation, image prediction, and the process of predicted image masks. Section 5: Summary of our entire paper study and insights into future work.
2. Methodology
The proposed image segmentation framework is based on a U-Net architecture enhanced with attention mechanisms. The process begins with image preprocessing, where input images are resized and normalized to ensure consistency. Image augmentation is applied, incorporating transformations like flipping and rotations to enhance the model’s generalization. The encoding stage consists of multiple EncoderBlocks, where convolutional layers extract hierarchical features, followed by dropout for regularization. MaxPooling reduces spatial dimensions while preserving essential patterns. The bottleneck layer further compresses features, serving as a transition to decoding. The attention mechanism is integrated through Attention Gates, which refine feature selection by emphasizing important regions and suppressing irrelevant details. This enhances segmentation accuracy. The decoding stage employs DecoderBlocks, which use upsampling and concatenation with skip connections to restore spatial details. The final output layer applies sigmoid activation to generate segmentation masks. The model is compiled with the Adam optimizer and binary cross-entropy loss, ensuring efficient learning. Training is performed with a batch size of 8, leveraging callbacks to monitor progress, including GradCAM visualization for interpretability. Fig. 1 illustrates the block diagram of the bidirectional process, outlining the classification of melanoma and nonmelanoma skin cancer, followed by the segmentation of the classified images for precise lesion analysis. The use of extended U-Net is justified by its capacity to capture fine-grained details necessary for precise segmentation, especially in complex skin lesions.
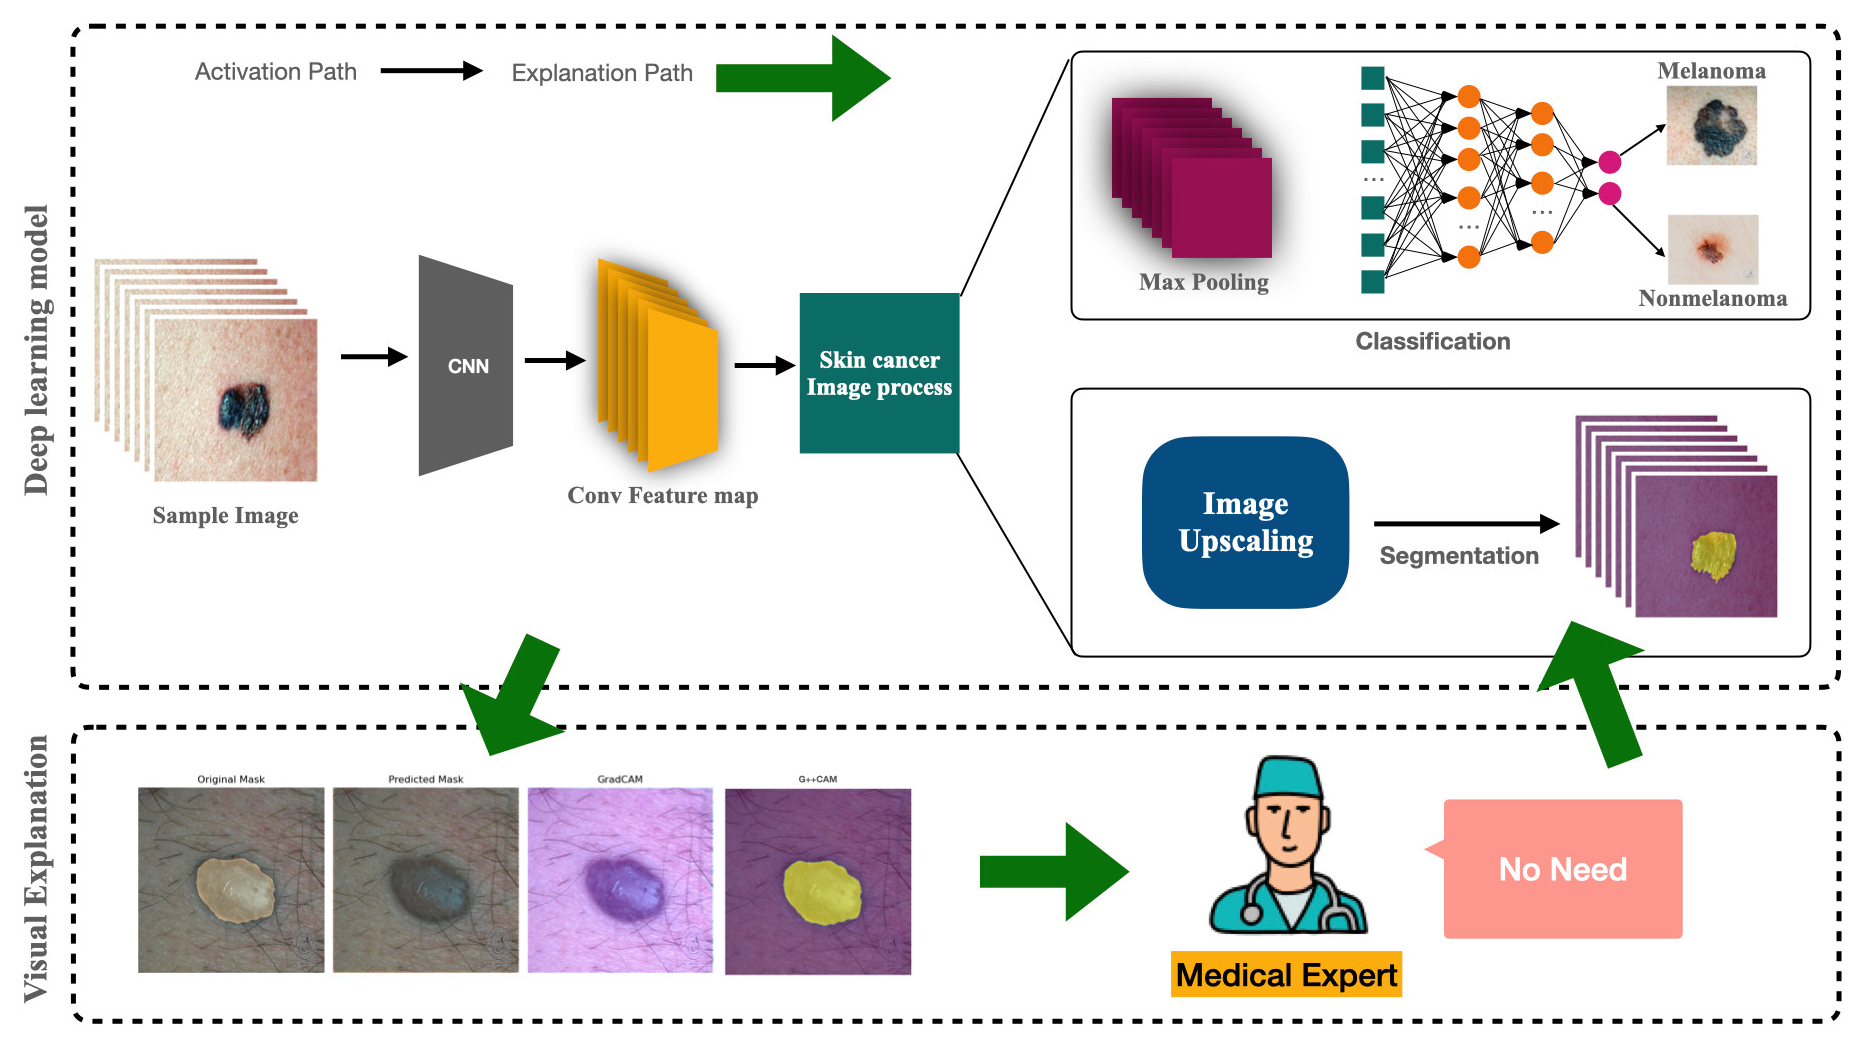
- Architecture view of proposed extended U-net model based on deep convolutional neural network.
2.1 U-Net
The model proposed is a powerful architecture designed for the segmentation process using biomedical image samples, known as the U-net architecture (Sanjar et al., 2020). Our extended deep convolutional U-net architecture, depicted in Fig. 2 consists of three main blocks: encoding-decoding block (Wu et al., 2021) and attention gate mechanism function (Wu et al., 2021). The detailed configuration has been illustrated in Fig. 3(a). The block diagram of the proposed extended U-net in Fig. 3(b) displays a series of four encoding blocks defined by convolutional layers, which aim to capture the context of the input image feature maps. This block helps to reduce the spatial dimensions and feature maps while increasing depth. In the decoder block, the image progressively recovers the spatial resolution using transpose convolutions or up-sampling followed by convolution. The decoder block includes skipping connections from the encoder block to preserve high-resolution features through concatenation. Attention gates are added before merging features in the decoder. By focusing on relevant features and suppressing irrelevant regions, the attention gate block helps the model when dealing with input images of skin cancer. Gating signals are used in this model to emphasize important features passed through skip connections.
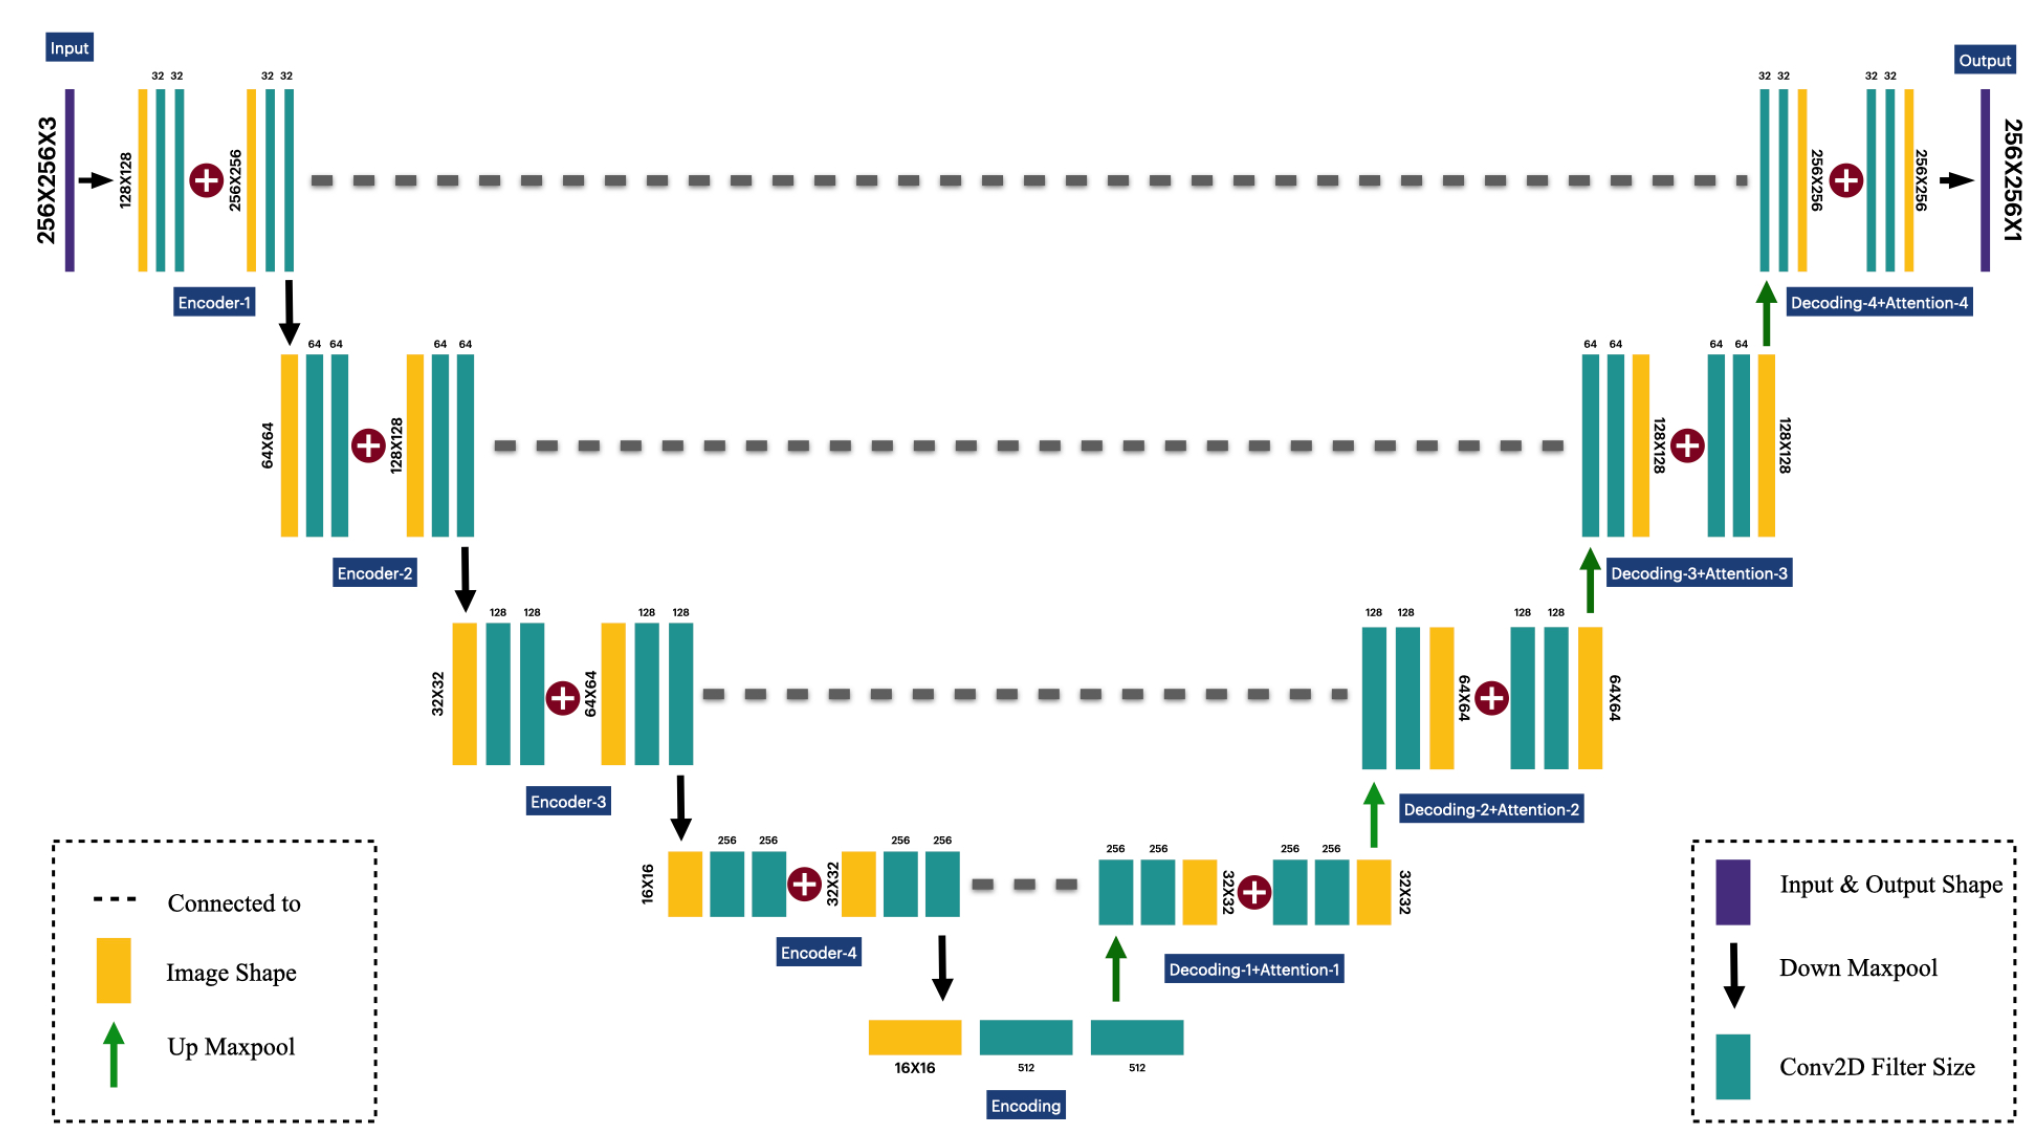
- Block diagram of proposed U-net architecture based on deep learning.
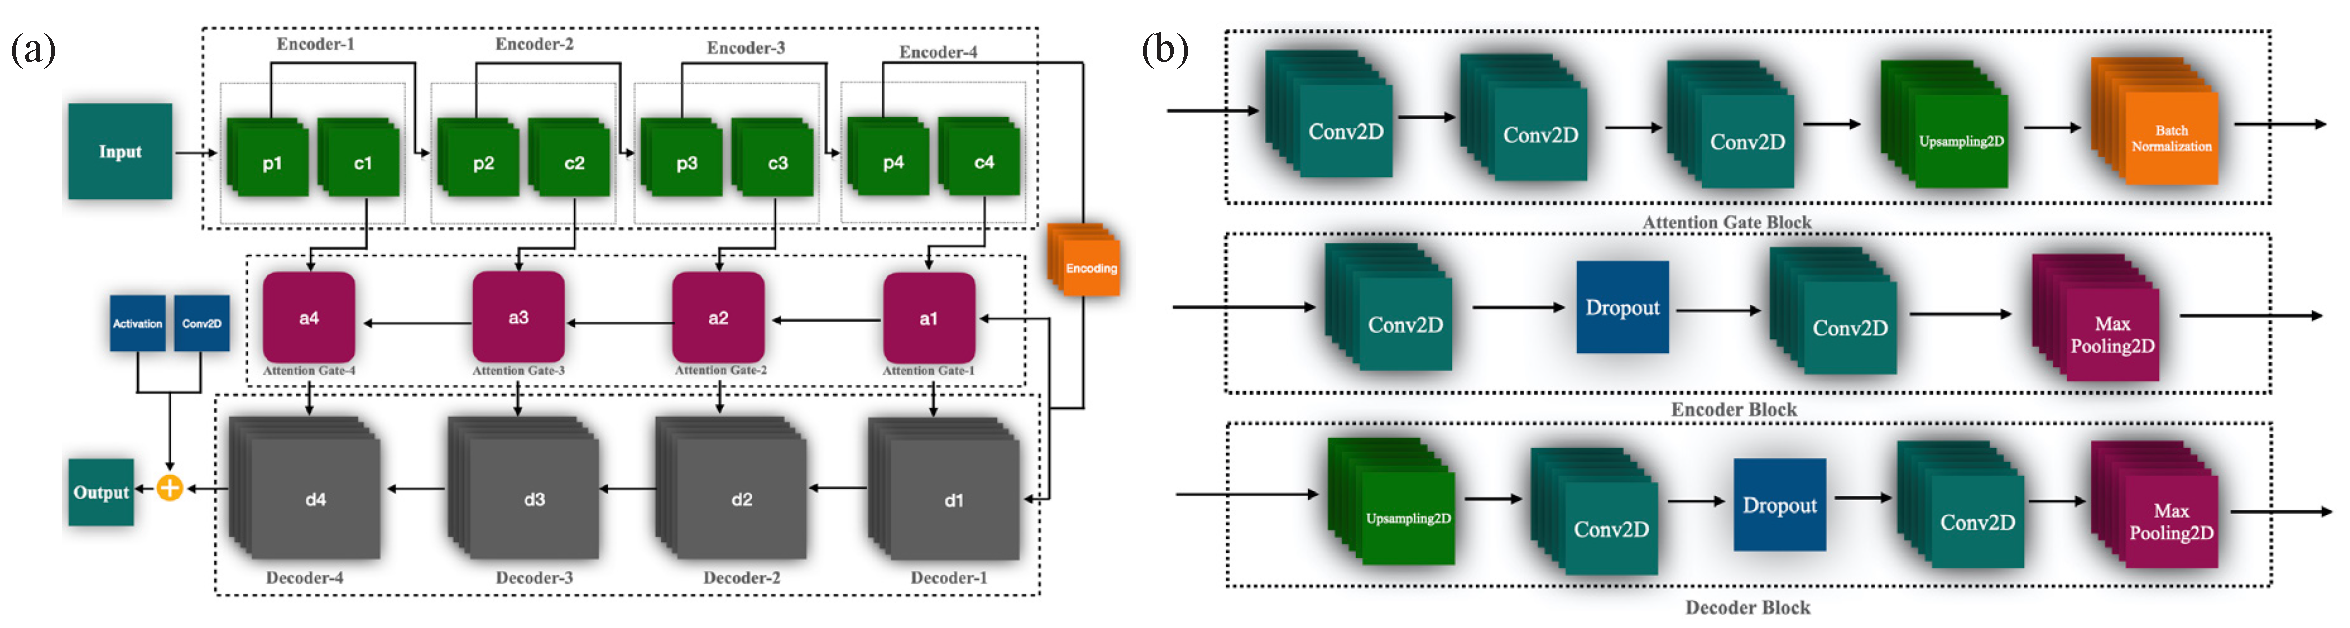
- Provides a detailed architectural representation of the proposed model. (a) Illustrates the block diagram of individual components, including the encoding, decoding, and attention gate architectures, which play a crucial role in feature extraction and refinement. (b) Presents the overall structure of the proposed extended U-Net model, built upon a deep convolutional neural network, highlighting its enhanced capability for skin cancer segmentation and classification.
2.2 Encoding (contracting path)
In proposed extended deep convolutional U-net architecture, the encoder block (Aboussaleh et al., 2023) is essential for capturing convolutional information and decreasing the spatial dimensions of the input image. It follows a neural network architecture like that of a CNN. In Fig. 3(a), a single encoding block includes a convolution layer, pooling layer, dropout layer, and feature doubling, resembling a CNN. The details and mathematical overview of these layers are as follows:
2.2.1 Convolutional Layer
In the encoder block, a deep convolutional layer (Sharma et al., 2024) is utilized for image feature extraction. Learnable filters are applied to each convolutional layer based on the input sample. For a given individual layer (i), the convolution operation can be mathematically represented. Let the input image dimensions be represented as (). When a convolutional layer is applied, the output dimensions transform to a new volume size denoted as (), with the filter dimensions defined as (). The filter dimensions consist of four hyperparameters: (P) indicates the amount of zero padding, and (S) denotes the stride length. Consequently, the output shape can be mathematically expressed as follows:
2.2.2 Relu Layer
The term “ReLU layer” stands for Rectified Linear Unit layer, a widely utilized component in neural networks, particularly in CNNs (Agarap, 2018). It serves to implement activation functionality, facilitating the learning of more computationally intricate representations of data. The rectified linear unit introduces non-linearity into the network architecture. It effectively mitigates overfitting and sparsely activates neurons, mimicking the behavior of biological neurons. When considering any input value (z), the function can be mathematically expressed as follows:
where, like the biological neurons, any input value defined as (h) f i is the feature map produced by the ith layer, Wi is defined as the weights of the filters, * is denoted as convolution operation and the input to ith layer is denoted as xi-1; therefore, ReLU is the activation function.
2.2.3 Pooling layer
To decrease the size of the feature maps, we utilized a pooling layer (Gholamalinezhad and Khosravi 2020). There are two types of pooling layers: MaxPooling Layer and AveragePooling Layer. In our research, we employed the max pooling layer following each set of convolution layers with activation functions. The max pooling operation can be described as:
where a pooled feature map denoted as pi and a function selects the maximum value in a certain window size defined as (MaxPool).
2.2.4 Feature doubling & downsampling
In the U-Net architecture, the number of image or data sample features doubles after each pooling layer, as indicated in Table 1 and Fig. 3(b). This helps the network learn more complex representations. The model’s output is produced by combining the convolutional and pooling layers through the network’s down-sampling configuration, which reduces the spatial dimensions of feature maps. Essentially, the encoder’s output is also known as the bottleneck.
| Layer | Output shape | Connected layer | Parameter |
|---|---|---|---|
| Input (1) (Input Layer) | (None, 256, 256, 3) | 0 | - |
| Encoder (1) (Encoder Block) | [(None, 128, 128, 32), (None, 256, 256, 32)] | Input (1) | 10144 |
| Encoder (2) (Encoder Block) | [(None, 64, 64, 64), (None, 128, 128, 64)] | Encoder (1) | 55424 |
| Encoder (3) (Encoder Block) | [(None, 32, 32, 128), (None, 64, 64, 128)] | Encoder (2) | 221440 |
| Encoder (4) (Encoder Block | [(None, 16, 16, 256), (None, 32, 32, 256)] | Encoder (3) | 885248 |
| Encoding (Encoder Block) | (None, 16, 16, 512) | Encoder (4) | 3539968 |
| Attention (1) (Attention Gate) | (None, 32, 32, 256) | Encoding, Encoder (4) | 1771265 |
| Decoder (1) (Decoder Block) | (None, 32, 32, 256) | Encoding, Attention (1) | 2359808 |
| Attention (2) (Attention Gate) | (None, 64, 64, 128) | Decoder (1), Encoder (3) | 443265 |
| Decoder (2) (Decoder Block) | (None, 64, 64, 128) | Decoder (1), Attention (2) | 590080 |
| Attention (3) (Attention Gate) | (None, 128, 128, 64) | Decoder (2), Encoder (2) | 111041 |
| Decoder (3) (Decoder Block) | (None, 128, 128, 64) | Decoder (2), Attention (3) | 147584 |
| Attention (4) (Attention Gate) | (None, 256, 256, 32) | Decoder (3), Encoder (1) | 27873 |
| Decoder (4) (Decoder Block) | (None, 256, 256, 32) | Decoder (3), Attention (4) | 36928 |
| conv2d (30) (Conv2D) | (None, 256, 256, 1) | Decoder (4) | 33 |
| Total parameters | 10200101 | ||
| Trainable parameters | 10199141 | ||
| Non-trainable parameters | 960 |
2.3 Decoding
A decoder (Kim et al., 2018) is defined as a functional block inside network layer configuration in Fig. 3(a), in the context of extended U-net architecture that is responsible for up-sampling. The up-sampling process is carried out by the encoder function block, which gathers and combines feature maps to create a segmentation map or an output with the same dimensions as the input sample, but possibly with a different number of channels. In our U-net architecture, the decoder block consists of four up-sampling blocks, each performing up-sampling followed by convolutional operations. We utilized transpose convolutions, also known as up-convolutions or deconvolutions, to expand the spatial dimensions in feature maps. Additionally, we incorporated the feature maps from the corresponding encoder block by concatenation, enabling the decoder to access both high-level and low-level features. Let denotes the ith samples of input feature map to the decoder as X with dimension () where, represent as height and as width of the feature maps. The channel number is denoted as . After up-sampling, the output feature maps produce () same dimension as feature map but the value might be changed. In our approach, up-sampling has been used as transposed convolution also known as fractionally stride convolution or deconvolution. In a mathematical way it is represented as follows:
where is the output feature map after upsampling and Conv2DTranspose represents the transpose convolution operation.
2.4 Attention gate
The model used four attention gate mechanism blocks (a1, a2, a3, and a4) connected with four decoding blocks (d1, d2, d3, and d4) in Fig. 3(b) individually in our proposed U-net architecture. Each attention gate functional block consists of a sequential series of three convolutional layers, up-sampling 2D, and batch normalization displayed in Fig. 3(a). Basically, the attention gate is used in neural networks, particularly in architectures like RNN (Recurrent Neural Network), CNN, and image segmentation U-net architecture. By following human attention, the attention gate mechanism is inspired. The attention gate consists of two main components as follows:
2.4.1 Attention mechanism
Each element in the input data is computed by attention weights in the attention mechanism (Guo et al., 2022). These weights signify the importance or relevance of each element to the task at hand. During training, these weights are learned and computed based on the similarity between the context vector and input samples in the attention mechanism.
2.4.2 Gating mechanism
The gating mechanism (Gu et al., 2000) describes how input data is processed using attention weights computed by an attention mechanism. This mechanism filters out noise or irrelevant details from input samples to focus on the most crucial information. It allows the model to selectively amplify or suppress certain parts through the gating mechanism.
Let’s consider, ith a set of input data sets (fi = f1, f2, ....fi), V be the context vector. The attention mechanism computes attention weights (Wi = W1, W2, .... Wi). The mathematical representation of the attention mechanism and gating mechanism are as follows:
In equation (8), is a compatibility score between the input element fi and the context vector denoted as (V). Using various methods, the score can be computed, such as cosine similarity, dot product, or by learned function. Once the attention weights are computed, the gated input f is obtained by modulating the input data f using the attention gate.
Finally, the gated input sample f is passed through the gating mechanism, which typically involves a sigmoid function to determine how much of the original input to let through:
where, represented as weights and the bias parameters denoted as of the gating mechanism and sigmoid activation function denoted as σ.
2.5 Grad-CAM
Gradient-weighted Class Activation Mapping, (Selvaraju et al., 2017) (Grad CAM) is a technique used for visualizing image feature maps. It makes use of the gradients of a target concept that flow from the final convolutional layer. This technique produces a feature map localization, which highlights the affected or targeted areas for original image segmentation with its predicted and processed image mask. Let’s consider Vth as the feature maps of the final convolutional layer, denoted as Gd. In gradient computation, r is denoted as the score for the class. Therefore, nr with respect to the final convolutional layer feature maps Gd, defined as . In the mathematical equation performed, the neuron importance weights with global pooling average on the gradients as follows:
where (i,j) index the spatial dimensions of feature maps and (M) denoted as pixel numbers in the feature map.
The Weighted combination of the feature maps:
Where to generate the heatmap is the resulting upscaled to input sample size of images. Usually, in linear combinations of maps, the ReLU function is used to keep features. On the level of interest, this function has a positive influence.
2.6 Proposed network architecture
In Fig. 3(b), an encoder block consists of two functional components denoted as (, ), where represents the encoder output and indicates the input to the block. The attention-gating block is represented as , while the decoding block is denoted as . Each of these blocks, encoding, decoding, and attention gating comprises convolutional layers, max-pooling layers, upsampling layers, and dropout layers, as illustrated in Fig. 3(a).
In detail, our proposed model consists of four encoding function blocks, each utilizing three repeated convolutional layers with a kernel size of 3x3, followed by a ReLU activation function. Each block also incorporates a 2x2 max-pooling layer with strides of 2x2 for down-sampling. With each encoding step, the number of feature channels doubles. The first encoder block processes the input layer with a size of 256 × 256 × 3, producing two outputs: p1 with dimensions of 128 × 128 × 32 and c1 with dimensions of 256 × 256 × 32, enhanced by a max-pooling layer and a dropout layer. The second encoder block further down samples the features, producing p2 with dimensions of 64 × 64 × 64 and c2 with dimensions of 128 × 128 × 64, again including max-pooling and dropout layers. Similarly, the third block outputs p3 with dimensions of 32 × 32 × 128 and c3 with dimensions of 64 × 64 × 128, while the fourth block generates p4 with dimensions of 16 × 16 × 256 and c4 with dimensions of 32 × 32 × 256, both including max-pooling and dropout layers.
After the encoding process, the central encoding layer combines and processes the features, resulting in an output of size 16× 16 × 512. This serves as the input to the decoding path. The decoding process mirrors the encoding structure but operates in reverse to upscale the feature maps. The first decoding block integrates attention gate-1 and produces d1 with dimensions of 32 × 32 × 256. The second decoding block, connected via attention gate-2, outputs d2 with dimensions of 64 × 64 × 128. The third decoding block, linked to attention gate-3, produces d3 with dimensions of 128 × 128 × 64, and the final decoding block, connected through attention gate-4, generates d4 with dimensions of 256 × 256 × 32. The model concludes with an output layer of dimensions 256 × 256 × 1, representing the final single-channel feature map. The key hyperparameters of the proposed extended customized U-Net model play a crucial role in optimizing performance. The model utilizes ReLU and Softmax activation functions to introduce non-linearity and facilitate multi-class classification. A dropout rate of 0.5 helps prevent overfitting, while a learning rate of 0.0001 ensures stable convergence. The model is trained with a batch size of 32 over 25 epochs using the Adam optimizer for efficient weight updates. Additionally, the input image size is set to 256 × 256 × 3, ensuring consistent processing of skin cancer images.
3. Experimental Setup and Performance Evaluation
Our experiments were conducted on a MacBook Pro (Retina, 13-inch, Mid 2014) with a 2.8 GHz Dual-Core Intel Core i5 processor, 8 GB 1600 MHz DDR3 memory, and Intel Iris 1536 MB graphics. The system ran on macOS Big Sur version 11.7.10. We used the Anaconda Jupyter Notebook platform with Python version 3.12.4 for implementation. The proposed model was designed to be flexible, ensuring compatibility with various hardware and software configurations. We utilized the DermIS, DermaQuest, and ISIC (2016) datasets, which are discussed in detail in subsection 3.1.
3.1 Dataset and preprocessing results
We have collected publicly available skin cancer images with their mask, and we customized the dataset corresponding in a serious alignment with each image with its mask index. A sample image with its mask has been shown in Fig. 4. In this paper, we used two datasets, the first dataset contained the images from both publicly available datasets named as DermIS and Dermaquest (Wen et al., 2022). We have considered a second dataset named ISIC-2016 (Cassidy et al., 2022). In our major dataset, we aligned each image with its respective index in an ascending order with its respective mask. Before training compilation, we processed our image data sample, resizing the image pixel size (256 × 256) with a 3-channel feature colormap like RGB, grayscale etc. The data sample details for train test and validation have been described in a tabular format in Table 2. The dataset consists of melanoma and nonmelanoma are two categorical skin cancer images sampled with each of their masks.
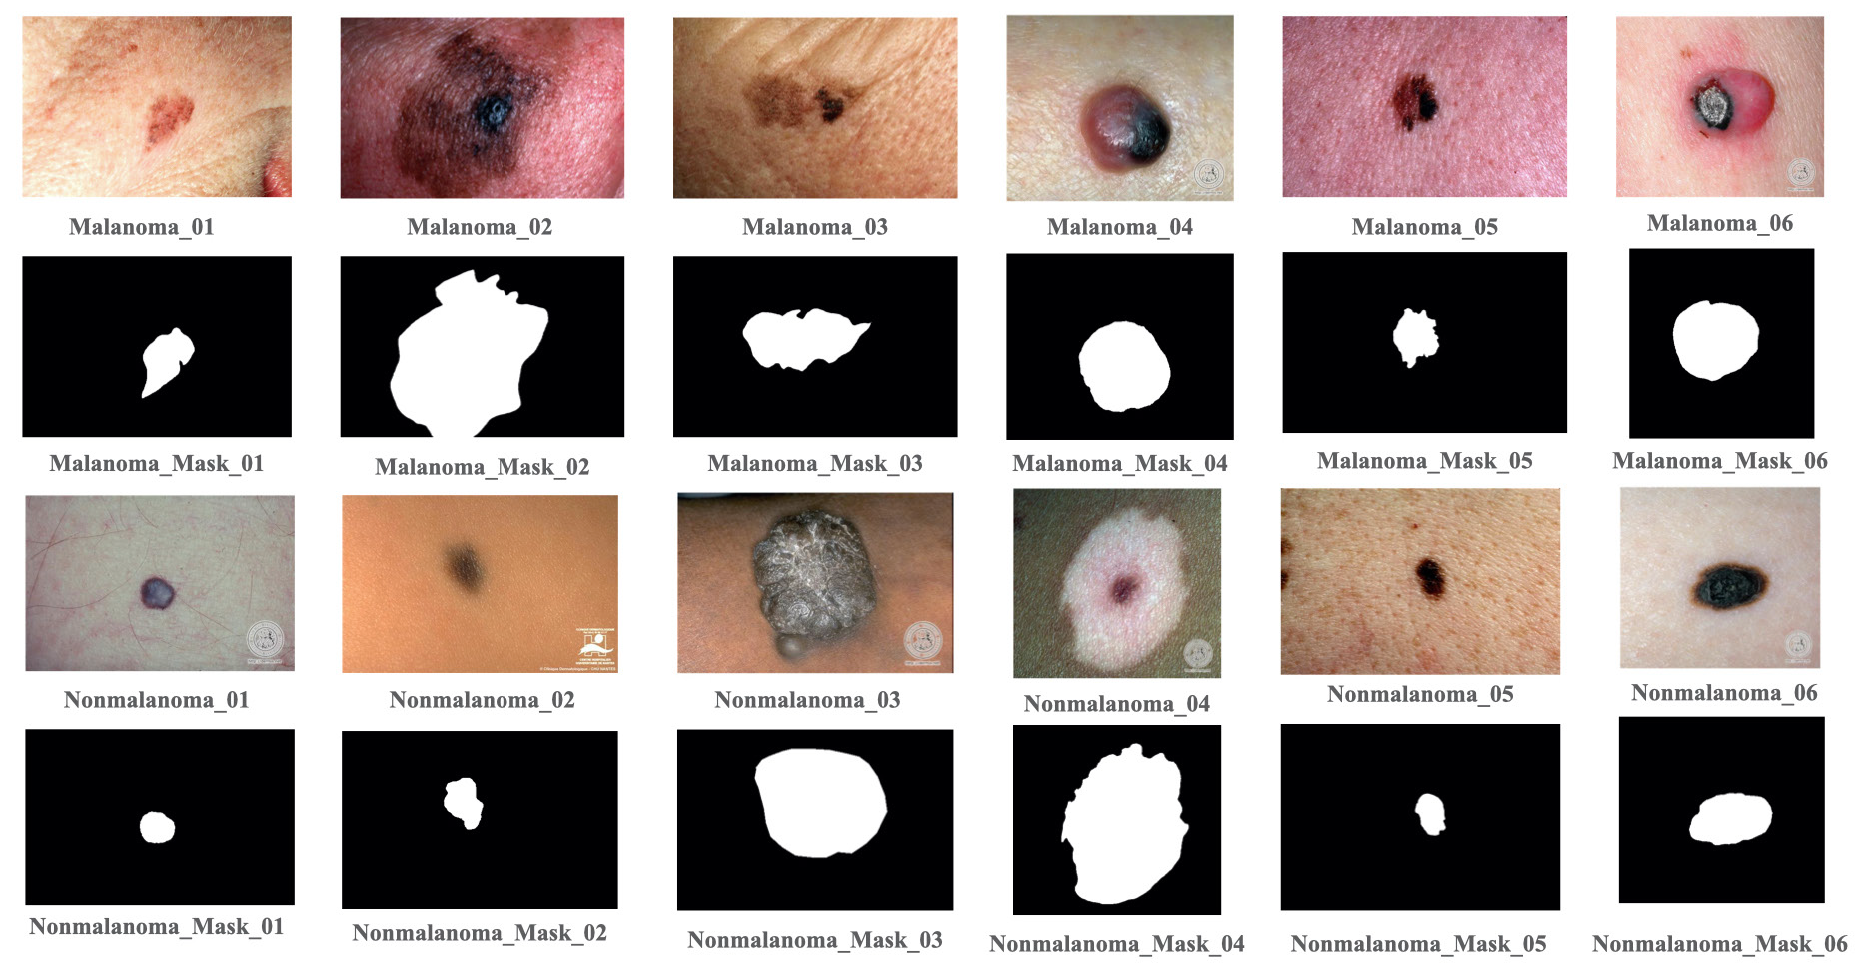
- Some images and each image’s mask of melanoma and nonmelanoma data sample of DermIS and DermQuest Dataset. DermIS: Dermatology image search, DermQuest: Dermatology quest.
| Dataset | Melanoma | Nonmelanoma | Total sample | Train set | Test set | Model accuracy |
|---|---|---|---|---|---|---|
| DermIS and DermQuest images | 93 | 87 | 180 | 144 | 36 | 97.99 |
| DermIS and DermQuest masks | 93 | 87 | 180 | 144 | 36 | 97.51 |
| ISIC (2016) | 1279 | - | 1279 | 900 | 379 | 91.75 |
| ISIC (2016) | 1279 | - | 1279 | 900 | 379 | 92.75 |
DermIS: Dermatology image search, DermQuest: Dermatology quest, ISIC: International skin imaging collaboration.
3.2 Classification results
The results demonstrate outstanding performance with a 97.99% accuracy on a custom-collected image set from both DermIS and DermQuest datasets, reflecting the model’s strong ability to accurately classify and segment skin lesions. Additionally, the model achieved 91.75% accuracy on the ISIC-2016 dataset, further validating its robustness across various dermatological datasets. The graphical analysis of loss and accuracy graphs shows steady improvement during training, indicating the model’s efficient learning process. These results highlight the effectiveness of the proposed deep learning approach, enhanced by attention mechanisms and advanced encoding-decoding techniques, in achieving high precision in skin cancer detection.
3.3 Performance metrics and evaluation
In the context of evaluating the performance of U-net architecture, three key matrices are considered as Accuracy, loss, and IoU (Intersection over Union) over train and validation dataset to analyze the model prediction performance over the test case sample and the differences between train and test performance comparison. The accuracy metrics measure the proportion of correct predictions according to the model performance evaluation where the loss measures how well the model prediction matches the actual labels. In the scenario of IoU (Intersection over Union), which alternate name the Jaccard index (Bouchard et al., 2013), evaluates overlapping between the predicted segmentation and the ground truth. Between the true map, it calculated the area of overlap that is divided by union area. In Fig. 5(a), we plotted our extended deep U-net model performance over DermIS and DermQuest Dataset discussed in subsection 3.1 and in Fig. 5(b) over ISIC(2016) dataset in a graphical representation where the y axis represents the values of performance in percentage and the X-axis represent the number of epoch in every subfigure as follow: Subfigure-( a) represents the loss function, Subfigure-( b) represent the accuracy curve and Subfigure-( c) represent the Intersection over Union (IoU) curve, collectively demonstrate the model’s strong performance, showcasing effective learning, high classification accuracy, and precise segmentation capability.
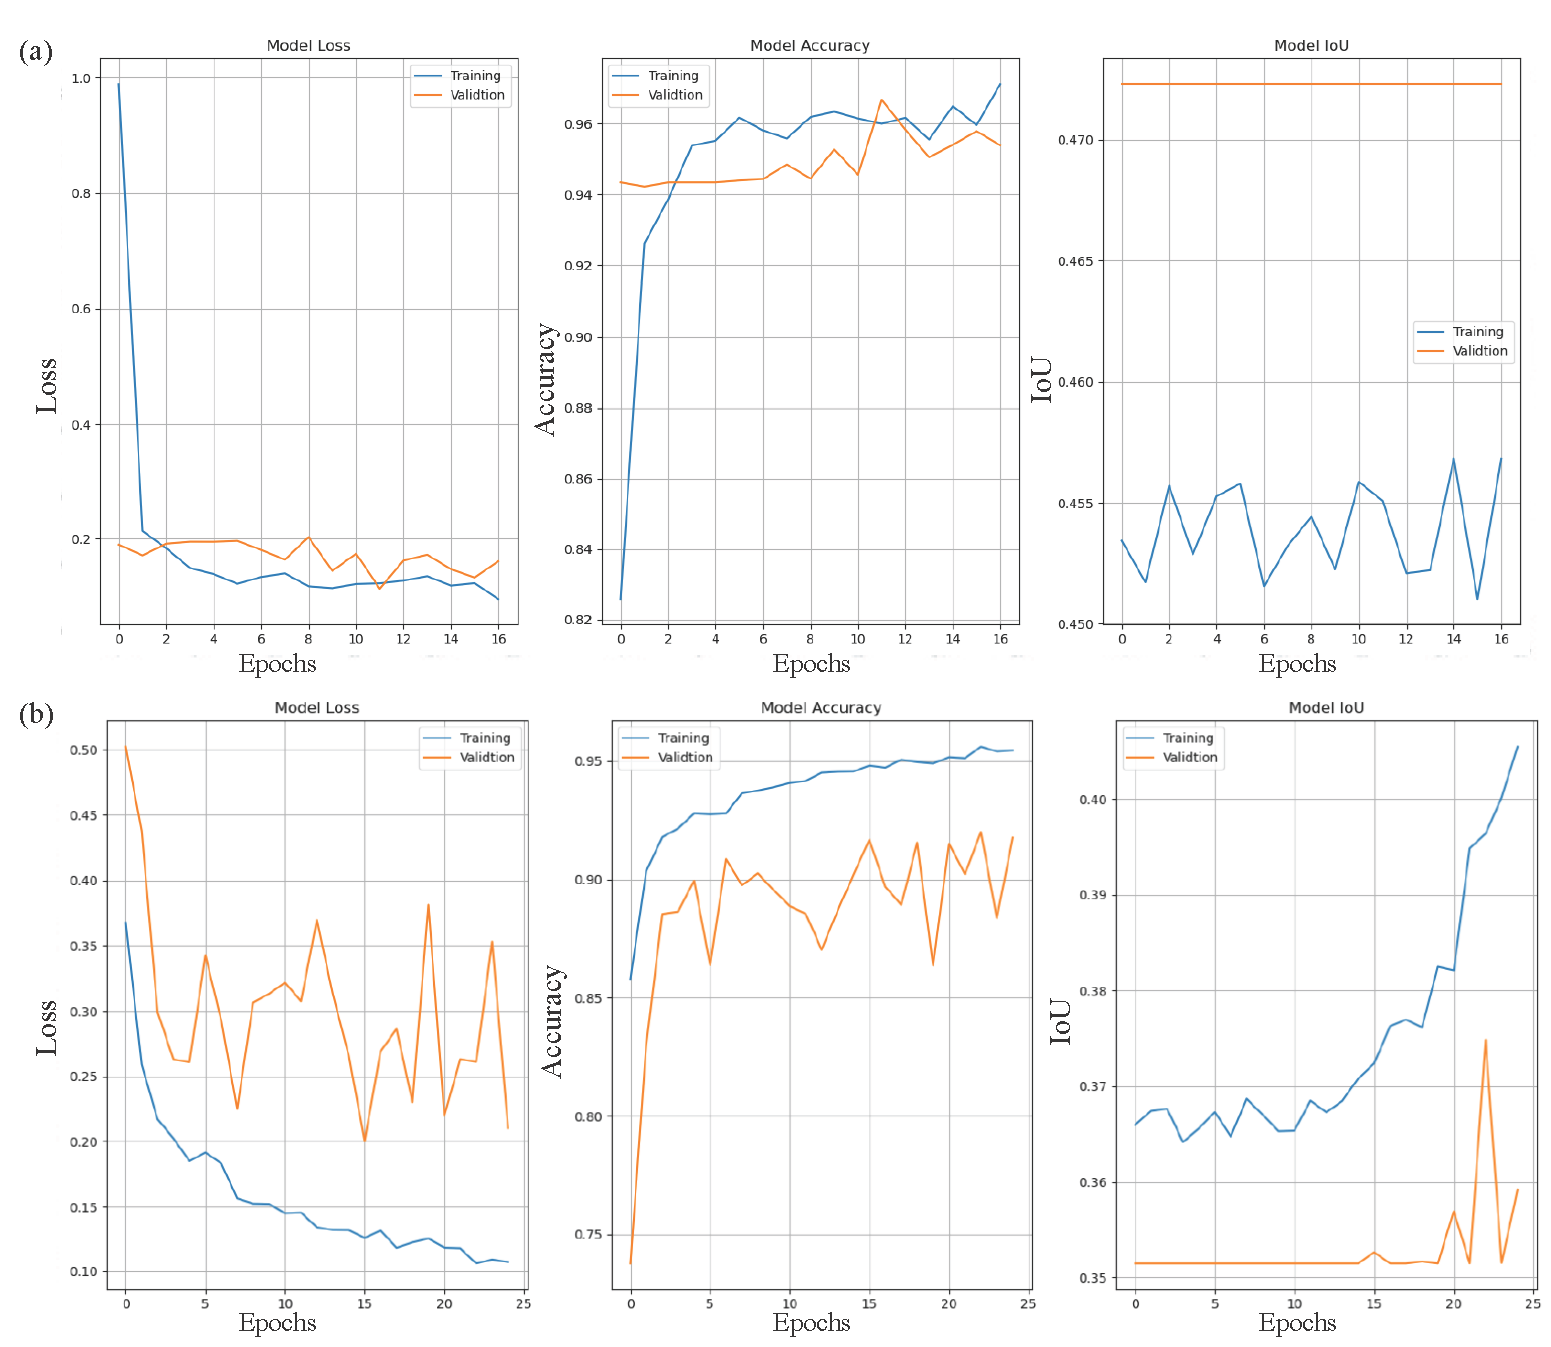
- Graphical analysis of the proposed model’s performance across different datasets. (a) Illustrates the performance metrics on the ISIC (2016) dataset, while (b) Depicts the results on the DermIS and DermQuest datasets. These visual representations provide a comparative evaluation, highlighting the model’s effectiveness in skin cancer classification across diverse datasets. DermIS: Dermatology image search, DermQuest: Dermatology quest, ISIC: International skin imaging collaboration.
3.4 Comparison with existing methods
Table 3 presents a comparative analysis of our proposed extended U-Net model against existing methods for skin cancer classification and segmentation. While previous models such as SegNet (Badrinarayanan et al., 2017), U-Net variants (Turukmane et al., 2023; Anand et al., 2023), and MFO-Fuzzy U-Net (Bindhu and Thanammal, 2023) have achieved high accuracy, our extended U-Net model outperforms them with an accuracy of 97.99%. Compared to Anand et al. (Anand et al., 2023) (97.96%) and Bindhu et al.(Bindhu and Thanammal, 2023) (97.57%), our model achieves a slight but significant improvement, demonstrating its effectiveness. The incorporation of advanced encoding-decoding blocks and attention-gating mechanisms enhances feature extraction and localization, leading to more precise segmentation and classification. These improvements validate the robustness and superior performance of our proposed approach over existing methods.
| Existed method | Classifier used | Accuracy (%) |
|---|---|---|
| Badrinarayana et al. (2017) | SegNet | 91.70 |
| Alom et al. (2019) | RU-Net & R2U-Net | 96.34 |
| Turukmane et al. (2023) | U-Net | 91.00 |
| Anand et al. (2023) | U-Net | 97.96 |
| Bindhu et al. (2023) | MFO-Fuzzy U-Net | 97.57 |
| Naveena et al. (2024) | U-Net | 96.00 |
| Proposed model | Extended U-Net | 97.99 |
Bold denotes proposed model related information. RU-Net: Recurrent U-Net, R2U-Net: Residual recurrent U-Net, MFO-Fuzzy U-Net: Multi-objective optimization fuzzy U-Net, SegNet: Segmentation network.
4. Discussion
In this study, we performed skin cancer lesion classification using a customized extended U-Net architecture, incorporating encoding-decoding blocks and attention-gating mechanisms to enhance feature extraction and localization. Our model operates bidirectionally, effectively classifying melanoma and nonmelanoma lesions while simultaneously segmenting the classified images for precise lesion boundary detection. The integration of attention gates improves focus on relevant regions, leading to more accurate segmentation results. By leveraging the extended U-Net framework, our approach ensures a comprehensive and efficient analysis of skin cancer images, demonstrating superior performance in both classification and segmentation tasks.
4.1 Analysis of experimental results
Guided grad-cam (GCAM) and GCAM++ are the visualization and image segmentation techniques used to understand and interpret the process of decision-making. A feasible system of our proposed extended U-net segmentation model provided Original mask, Predicted mask, and Grad-CAM visualization in Fig. 6(a) over DermIS and DermQuest (Skin cancer images with Masks) data samples and in Fig. 6(b) over ISIC(2016) data samples. Fig. 6(c) illustrates the original, predicted, and processed masks for melanoma and NMSC images, highlighting the segmentation effectiveness on the DermIS and DermQuest datasets. Fig. 6(d) focuses specifically on melanoma skin cancer, showcasing the original, predicted, and processed masks from the ISIC (2016) dataset, demonstrating the model’s precision in identifying affected regions. In the context of image classification tasks, these techniques are used to identify a certain area to capture the highlighted area of an input image sample which contributes the most to the network prediction. After computation, the gradient, as claimed by the predicted level score Grad-CAM, generates a heat map with respect to the feature maps of the last convolutional layer, which contain the same input height and width but might be, with different channel numbers. In Table 3, we compare our extended U-net model with other existing models in detail, those used in the medical section on the subject of image segmentation and visualization.
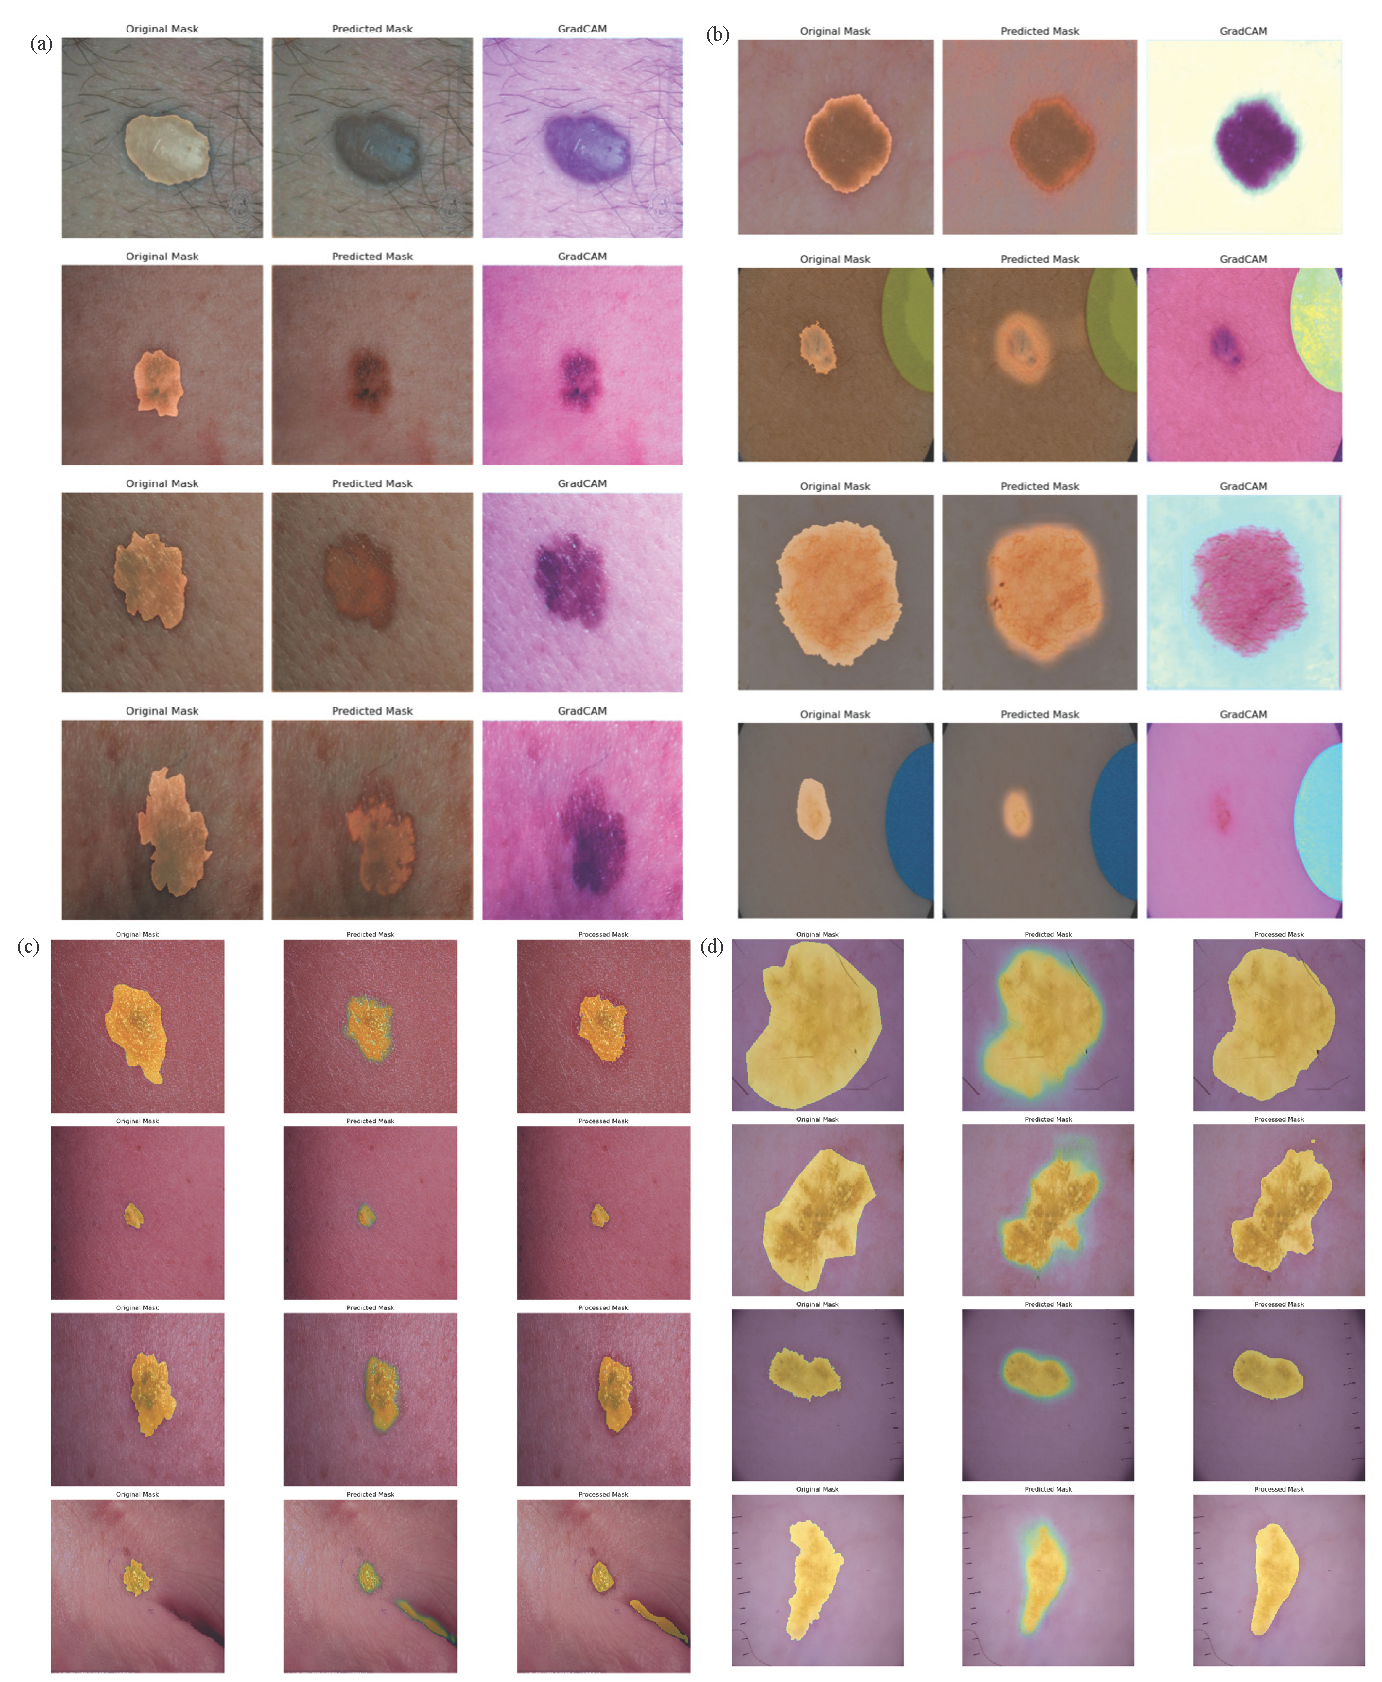
- Grad-CAM visual explanations of predicted data samples, highlighting the model’s focus areas for skin cancer classification. (a) Illustrates results on our customized DermIS and DermQuest datasets, while (b) Showcases predictions on the ISIC (2016) dataset. (c) and (d) Compare the original, predicted, and processed masks for melanoma and nonmelanoma classifications. Specifically, (c) Visualizes these masks for the DermIS and DermQuest datasets, whereas (d) Focuses on melanoma predictions within the ISIC (2016) dataset. These visualizations provide insights into model interpretability and segmentation accuracy. Grad-CAM: Gradient-weighted Class Activation Mapping, DermIS: Dermatology Image Search, DermQuest: Dermatology Quest, ISIC (2016): International Skin Imaging Collaboration (2016).
4.2 Challenges and future works
Our proposed extended U-Net architecture achieves an impressive 97.99% accuracy in classifying melanoma and non-melanoma skin cancer, demonstrating its robustness. The integration of Attention Gates enhances feature selection by focusing on critical lesion regions, improving segmentation precision. Skip connections help retain spatial information, while image augmentation boosts model generalization. However, despite its high accuracy, the model has limitations. It may struggle with highly imbalanced datasets, leading to potential bias toward dominant classes. Additionally, the computational cost is higher due to complex attention mechanisms and deep encoder-decoder pathways. Future improvements can focus on optimizing inference speed and handling rare, ambiguous lesion cases more effectively. Future advancements in skin cancer detection should address key challenges such as dataset biases, model generalizability, and real-world applicability. Many datasets contain imbalanced distributions, where non-melanoma cases outnumber melanoma cases, potentially leading to biased predictions. Enhancing data diversity with multi-source data sets can improve robustness. Additionally, while our extended U-Net with Attention Gates achieves 97.99 % accuracy, its performance may vary across different demographics, imaging conditions, and skin types. Deploying the model in real-world clinical settings requires careful validation, handling of noisy images, and integration with dermatological workflows. Future research should explore lightweight architectures for faster inference, domain adaptation techniques for broader generalization, and AI-driven decision support systems to assist dermatologists in early and accurate skin cancer diagnosis.
5. Conclusions
This research’s advancements in AI for skin cancer early detection have significantly contributed to medical dermatology. First, the classification and segmentation of skin lesions have been improved through deep learning techniques, ensuring a more precise differentiation between malignant and benign lesions. The integration of attention mechanisms allows the model to focus on critical regions within the images, enhancing detection accuracy and reducing false negatives. By enhancing the proposed extended U-Net with advanced encoding-decoding techniques, multiscale feature extraction is achieved, improving the model’s ability to detect intricate details and boundaries in skin lesions. The visual explainability methods, such as Grad-cam and heatmaps, further contribute by providing insights into the decision-making process of the AI, ensuring transparency and fostering trust. Future work includes refining these models for generalization across diverse datasets, incorporating multi-modal data, and expanding to include other dermatological conditions for broader diagnostic applications, thereby advancing personalized patient care.
Acknowledgments
The authors extend their appreciation to the Deanship of Research and Graduate Studies at King Khalid University, KSA, for funding this work through Small Research Project under grant number RGP1/331/45.
CRediT authorship contribution statement
Debendra Muduli: Conceptualization, Data Curation, Formal Analysis, Writing-original draft. Shantanu Shookdeb: Investigation, Visualization, writing-original draft. Sujata Dash: Formal Analysis, Methodology, Supervision, Wring-reviews and editing. Izhar Husain: Software, Validation, Writing-reviews and editing. Mudassir Khan: Investigation, visualization, Software, Writing-original draft. Asharul Islam: Validation, Visualization, Writing- reviews & editing. Saurav Mallik: Conceptualization, Data curation, Visualization, supervision.
Declaration of competing interest
The authors declare that they have no known competing financial interests or personal relationships that could have appeared to influence the work reported in this paper.
Declaration of Generative AI and AI-assisted technologies in the writing process
The authors confirm that there was no use of artificial intelligence (AI)-assisted technology for assisting in the writing or editing of the manuscript and no images were manipulated using AI.
References
- Oxidative stress in malignant melanoma and non-melanoma skin cancer. Br. J. Dermatol.. 2003;148:913-922. https://doi.org/10.1046/j.1365-2133.2003.05303.x
- [Google Scholar]
- DNA damage and autophagy. Mutat. Res.. 2011;711:158-166. https://doi.org/10.1016/j.mrfmmm.2011.03.007
- [Google Scholar]
- Non-melanoma skin cancer. Lancet. 2010;375:673-685. https://doi.org/10.1016/S0140-6736(09)61196-X
- [Google Scholar]
- Changing trends in the disease burden of non-melanoma skin cancer globally from 1990 to 2019 and its predicted level in 25 years. BMC Cancer. 2022;22:836. https://doi.org/10.1186/s12885-022-09940-3
- [Google Scholar]
- Molecular plasticity of human melanoma cells. Oncogene. 2003;22:3070-3075. https://doi.org/10.1038/sj.onc.1206447
- [Google Scholar]
- Nonmelanoma skin cancer. J Cutan Aesthet Surg. 2012;5:3-10. https://doi.org/10.4103/0974-2077.94323
- [Google Scholar]
- Current surgical management of skin cancer in dermatology. J. Dermatol. Surg. Oncol.. 1990;16:136-151. https://doi.org/10.1111/j.1524-4725.1990.tb00034.x
- [Google Scholar]
- Chemotherapy and radiotherapy effects on the skin. Plast. Surg. Nurs.. 2014;34:192-195. https://doi.org/10.1097/PSN.0000000000000077
- [Google Scholar]
- Automated diagnosis of breast cancer using multi-modal datasets: A deep convolution neural network based approach. Biomedical Signal Processing and Control. 2022;71:102825. https://doi.org/10.1016/j.bspc.2021.102825
- [Google Scholar]
- Fast discrete curvelet transform and modified PSO based improved evolutionary extreme learning machine for breast cancer detection. Biomedical Signal Processing and Control. 2021;70:102919. https://doi.org/10.1016/j.bspc.2021.102919
- [Google Scholar]
- A diabetes monitoring system and health-medical service composition model in cloud environment. IEEE Access. 2023;11:32804-32819.
- [Google Scholar]
- Intelligent skin lesion segmentation using deformable attention transformer u‐Net with bidirectional attention mechanism in skin cancer images. Skin Research and Technology. 2024;30 https://doi.org/10.1111/srt.13783
- [Google Scholar]
- Analysis of the ISIC image datasets: Usage, benchmarks and recommendations. Med. Image Anal.. 2022;75:102305. https://doi.org/10.1016/j.media.2021.102305
- [Google Scholar]
- Automatic skin lesion segmentation and melanoma detection: Transfer learning approach with u-net and DCNN-SVM. In: Proceedings of International Joint Conference on Computational Intelligence. IJCCI, Springer Singapore; 2018. p. :371-381.
- [Google Scholar]
- Skin cancer detection using non-invasive techniques. RSC Adv.. 2018;8:28095-28130. https://doi.org/10.1039/c8ra04164d
- [Google Scholar]
- Medical image denoising with recurrent residual u-net (r2u-net) base auto-encoder.”. In: 2019 IEEE national aerospace and electronics conference (NAECON). IEEE; 2019. p. :345-350.
- [Google Scholar]
- DEU-net: Dual-encoder u-net for automated skin lesion segmentation. IEEE Access. 2023;11:134804-134821. https://doi.org/10.1109/access.2023.3337528
- [Google Scholar]
- Skin cancer image segmentation utilizing a novel EN-GWO based hyper-parameter optimized FCEDN. Journal of King Saud University - Computer and Information Sciences. 2022;34:9889-9904. https://doi.org/10.1016/j.jksuci.2021.12.018
- [Google Scholar]
- Multiscale attention u-net for skin lesion segmentation. IEEE Access. 2022;10:59145-59154. https://doi.org/10.1109/access.2022.3179390
- [Google Scholar]
- DI-UNet: Dual-branch interactive u-net for skin cancer image segmentation. J. Cancer Res. Clin. Oncol.. 2023;149:15511-15524. https://doi.org/10.1007/s00432-023-05319-4
- [Google Scholar]
- Improved u-net: Fully convolutional network model for skin-lesion segmentation. Applied Sciences. 2020;10:3658. https://doi.org/10.3390/app10103658
- [Google Scholar]
- Dense-u-net: Dense encoder–decoder network for holographic imaging of 3D particle fields. Optics Communications. 2021;493:126970. https://doi.org/10.1016/j.optcom.2021.126970
- [Google Scholar]
- U-net combined with multi-scale attention mechanism for liver segmentation in CT images. BMC Med. Inform. Decis. Mak.. 2021;21:283. https://doi.org/10.1186/s12911-021-01649-w
- [CrossRef] [PubMed] [PubMed Central] [Google Scholar]
- Efficient u-net architecture with multiple encoders and attention mechanism decoders for brain tumor segmentation. Diagnostics (Basel). 2023;13:872. https://doi.org/10.3390/diagnostics13050872
- [CrossRef] [PubMed] [PubMed Central] [Google Scholar]
- An evolutionary supply chain management service model based on deep learning features for automated glaucoma detection using fundus images. Engineering Applications of Artificial Intelligence. 2024;128:107449. https://doi.org/10.1016/j.engappai.2023.107449
- [CrossRef] [Google Scholar]
- Deep learning using rectified linear units (relu). arXiv preprint arXiv:1803.08375
- Pooling methods in deep neural networks, a review. arXiv preprint arXiv:2009.07485.
- Building encoder and decoder with deep neural networks: On the way to reality. arXiv preprint arXiv:1808.02401.
- Attention mechanisms in computer vision: A survey. Comp. Visual. Med.. 2022;8:331-368. https://doi.org/10.1007/s41095-022-0271-y
- [CrossRef] [Google Scholar]
- Improving the gating mechanism of recurrent neural networks. In: International Conference on Machine Learning. PMLR; 2000. p. :3800-3809.
- [Google Scholar]
- Characteristics of publicly available skin cancer image datasets: A systematic review. The Lancet Digital Health. 2022;4:e64-e74. https://doi.org/10.1016/s2589-7500(21)00252-1
- [CrossRef] [PubMed] [Google Scholar]
- Analysis of the ISIC image datasets: Usage, benchmarks and recommendations. Med. Image Anal.. 2022;75:102305. https://doi.org/10.1016/j.media.2021.102305
- [CrossRef] [PubMed] [Google Scholar]
- A proof for the positive definiteness of the jaccard index matrix. International Journal of Approximate Reasoning. 2013;54:615-626. https://doi.org/10.1016/j.ijar.2013.01.006
- [CrossRef] [Google Scholar]
- SegNet: A deep convolutional encoder-decoder architecture for image segmentation. IEEE Trans. Pattern Anal. Mach. Intell.. 2017;39:2481-2495. https://doi.org/10.1109/TPAMI.2016.2644615
- [CrossRef] [PubMed] [Google Scholar]
- Recurrent residual u-net for medical image segmentation. J Med Imaging (Bellingham). 2019;6:014006. https://doi.org/10.1117/1.JMI.6.1.014006
- [CrossRef] [PubMed] [PubMed Central] [Google Scholar]
- Early-stage prediction of melanoma skin cancer segmentation by u-net. J. Clin. Otolaryngol.. 2023;27:372-376.
- [Google Scholar]
- Fusion of u-net and CNN model for segmentation and classification of skin lesion from dermoscopy images. Expert Systems with Applications. 2023;213:119230. https://doi.org/10.1016/j.eswa.2022.119230
- [CrossRef] [Google Scholar]
- Segmentation of skin cancer using fuzzy u-network via deep learning. Measurement: Sensors. 2023;26:100677. https://doi.org/10.1016/j.measen.2023.100677
- [CrossRef] [Google Scholar]
- DOTHE based image enhancement and segmentation using u-net for effective prediction of human skin cancer. Multimed Tools Appl. 2024;83:75147-75169. https://doi.org/10.1007/s11042-024-18444-0
- [CrossRef] [Google Scholar]
- Grad-cam: Visual explanations from deep networks via gradient-based localization. In: Proceedings of the IEEE international conference on computer vision. 2017. p. :618-626.
- [Google Scholar]


