

Translate this page into:
Efficient removal of Pb(II) from water using silica gel functionalized with thiosalicylic acid: Response surface methodology for optimization
⁎Corresponding authors. nafisurrahman05@gmail.com (Nafisur Rahman), amenizi@ksu.edu.sa (Abdullah M. Al-Enizi)
-
Received: ,
Accepted: ,
This article was originally published by Elsevier and was migrated to Scientific Scholar after the change of Publisher.
Peer review under responsibility of King Saud University.
Abstract
Abstract
The adsorption of Pb(II) onto silica gel functionalized with thiosalicylic acid (TSA@)amine modified SiO2) was studied at 300, 305, 310 and 315 K. The effects of independent variables (pH, adsorbent dose and initial concentration of Pb(II)) on the removal of Pb(II) from water were evaluated and response surface methodology was applied to optimize them. Under the optimized conditions (pH: 6; adsorbent dose, 0.20 g/20 mL and initial concentration: 50 mg/L), removal efficiency of Pb(II) was 98.78%. The adsorption equilibrium data obtained from batch experiments were examined by various isotherm models. Freundlich isotherm model fitted well to the experimental data and indicating the multilayer coverage of Pb(II) on the heterogeneous surface of TSA@)amine modified SiO2. Adsorption kinetic data were investigated by surface and diffusion based kinetic models. Kinetic data fitted well to pseudo-second order model with R2 > 0.999. Elovich model with R2 > 0.999 revealed the occurrence of chemical reaction between Pb(II) and active sites of TSA@)amine modified SiO2. Thermodynamic parameters suggested the spontaneous and endothermic nature of Pb(II) adsorption onto TSA@)amine modified SiO2.
Keywords
Silica gel functionalized with thiosalicylic acid
Pb(II)
Response surface methodology
Box-Behnken design
Nonlinear regression analysis

1 Introduction
The operation of modern chemical industries produces plenty of wastewater containing heavy metal ions and organic pollutants which have led to the emergence of serious problems of water pollution (Zhou et al., 2020; Ibrahim et al., 2020). The heavy metals are non-degradable in environment and can enter human body via food chain and drinking water. Among the heavy metal ions, Pb(II) has received much attention because of its acute toxicity (Kumar et al., 2020; Levin et al., 2020). Excessive exposure of human body to Pb(II) ions causes neurological, hematological, gastrointestinal, cardiovascular and reproductive disorders (Debnath et al., 2019). The presence of high level of Pb(II) in blood causes disturbance in the functioning of central nervous system and therefore, leads to encephalopathy and edema which affects the cerebellum (Rao et al., 2014). The accumulation of lead even at a low concentration can damage the nerves (Fewtrell et al., 2003). Thus, the removal of Pb(II) from surface water and groundwater is an important task to protect the public health and environment. For the purification of water, a variety of techniques such as coagulation (Tang et al.,2016), membrane filtration (Almasian et al., 2018), reverse osmosis (Thaci and Gashi, 2019), solvent extraction (Joel et al., 2020), ion exchange (Lutfullah et al., 2012a, 2012b) and adsorption (Gupta et al., 2004; Rahman et al., 2017) has been proposed. Among them, adsorption is a simple, low cost and effective method because of availability of different types of adsorbent and their easy regeneration for reuse (Qin et al., 2020). Recently, carbonized Phoenix dactylifera seed has been used to remove Pb(II) from groundwater samples in Oman. The adsorption capacity of date stone was 9.03 mg/g for Pb(II) ions (Azmi et al., 2020). The soy waste biomass functionalized with sulphur based chelating agent was studied to removal of Pb(II) and its efficiency was much higher as compared to soy waste biomass (Bulgariu and Bulgariu, 2018). Activated carbon derived from Manilkarazapota tree-wood was found to be a suitable adsorbent for uptake of Pb(II). The adsorption process was explained by Langmuir isotherm model (Sujatha et al., 2020). Additionally, the valorization possibilities of exhausted biosorbents loaded with metal ions have been explored and their advantages and disadvantages were also discussed (Badescu et al., 2018).
Currently, response surface methodology (RSM) is used for optimization of selected variables of any process or method to achieve the best response instead of conventional methods due to its time consuming ability and unable to provide interactive effects of variables on the response (Khammar et al., 2020). RSM has been applied to optimize the variables of adsorption process (Rahman and Nasir, 2019; Rahman et al., 2020).
To understand the behaviour of the adsorption of solute on the surface of the adsorbent under optimized experimental conditions the experimental data were critically examined by adsorption isotherm models (Rahman et al., 2015). These isotherm studies provided the information related to the nature of interaction between adsorbate and the surface of the adsorbent. Similarly, kinetic models were used to characterize the dynamics of the adsorption process and to explain the mechanism of adsorption process (Rahman and Khan, 2016).
Researchers have generally used linear regression analysis of isotherm and kinetic equations to judge the best fitted model (Rahman and Haseen, 2014; Rahman and Khan, 2015). However, the original adsorption isotherm and kinetic equations have been manipulated to transform them into linear equations. These manipulations have been criticized due to the violation of fundamental aspects of the original theories (Kumar and Sivanesan, 2006). Adsorption isotherm and kinetics parameters can be obtained by nonlinear regression analysis using an appropriate software without ignoring the basic concepts of the models. Such results ultimately increase the accuracy and reliability to find the model which best fit to the experimental data.
In our previous study, the synthesis and characterization of silica gel functionalized with thiosalicyclic acid (TSA@)amine modified SiO2) was reported (Rahman and Nasir, 2020). In this study, the potential ofTSA@)amine modified SiO2 was examined for the uptake of Pb(II) from water. The process variables such as pH, adsorbent dose and initial concentration of Pb(II) were optimized by RSM via Box-Behnken design (BBD). The adsorption equilibrium data were examined by Langmuir, Freundlich, and Temkin isotherm models. The adsorption kinetic data were investigated by surface-based and diffusion-based kinetic models. The thermodynamic parameters were calculated to explore the feasibility and spontaneity of the uptake of Pb(II).
2 Experimental
2.1 Materials
Silica gel (Merck, India), 3-aminopropyltrimethoxysilane (Sigma Aldrich) and thiosalicylic acid (HiMedia Laboratories, India) were used to prepare the adsorbent. Lead (II) nitrate, sodium hydroxide pellets and HCl were procured from Merck, India.
2.2 Instrumentation
Atomic absorption spectrometer (AAS) (GBC Scientific, Australia) and digital pH meter (Eutech instruments, Singapore) were employed to measure the Pb(II) concentration and solution pH, respectively. Water bath shaker with variable speed and temperature control was used to agitate the solution mixture.
2.3 Synthesis of TSA@ amine modified SiO2
The synthesis of TSA@ amine modified SiO2 was carried out according to the method reported in the literature (Rahman and Nasir, 2020).
2.4 Experimental design for optimization
RSM via BBD was employed to optimize the influencing operating parameters for the removal of Pb(II). Design Expert (trial version 11.1.0.1) Software was used to generate BBD matrix, regression analysis and 3D response surface plots for the optimization of variables of adsorption process. In BBD, the number of experimental runs required is less than those for central composite design and thus, reducing the consumption of chemicals in the optimization process. In the present study, three independent factors namely, pH (X), adsorbent dose (Y) and initial concentration (Z) of Pb(II) were selected and each factor was investigated at three levels (high (+1), central point (0) and low (−1)) which are given in Table S1 (Supplementary information). BBD matrix suggested a total 17 sets of preliminary experiments involving different combinations of independent variables to achieve the best response (percent removal). BBD matrix is presented in Table 1.
Exp. Run
X
Y
Z
Removal (%) Observed
Removal (%) Predicted
1
6
0.2
50
98.78
98.78
2
6
0.2
50
98.78
98.78
3
10
0.2
20
20.68
20.28
4
6
0.2
50
98.78
98.78
5
6
0.3
20
89.35
89.23
6
2
0.2
20
14.62
14.83
7
6
0.3
80
67.47
67.17
8
6
0.1
20
50.82
51.12
9
10
0.3
50
29.11
29.63
10
10
0.1
50
3.16
3.25
11
2
0.2
80
8.24
8.64
12
2
0.3
50
29.04
28.95
13
6
0.1
80
51.77
51.89
14
6
0.2
50
98.78
98.78
15
6
0.2
50
98.78
98.78
16
10
0.2
80
5.40
5.19
17
2
0.1
50
2.46
1.94
RSM was applied to optimize influencing factors by using the data obtained from the experimental design for the removal efficiency of Pb(II) as a response (% R) and the empirical relation between the response and the independent factors were evaluated by the second order polynomial equation.
2.5 Adsorption isotherms
In order to study the adsorption isotherms, experiments were conducted under the optimal conditions (pH: 6; adsorbent dose: 0.20 g) using different concentrations of Pb(II) and temperatures. In this study, 20 mL solutions of different concentration of Pb(II) (10–100 mg/L) maintained at pH 6 were transferred to a series of 50 mL conical flasks. To each flask, TSA@ amine modified SiO2 (0.20 g) was added and the mixture was agitated (125 rpm) at a desired temperature (300–315 K) in a shaker for 50 min. The adsorbent was removed by filtration and the Pb(II) content in the filtrate was determined by AAS. For AAS determination, calibration curve was constructed using standard solution of Pb(II) in the range of 1–20 mg/L. The detection limit of the AAS instrument was 0.01 mg/L. The adsorbed amount at equilibrium, qe (mg/g) and removal efficiency, R (%) were computed using Eqs. (1) and (2):
where C0 and Ce are initial and equilibrium Pb(II) concentration (mg/L) in the solution, respectively. M and V represent mass of the adsorbent (g) and solution volume (L), respectively.
2.6 Adsorption kinetics
The kinetic experiments were performed in batch mode. In general, 0.20 g of TSA@amine modified SiO2 was mixed with 20 mL of Pb(II) solution (50 mg/L; pH 6.0) in a series of Erlenmeyer flasks. The resulting solutions were agitated (125 rpm) in temperature-controlled shaker at the desired temperature (300–315 K). Conical flasks were withdrawn from the water bath at different time intervals and then solutions were separated from the adsorbent. Finally, the residual Pb(II) content was estimated by AAS and then adsorbed amount (qt, mg/g) of Pb(II) onto TSA@amine modified SiO2 at predetermined time intervals was computed.
2.7 Evaluation of error functions
The values of correlation coefficient (R2) are not sufficient to judge the best fitted model. Therefore, different statistical error functions were calculated to validate the adequacy of the isotherm and kinetic models. The equations of the chosen error functions are mentioned in Table 2. qe,cal and qe,exp are the calculated and experimental adsorption capacities (mg/g) at equilibrium. N represents experimental data points.
Error function
Abbreviation
Expression
Average relative error deviation
ARED
Sum of squares of the error
SSE
Sum of the absolute error
SAE
Chi-square statistic
χ2
3 Results and discussion
3.1 Model validation
The experiments were conducted according to the BBD matrix and percent removal of Pb(II) was determined (Table 1). The results were examined by different regression models (Linear, interactive and quadratic models) and statistical parameters are presented in Table S2 (Supplementary Information). Quadratic model was selected based on lower p-value, high F-value, minimum predicted residual sum of square value and highest R2 value. The second degree polynomial quadratic model that correlates the response to the selected variables can be given by Eqs. (3) and (4) in terms of coded and actual factors, respectively.
In coded factors
In actual factors
The results of analysis of variance (ANOVA) were used to examine the significance of the model terms (Table 3). Model terms are considered as significant when p-value < 0.05 and F-value greater than the value of standard distribution table for a given degree of freedom at 95% confidence level. In the present study the high F-value (16504.65) and p-value < 0.0001 of the quadratic model illustrated its suitability and adequacy. The reliability of the quadratic model for prediction of response was judged by the adequate precision which is the signal to noise ratio and its high value (308.3165) pointed towards the adequate signal and confirming the goodness of the model (Chowdury, et al., 2016). The p-value for lack-of-fit was not given by the software but it was suggested that the lack-of-fit is insignificant. Further, the low value of coefficient of variance (0.8039%) and high correlation coefficient value (R2 = 0.9999) suggested the accuracy and precision of the developed model. It was found that if the difference between the values of correlation coefficient (R2) for the adjusted and predicted response is<0.20, then it would be a reasonable agreement between them. Herein, the difference between adjusted R2 (0.9999) and predicted R2 (0.9992) is < 0.20 which indicated closeness between predicted and experimental values (Fig. S1, Supplementary information). Moreover, the model term XY is not significant because its p-value is 0.4642. Therefore, the contribution of model term XY can be ignored and modified second order polynomial quadratic model in coded and actual factors are represented by Eqs. (5) and (6), respectively.
Source
Sum of Squares
df
Mean Square
F-value
p-value
Model
24913.20
9
2768.13
16504.65
<0.0001
significant
X-pH
1.99
1
1.99
11.89
0.0107
Z-Adsorbent dose
1424.82
1
1424.82
8495.30
<0.0001
C-Initial concentration
226.74
1
226.74
1351.90
<0.0001
XY
0.1005
1
0.1005
0.5992
0.4642
XZ
19.80
1
19.80
118.07
<0.0001
BC
130.30
1
130.30
776.91
<0.0001
X2
19314.03
1
19314.03
1.152E + 05
<0.0001
Y2
961.38
1
961.38
5732.09
<0.0001
Z
1490.86
1
1490.86
8889.07
<0.0001
Residual
1.17
7
0.1677
Lack of Fit
1.17
3
0.3913
Insignificant
Pure Error
0.0000
4
0.0000
Cor Total
24914.38
16
3.2 Response surface analysis
The regression equation is graphically represented by 3-D response surface plots (Fig. 1). Fig. 1a shows the interactive effect of pH (X) and initial concentration (Z) on the removal (% R) when adsorbent dose (Y) was fixed at center point (Y = 20 mg and contact time 50 min). It was observed that the removal (%) at any fixed pH, increases with increasing the initial concentration upto 50 mg/L and maximum removal efficiency (98.78%) was achieved at contact time of 50 min. Further increase in Pb(II) ion concentration showed a decreasing trend in removal efficiency due to unavailability of binding sites on the surface of TSA@amine modified SiO2. The interaction effect of adsorbent dose (Y) and initial concentration (Z) while keeping the pH (X) at the center point on the removal efficiency revealed that the removal efficiency increases from 51.77% to 98.78% with increasing the amount of TSA@amine modified SiO2 from 0.10 g to 0.20 g. Further increase in the amount of adsorbent did not improve the removal efficiency. Hence the maximum removal was achieved with 0.20 g of TSA@amine modified SiO2. This resulted due to the increase in the surface area and number of active sites to bind with Pb(II) ions (Fig. 1b).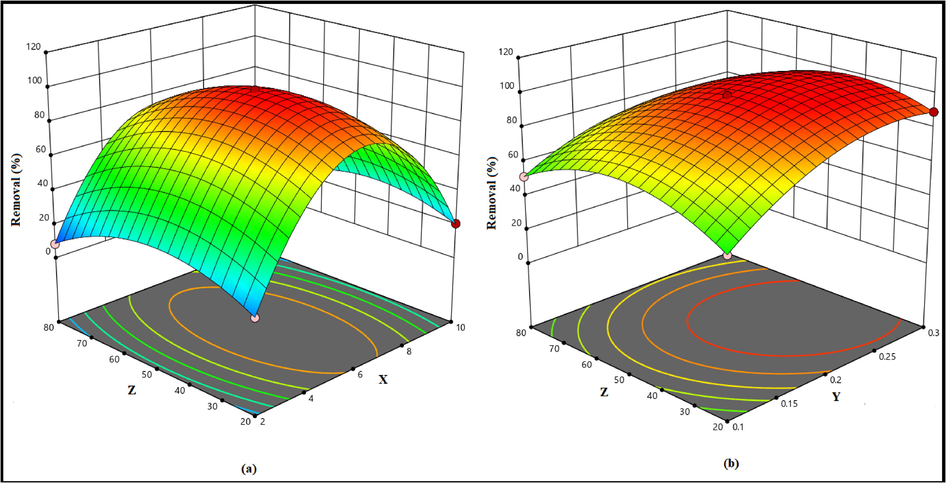
Response surface plots to show the effects of (a) pH and initial concentration and (b) adsorbent dose and initial concentration on the percentage removal of Pb(II).
3.3 Adsorption isotherms
The equilibrium data for the uptake of Pb(II) onto TSA@)amine modified SiO2 were applied to Langmuir, Freundlich, and Temkin isotherm models for proper description of the nature of interaction between Pb(II) and the adsorbent. Table 4 shows the nonlinear equations of the studied isotherm models. Error functions such as ARED, SSE, SAE and χ2 were calculated to validate the best fit isotherm model (Table 4). The nonlinear isotherm parameters were computed by using Microsoft Excel SOLVER function spread sheet method (Rahman and Nasir, 2018) and results are presented in Table 4. The nonlinear fit(qe (mg/g) predicted versus Ce (mg/L)) of Langmuir, Freundlich and Temkin, models are presented in Fig. 2(a)–(c), respectively. qe: experimental adsorption capacity(mg/g),
: calculated adsorption capacity (mg/g),
concentration of Pb (II) in the solution phase at equilibrium (mg L−1),
: Langmuir isotherm constant (L/mg),
&
are Freundlich isotherm constants,
&bT are Temkin isotherm constants related to equilibrium binding constant and adsorption heat, respectively. *qe = 92.502, 94.396, 96.687, 97.021 mg/g at 300, 305, 310 and 315 K, respectively (Contact time = 50 min; pH = 6.0; adsorbent dose = 0.20 g).
Isotherm Model
Nonlinear equation
Temp (K)
Parameters
Error function
qe (mg/g)
KL
R2
ARED
SSE
SAE
χ2
Langmuir
300
96.131
0.442
0.9980
0.392
13.170
3.629
0.142
305
99.156
0.574
0.9950
0.504
22.658
4.760
0.240
310
104.217
0.831
0.9920
0.779
56.701
7.530
0.586
315
109.478
1.312
0.9920
1.284
155.177
12.457
1.600
Freundlich
KF
n
300
92.466
33.113
1.919
0.9992
3.892 × 10⁻⁴
0.001
0.036
1.081 × 10⁻⁵
305
94.324
39.513
1.996
0.9994
7.627 × 10⁻⁴
0.005
0.072
5.296 × 10⁻⁵
310
96.409
53.094
2.001
0.9997
2.875 × 10⁻³
0.077
0.278
7.963 × 10⁻⁴
315
97.301
58.221
2.137
0.9998
2.886 × 10⁻³
0.078
0.280
8.03 × 10⁻⁴
Temkin
AT
bT
300
92.359
3.158
84.493
0.9992
1.546 × 10⁻³
0.020
0.143
2.162 × 10⁻⁴
305
94.111
3.655
81.321
0.9993
3.019 × 10⁻³
0.081
0.285
8.580 × 10⁻⁴
310
96.229
5.525
77.974
0.9995
4.737 × 10⁻³
0.210
0.458
2.172 × 10⁻³
315
97.528
6.299
76.114
0.9998
5.648 × 10⁻³
0.257
0.507
2.649 × 10⁻³
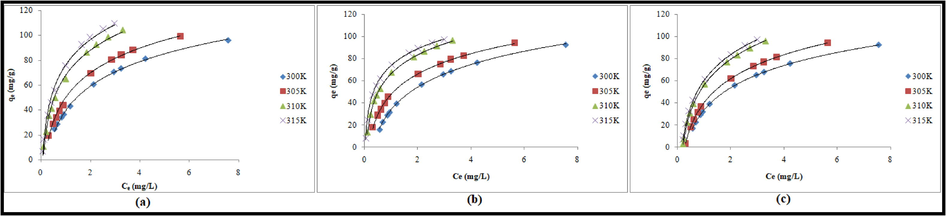
Nonlinear (a) Langmuir, (b) Freundlich and (c) Temkin isotherm plots for the adsorption of Pb (II) onto TSA@amine modified SiO2.
The maximum capacities calculated from Langmuir isotherm were 96.131, 99.156, 104.217 and 109.478 mg/g at 300, 305, 310 and 315 K, respectively. The affinity between TSA@)amine modified SiO2 and Pb(II) was evaluated from the Langmuir isotherm constant (
using dimensionless separation factor,
which is defined by Eq. (7) (Rahman and Haseen, 2015):
Where is the initial concentration of Pb(II). For adsorption to occur favourably, it is required that 0< < 1.In this study, the values of were in the range of 0.022–0.184, 0.017–0.148, 0.012–0.107 and 0.008–0.071 at 300, 305, 310 and 315 K, respectively which suggested the favorable uptake of Pb(II).
Freundlich isotherm model deals with the multilayer adsorption of solute onto the adsorbent surface. In this model, the parameter 1/n is related to the degree of surface heterogeneity. The small value of 1/n denotes the more heterogeneous surface while a value near unity suggested that the adsorbent has more homogeneous surface (Chen et al., 2007). The values of 1/n obtained for adsorption of Pb(II) onto TSA@)amine modified SiO2 were 0.521, 0.501, 0.499 and 0.468 at 300, 305, 310 and 315 K, respectively which indicated that the involvement of heterogeneous surface of adsorbent.
Temkin isotherm model assumes that the free energy of adsorption is a function of surface coverage and indicates the adsorbate/adsorbent interaction. The values of were in the range of 3.158–6.299 at the studied temperatures. The values of bT,heat of adsorption, were 84.493, 81.321, 77.974 and 76.114 J/mol at 300,305, 310 and 315 K, respectively. The positive values of bT demonstrated the endothermic nature of adsorption process.
All studied isotherm models exhibit high correlation coefficient (R2 > 0.990) but the best fitting model cannot be judged accurately based on R2 values only. The maximum adsorption capacities evaluated from Langmuir isotherm model were not closely related to the experimental adsorption capacities. The adsorption capacities obtained from Freundlich and Temkin models were near to the experimental values at all the studied temperatures. Additionally, the values of error functions such as ARED, SSE, SAE and χ2 were found to be lowest for Freundlich model in comparison to those obtained for Temkin and Langmuir models at 300, 305, 310 and 315 K. Therefore, it was suggested that both Freundlich and Temkin isotherm models are capable to interpret the uptake of Pb(II) ions onto TSA@amine modified SiO2. Further, the applicability of Freundlich isotherm model suggested that multilayer adsorption of Pb(II) ions occurred on heterogeneous surface of TSA@amine modified SiO2 and Temkin model revealed the interaction between Pb(II) ion and active surface sites of the adsorbent.
3.4 Adsorption kinetics
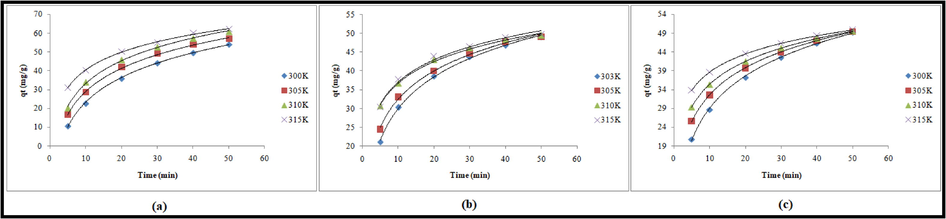
Kinetic models such as the pseudo-first order, pseudo-second order, Elovich, and double exponential models were used to study the adsorption kinetic data. The nonlinear equations of pseudo-first order and pseudo-second order kinetic models are presented in Table 5. Nonlinear regression analysis (Rahman and Nasir, 2017, 2020) was performed to determine the kinetic parameters of pseudo-first and pseudo-second order models (Table 5). Fig. 3(a) and (b) show nonlinear fit of pseudo-first and pseudo-second order models using the predicted qt values, respectively. The values of pseudo first order rate constant (
) were found to be 0.046, 0.062, 0.107 and 0.201 min−1 at 300 , 305, 310 and 315 K, respectively which indicated that the uptake of Pb(II) increased with increasing temperature. On the other hand, the values of pseudo second order rate constant (
) varied over the range 0.002–0.006 g/mg/min as the temperature increased from 300 to 315 K. qe and qt are adsorption capacities of adsorption (mg/g) at equilibrium and time t, respectively. k1; rate constant (min−1) of the model (PFO), k2; PSO rate constant (g/mg/min), α; initial adsorption rate (mg/g min) and β; desorption constant (mg/g) and activation energy for chemisorption,*qe = 49.01, 49.24, 49.51 and 49.73 mg/g at 300, 305, 310 and 315 K, respectively (C0 = 50 mg/L; pH 6.0; contact time = 50 min; adsorbent dose = 0.2 g; volume = 20 mL).
Kinetic model
Nonlinear equation
Temp (K)
Parameters
Error function
*qe (mg/g)
k1(min−1)
R2
ARED
SSE
SAE
χ2
Pseudo-first order(PFO)
300
54.09
0.046
0.9990
0.104
25.776
5.077
0.526
305
56.94
0.062
0.9990
0.156
59.290
7.700
1.204
310
60.81
0.107
0.9982
0.228
127.667
11.299
2.578
315
62.12
0.201
0.9979
0.249
153.537
12.391
3.088
Pseudo-second order (PSO)
k2 (g/mg/min)
300
49.11
0.002
0.9991
0.002
0.008
0.093
1.764 × 10⁻⁴
305
49.11
0.003
0.9991
0.003
0.016
0.127
3.276 × 10⁻⁴
310
49.51
0.005
0.9990
0.000
0.000
0.002
0.000
315
49.78
0.006
0.9990
0.000
0.002
0.048
0.463 × 10⁻⁴
Elovich
α
β
300
49.244
9.701
0.073
0.9990
0.004
0.053
0.231
0.001
305
49.377
21.010
0.092
0.9991
0.003
0.019
0.140
0.004
310
49.600
45.999
0.112
0.9997
0.002
0.008
0.087
1.529 × 10⁻⁴
315
49.951
169.387
0.142
0.9994
0.004
0.050
0.224
0.001
Nonlinear (a) pseudo-first order, (b) pseudo-second order and (c) Elovich kinetic plots for the adsorption of Pb (II) onto TSA@amine modified SiO2.
It was observed that the values of R2 were >0.990 for both pseudo-first order and pseudo second order kinetic models over the temperature range 300–315 K. The suitability of kinetic model cannot be decided on the basis of R2values only. The capacities obtained from pseudo-first order model were 54.09, 56.94, 60.81 and 62.12 mg/g corresponding to 300, 305, 310 and 315 K, respectively and these values deviated from the experimentally determined adsorption capacities (49.01, 49.24, 49.51 and 49.73 mg/g corresponding to temperatures 300, 305, 310 and 315 K). On the other hand, the values of adsorption capacity computed from pseudo second order kinetic model were comparable at studied temperatures. Moreover, the values of error functions were very low for pseudo-second order model as compared to pseudo-first order model. Therefore, it is concluded that the uptake of Pb(II) on the heterogeneous surface of TSA@amine modified SiO2 was accurately demonstrated by pseudo-second order model. Further, it is suggested that chemisorption is also involved in the uptake of Pb(II) ions.
To validate the uptake of Pb(II) onto heterogeneous surface of TSA@amine modified SiO2 as a chemisorption process kinetic data were fitted to Elovich model (R2 > 0.99). The nonlinear regression analysis of Elovich equation yielded the kinetic parameters and results are presented in Table 5. The nonlinear fitting of Elovich model is shown in Fig. 3c. Nonlinear regression of Elovich equation showed high values of R2with low values of ARED, SSE, SAE and χ2over the temperature range 300–315 K which demonstrated the chemical nature of adsorption process.
3.5 Double-exponential model
Wilczak and Keinath (1993) have applied the double exponential model to explain the uptake of Cu(II) and Pb(II) onto activated carbon. This model suggested the involvement of two steps namely rapid and slow stages in the adsorption process. Rapid phase of the model is due to the external mass transfer of solute from bulk solution to the adsorbent surface where it interacts with the binding sites whereas slow stage is due to the intraparticle diffusion. Similarly, Rahman and Nasir (2020) have suggested that the upatake of acetaminophen by the adsorbent occurred in two stages which was validated by double exponential model. Double exponential model is expressed by Eq. (8):
where D1 and KD1 are the rapidly adsorbed fraction of the solute (mg/L) and the rate constant of rapid step (min−1), respectively. D2 and KD2 are slowly adsorbed fraction of solute and rate constant of slow step of adsorption. M denotes the mass of adsorbent (g/L). The fraction of solute adsorbed in rapid and slow steps and their corresponding rate constants can be determined by the following assumption.
When KD1≫ KD2 then slow step contributes to overall kinetics and Eq. (8) is reduced to:
Eq. (9) can be linearized as:
The values of D2 and KD2were computed from ln (qe- qt) versus t plot. The values of D1 and KD1 can be calculated using Eq. (11):
The values of KD1 and KD2are not able to illustrate the exact quantification of the rapid and slow steps of the sorption. Therefore, the fraction of solute adsorbed in rapid (RF) and slow (SF) stages can be computed using Eqs. (12) and (13):
The kinetic parameters for both slow and rapid steps were determined from the plots of ln{qe-qt-(D2/M)exp(-kD2 t)} vs t (Fig. 4) and presented in the Table 6. It was found that the D1 increases whereas D2 decreases with increasing temperature. The difference between the KD2 (0.104–0.100) and KD1 (0.110–0.121) is not high, indicating the importance of both slow and rapid steps at all temperatures. The values SF (37.120–30.432) and RF (62.026–69.568) confirmed that major fraction of Pb(II) was absorbed in the rapid step due to the interaction with the active sites available on the adsorbent surface. In the slow step, the intraparticle diffusion is involved in the adsorption process. From these observations, it was concluded that both chemical and physical interactions were responsible for adsorption of Pb(II) ontoTSA@amine modified SiO2. Similar results were reported for the adsorption of Th(IV) onto amino group functionalized titanosilicate (Milani and Karimi, 2017). (C0 = 50 mg/L; pH 6.0; adsorbent dose = 0.2 g; volume = 20 mL).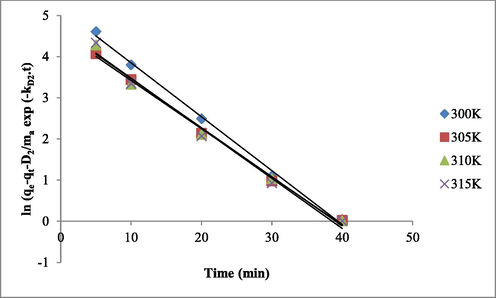
Double exponential plots of ln{qe-qt-(D2/M)exp(-kD2 t)} vs t.
Tmp. (K)
Parameters
Slow step
Rapid step
D2 (mg/L)
KD2 (min−1)
R2
SF (%)
D1 (mg/L)
KD1 (min−1)
R2
RF (%)
300
0.581
0.104
0.9980
37.120
0.949
0.110
0.9934
62.026
305
0.541
0.102
0.9950
35.780
0.971
0.116
0.9917
64.219
310
0.467
0.101
0.9920
32.207
0.983
0.117
0.9904
67.793
315
0.437
0.100
0.9921
30.432
0.999
0.121
0.9924
69.568
3.6 Thermodynamics of adsorption
Thermodynamic parameters for the uptake of Pb(II) onto TSA@amine modified SiO2 were calculated using the values of thermodynamic equilibrium constant (
) at different temperatures. The values of ΔG°, ΔH° and ΔS° were evaluated using Eqs. (14), (15) and (16) (Rahman and Varshney, 2020).
where R and T are the universal gas constant (8.314 J/mol/K) and temperature (Kelvin), respectively. The value of can be calculated to become dimensionless by multiplying it by 1000 assuming the solution density 1 g/mL (Milonjic, 2007). The values of free energy change (ΔG0) were found to vary from −9.388 to −13.089 kJ/mol over the temperature range 300–315 K. The values of ΔH° and ΔS° were computed from linear plot of versus (Fig S2; Supplementary information). The positive values of enthalpy change (ΔH° = 65.381 kJ/mol) and entropy change (ΔS° = 0.249 kJ/mol) indicated the endothermic nature of adsorption of Pb(II) onto TSA@amine modified SiO2 and enhanced randomness at adsorbent/liquid interface.
4 Conclusions
The uptake of Pb(II) onto TSA@)amine modified SiO2 was studied in batch mode and the value of qe was 92.50 mg/g at 300 K. The equilibrium data fitted well to the Freundliuch isotherm model with R2 > 0.99 and the value of qe calculated from the model (92.45 mg/g) agrees well with the experimental value. Pseudo-second order model was found to be the best fit model which suggested the involvement of chemical reaction in adsorption process. Elovich model validated the chemisorption process because the kinetic data fitted well to Elovich model with R2 > 0.99. Double exponential model indicated that the adsorption occurred in two stages; rapid stage involves the transport of solute from bulk solution to the surface of adsorbent to bind with the active sites and in the slow stage intraparticle diffusion takes place.
Acknowledgements
The authors extend their appreciation to the Deputyship for Research & Innovation, “Ministry of Education“ in Saudi Arabia for funding this research work through the project number IFKSURG-1435-010.
Declaration of Competing Interest
The authors declare that they have no known competing financial interests or personal relationships that could have appeared to influence the work reported in this paper.
References
- Removal of heavy metal ions by modified PAN/PANI-nylon core-shell nanofibers membrane: Filtration performance, antifouling and regeneration behavior. Chem. Eng. J.. 2018;351:1166-1178.
- [CrossRef] [Google Scholar]
- Adsorptive removal of Pb(II) ions from groundwater samples in Oman using carbonized Phoenix dactylifera seed (Date stone).J. King Saud Univ. Sci.. 2020;32:2931-2938.
- [CrossRef] [Google Scholar]
- Valorisation possibilities of exhausted biosorbents loaded with metal ions- a review. J. Environ. Manage.. 2018;224:288-297.
- [Google Scholar]
- Functionalized soy waste biomass – A novel environmental-friendly biosorbent for the removal of heavy metals from aqueous solution. J. Cleaner Prod.. 2018;197:875-885.
- [Google Scholar]
- Removal of Cu(II) from aqueous solution by adsorption onto acid-activated palygorskite. J. Hazard. Mater.. 2007;149:346-356.
- [Google Scholar]
- Catalytic activation and application of micro-spherical carbon derived from hydrothermal carbonization of lignocellulosic biomass: statistical analysis using Box-Behnken design. RSC Adv.. 2016;6:102680-102694.
- [Google Scholar]
- Sources and toxicological effects of lead on human health. Indian J. Med. Spec.. 2019;10:66-71.
- [Google Scholar]
- Lead: Assessing the environmental burden of disease at national and local levels, Geneva. World Health Organization (Environmental Burden of Disease Series. 2003;No. 2:DOI.
- [Google Scholar]
- Adsorption behavior of Hg (II), Pb (II) and Cd (II) on Duolite C-433: A synthetic resin. J. Colloid Interface Sci.. 2004;275:398-402.
- [Google Scholar]
- Baseline study of heavy metal pollution in a tropical river in a developing country. Sains Malaysiana. 2020;49:729-742.
- [CrossRef] [Google Scholar]
- Removal of toxic metal ions by macroacyclic ligands via liquid-liquid extraction technique. Sep. Sci. Technol. 2020
- [CrossRef] [Google Scholar]
- Optimization using the response surface methodology for adsorption of polychlorinated biphenyls (PCBs) from transformer oil bymagnetic CMCD-Fe3O4@SiO2 nanoparticles. Mater. Chem. Phys.. 2020;252:123195
- [CrossRef] [Google Scholar]
- Lead toxicity: Health hazards, influence on food chain, and sustainable remediation approaches. Int. J. Environ. Res. Public Health. 2020;17:2179.
- [CrossRef] [Google Scholar]
- Isotherm parameters for basic dyes onto activated carbon: comparison of linear and nonlinear method. J. Hazard. Mater.. 2006;129:147-150.
- [Google Scholar]
- Lead seasonality in humans, animals, and the natural environment. Environ. Res.. 2020;180:108797
- [CrossRef] [Google Scholar]
- Synthesis, characterization and sorption characteristics of a fibrous organic-inorganic composite material. Adv. Sci. Lett.. 2012;17:136-142.
- [CrossRef] [Google Scholar]
- Zirconium(IV) phosphosulphosalicylate as an important lead(II) selective ion-exchange material: Synthesis, characterization and adsorption study. Adv. Sci. Lett.. 2012;17:184-190.
- [Google Scholar]
- Isotherm, kinetic and thermodynamic studies for Th(IV) sorption by amino group-functyionalizedtitanosilicate from aqueous solutions, Korean. J. Chem. Eng.. 2017;34:1159-1169.
- [Google Scholar]
- A concidration of the correct calculation of thermodynamic parameters of adsorption. J. Serb. Chem. Soc.. 2007;72:1363-1367.
- [Google Scholar]
- The improved methods of heavy metals removal by biosorbents: A review. Environ. Pollut.. 2020;258:113777
- [CrossRef] [Google Scholar]
- Equilibrium modeling, kinetic and thermodynamic studies on adsorption of Pb (II) by a hybrid inorganic-organic material: Polyacrylamide zirconium (IV) iodate. Ind. Eng. Chem. Res.. 2014;53:8198-8207.
- [Google Scholar]
- Development of polyacrylamide chromium oxide as a new sorbent for solid phase extraction of As (III) from food and environmental water samples. RSC Adv.. 2015;5:7311-7323.
- [Google Scholar]
- Cyclic tetra [(indolyl)-tetramethyl]-diethane-1,2-diamine (CTet) impregnated hydrous zirconium oxide as a novel hybrid material for enhanced removal of fluoride from water samples. RSC Adv.. 2015;5:39062-39074.
- [Google Scholar]
- Development of poly-o-toluidine zirconium (IV) ethylenediamine as a new adsorbent for nitrate: Equilibrium modeling and thermodynamic studies. J. Ind. Eng. Chem.. 2015;25:272-279.
- [Google Scholar]
- Nitrate removal using poly-o-toluidine zirconium (IV) ethylenediamine as adsorbent: Batch and fixed-bed column adsorption modeling. J. Water Process Eng.. 2016;9:254-266.
- [Google Scholar]
- Synthesis and characterization of polyacrylamide zirconium(IV) iodate ion- exchanger: Its application for selective removal of lead(II) from wastewater, Arabian. J. Chem.. 2017;10:S1765-S1773.
- [Google Scholar]
- Development of Zr(IV) – doped polypyrrole/zirconium(IV) iodate composite for efficient removal of fluoride from water environment. J. Water Process Eng.. 2017;19:172-184.
- [Google Scholar]
- Application of Box-Behnken design and desirability function in the optimization of Cd (II) removal from aqueous solution using poly(o-phenylenediamine)/hydrous zirconium oxide composite: equilibrium modeling, kinetic and thermodynamic studies. Environ. Sci. Pollute. Res.. 2018;25:26114-26134.
- [Google Scholar]
- Rahman, N., Nasir, M., 2019.N-(((2-((2-aminoethyl)amino)ethyl)amino)methyl)-4-sulfamoylbenzamide impregnated hydrous zirconium oxide as a novel adsorbent for removal of Ni(II) from aqueous solutions: Optimization of variables using central composite design. ACS Omega, 4, 2823-2832.
- Experimental design approach for optimization of Pb(II) removal from aqueous solution using poly-o toluidine/stannic(IV) triethanolamine as adsorbent. Environ. Technol. Innovat.. 2020;17:100634
- [Google Scholar]
- Facile Synthesis of thiosalicylic acid functionalized silica gel for effective removal of Cr (III): Equilibrium modeling, kinetic and thermodynamic studies. Environ. Nanotechnol. Monit. Manag.. 2020;14:100353
- [CrossRef] [Google Scholar]
- Effective removal of acetaminophen from aqueous solution using Ca (II)-doped chitosan/β-cyclodextrincomposite. J. Mol. Liq.. 2020;301:112454
- [Google Scholar]
- Assessment of ampicillin removal efficiency from aqueous solution by polydopamine/zirconium (IV) iodate: Optimization by response surface methodology. RSC Adv.. 2020;10:20322-20337.
- [Google Scholar]
- Optimization of lead removal in exhausting Manilkarazapota based activated carbon: Application of response surface methodology. Environ. Technol.. 2020;41:2478-2493.
- [CrossRef] [Google Scholar]
- Chemical coagulation process for the removal of heavy metals from water: A review. Desalination Water Treat.. 2016;57:1733-1748.
- [CrossRef] [Google Scholar]
- Reverse osmosis removal of heavy metals from wastewater effluents using biowaste materials pretreatment. Pol. J. Environ. Stud. 2019;28:337-341.
- [CrossRef] [Google Scholar]
- Kinetics of sorption and desorption of copper (II) and lead (II) on activated carbon. Water Environ. Res.. 1993;65:238-244.
- [Google Scholar]
- Total concentrations and sources of heavy metal pollution in global river and lake water bodies from 1972 to 2017. Glob. Ecol. Conser.. 2020;22:00925.
- [CrossRef] [Google Scholar]
Appendix A
Supplementary data
Supplementary data to this article can be found online at https://doi.org/10.1016/j.jksus.2020.101232.
Appendix A
Supplementary data
The following are the Supplementary data to this article:


