

Translate this page into:
Effects of land use change on water availability and water efficiency in the temperate basins of south-central Chile
⁎Corresponding author. carlos.esse@uautonoma.cl (Carlos Esse)
-
Received: ,
Accepted: ,
This article was originally published by Elsevier and was migrated to Scientific Scholar after the change of Publisher.
Peer review under responsibility of King Saud University.
Abstract
Background
Forest ecosystems provide services that are important for human use; one of the most critical ecosystem services is the provision and regulation of water. Basins with high forest improves hydrological functionality by promoting reduction in surface runoff, increase infiltration and aquifer recharge, and ensures base flow regulation amongst others. On the other hand, the conversion towards highly anthropized productive systems is usually accompanied by precarious environmental management that alters the hydrological cycle and reduction in water quality in basins.
Aim
The goal of this study was to analyze land use changes and their effect on water efficiency index (WEI) in three sub-basins.
Methodology
The methodology included a multi-temporal analysis of satellite images to identify land uses, also the use of SWAT (Soil and Water Assessment Tool) model for hydrological analysis in each sub-basin, information needed for calculating the WEI.
Results
The results revealed the existence of no significant difference in terms of WEI between the sub-basins with predominant tree cover of native or artificial, being higher (0.89) than the WEI values reported by the sub-basin with agricultural land use (0.65). It is concluded that hydrological functions are more efficient in basins with forest cover, made up of native or exotic species, than agricultural land use with annual crop rotations. The results contribute to decision making on public policies associated to the rural productive activities.
Concluded
Finally, we conclude the necessity of the promotion of forest plantation management techniques that avoid clear-cutting and multiple rotations in basin headwaters and riparian areas.
Keywords
Land use
Land cover
Native forest
Mixed forest
SWAT
Clear-cutting

1 Introduction
Forest ecosystems offers several goods and services that are important for human use; these include the provision and regulation of water distribution in the environment (Esse et al., 2019). Furthermore, it promotes soil water infiltration, maintains gradual release of streamflow, regulates surface water runoff thereby reducing erosion risks (Huber et al., 2008). Additionally, it contributes to recharging aquifers and maintenance of baseflow, especially in summer seasons. In hydrological basins that are coupled with forest land uses, the spatial distribution, and composition of forest structures are important elements that are required in a functional ecosystem in addition to water resources (Esse et al., 2019). Forest cover loss can have profound implications for water resources because the removal of canopy effect and ability to intercept raindrops leads to increased runoff and low infiltration because the infiltration rate exceeded.
The conversion of natural landscapes into other productive systems like agriculture, forest reserves, and urban areas, affects soils integrity in terms of nutrient cycling and regeneration of native species (Gerber, 2011; Giri and Qiu, 2016; Esse et al., 2019). Other examples of activities which initiate surface runoff and reduced water quality include poor land and water use in agriculture, livestock, forestry, and urbanization (Miserendino et al., 2011; Pizarro et al., 2019). Accordingly, Gerber (2011) reported that, one of the major conflict areas which impact local communities is the establishment of forest plantations, displacement of households and agricultural lands which limits access to natural resources.
Studies in southern Chile have shown that, land use change from native forest to exotic plantations in small watersheds (<100 ha) reduces surface runoff, mainly due to increased evapotranspiration (Little et al., 2009; Huber et al., 2008). However, these studies do not consider all key biophysical variables like climate, soil and geomorphology to obtain accurate information about those critical factors which determines water regime. This can be achieved by integrating spatial GIS tools like SWAT (Soil and Water Assessment Tool) model (Arnold et al., 1998) and VISUAL-BALAN, WEAP (Raskin, 1988). These tools allow surface runoff analysis at different spatial and temporal scales and integrate complex interactions between geomorphological factors like soil type, vegetation, land use, precipitation, temperature, air humidity, wind, among others (Little et al., 2009; Rumph and Molina-Navarro, 2021).
The basins in south-central Chile are in the Valdivian Temperate Rainforest Ecoregion (Myers et al., 2000). However, forests have historically been subject to timber extraction, deforestation due to advancement in agriculture, livestock, and forestry technologies, and the introduction of exotic species which compete directly with native species and modify ecological processes (Lara et al., 2009; Aguayo et al., 2016). Afforestation and reforestation using exotic species are activities which has been actively promoted by the Chilean government for more than 40 years (D.L N° 701). This generated negative views from certain sectors of society and local actors (Esse et al., 2019; Sepúlveda-Varas et al., 2019), who believe that much of the area currently covered by forest monocultures correspond to areas previously covered by native forest like headwaters, riverbanks, and estuaries. Indeed, the growth of the forestry industry in Chile between 1995 and 2009 presented one of the highest annual deforestation rates (49,020 ha) and forestation (53,610 ha) compared to the forest plantations in South America (FAO, 2010).
As a result, the forestry sector and its forestry practices have been identified as being responsible for decreased surface runoff in bains located in south-central part of the country (Aguayo et al., 2016), as well as altering the quality of the surrounding water bodies. There are several studies on forestry plantations and their adverse effects in the environments where they are established (Aguayo et al., 2016).
The reduction in water yield in regions with fast-growing forest plantations is the main evidence of the deficiency in the land use policies (Jackson et al., 2005), in this scenario Lara et al., (2009) proposed the Water Efficiency Index (WEI) for understand spatial and temporal variations in land use and changes of surface runoff. In Chile, the reduction in basins water resources is attributed to the forestry policy because, the monoculture nature of the industry generates conflicts between local foresters and farmers, because foresters reject crops and prefer forest plantations of Pinus radiata D. Don and Eucalyptus spp. (Huber et al., 2008, Saavedra and Sepúlveda-Varas, 2016; Esse et al. 2019).
Accordingly, it is possible that land use changes in basins may modify surface water availability. Therefore, the objective of this study was to analyse land use changes and their effect on surface water availability in sub-basins with different land uses. Accordingly, the changes in land cover in three sub-basins and water efficiency as a function of different land use changes scenarios were analysed. The results seek to evaluate the functionality of the ecosystem areas protected by native forests based on the production and regulation of the water balance, as an input for generating public policies, that allow defining conservation and management measures for river basins.
2 Materials and methods
2.1 Study area
The study catchment area is part of the upper Quepe river basin (540 km2), located in the Andes foothills zone of south-central Chile (38°40′ S – 71°45′ W). The main river is the Quepe river, it has a 110 km in length and at the beginning, the annual average flow rate is 35 m3 s−1. If we compare the specific flow rate, this river has 88 L s−1 km−2, 53 L s−1 km−2, and 40 L s−1 km−2 in the upper, middle and low parts, respectively (DGA, 2004). The middle and low elevations of the study area experience rainfall events while higher elevations areas experience snow-rainfall (Santibañez, 2017). Generally, the zone is characterized by warm rainy and cold rainy temperate climates with Mediterranean influence; the region also experiences low temperatures averaging 6.5 °C and annual rainfall over 3800 mm (Santibañez, 2017). The soil is deep, well-drained silt-loam with nil to slight erosion over the whole area (CIREN-CORFO, 2002).
Three sub-basins with different land uses have been identified with the first one covered almost entirely by native forest (NF) species (36.4 km2), the second (Mixed) which is a mixed land use by native forest and plantations (16.2 km2), while natural grasslands, and agricultural areas and a third sub-basin of mostly agricultural use (Agr) (23.5 km2) (Fig. 1). Three sub-basins were selected considering several productive land uses, these sub-basins are part of the Quepe river basin.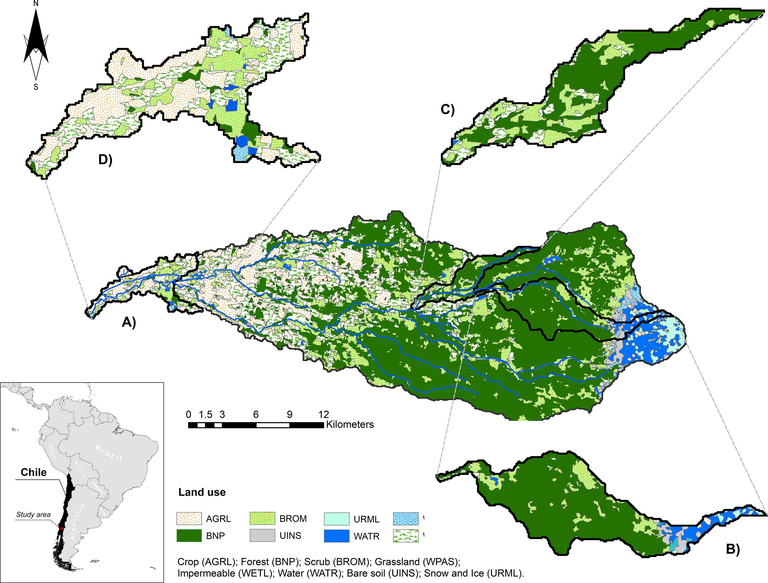
Study area. A) Mediterranean region of central-southern Chile, Quepe river basin; B) Native forest sub-basin; C) Mixed sub-basin; D) Agricultural sub-basin.
2.2 Multitemporal analysis of land cover change
Land cover maps were generated for the 2001–2002 and 2017–2018 seasons using Landsat 5, Landsat 7, and Landsat 8 satellite images, using a classification model trained from the 2014–2015 season and then implemented on the other seasons (Fig. 2). In this work, the concept of season is considered as the range of dates from winter (June) to ending summer (March). The classification model was trained considering ground truth data from the land cover map produced by Zhao et al. (2016) and described in Hernández et al. (2016).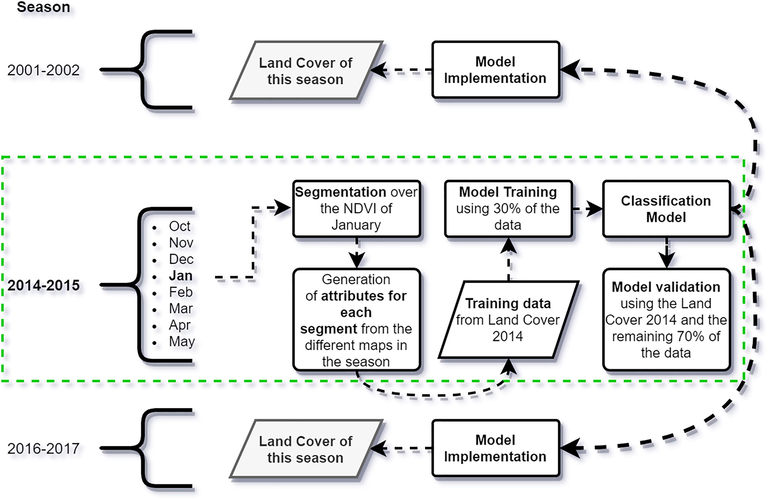
Conceptual diagram for the generation of the land cover maps.
The classification model was based on the RusBoost algorithm that uses a mixture of random under-sampling (RUS) procedures and standard boosting from AdaBoost, allowing work with imbalanced classes (Freund, 2009). Furthermore, the classification was carried out considering a similar approach that GEOBIA (Geographic Object-Based Image Analysis), where, in brief, the model learns from segments instead pixels, which have a better performance that classical pixel approach (Hay and Castilla, 2008; Vieira et al., 2012).
The first step was to generate segments in the image, which was carried out from the segmentation of the NDVI (Normalized Difference Vegetation Index) image from January 4, 2015, using a super-pixel algorithm, specifically the SLIC (Simple Linear Iterative Clustering) (Achanta et al., 2012).
The descriptor used in the training model was the temporal NDVI, specifically the weekly NDVI for each segment, which was generated interpolating the mean NDVI in each date to a weekly scale using the cubic spline algorithm (Dyer and Dyer, 2001). Finally, the weekly attribute of NDVI of each segment was smoothed with Gaussian filter (low pass filter) hoping to avoid extreme values. This procedure allows to use the continuum temporal attributes of the 2014–2015 season on other seasons, independently of the availability of satellite images in exactly the same dates. The range of dates in the different seasons was limited between July and March, established from the availability in the training season.
The satellite images were preprocessed, considering atmospheric correction by the DOS method (Chavez, 1988) and gap filling for Landsat 7 pixels by spatial interpolation using the gdal_fillnodata.py algorithm (GDAL; http://www.gdal.org). The generated classes were: (1) Crop (AGRL), (2) Forest (BNP), (3) Scrub (BROM), (4) Grassland (WPAS), (5) Impermeable (WETL), (6) Water (WATR), (7) Bare soil (UINS), (8) Snow and Ice (URML).
Details of the dates of satellite images used in the training and classification processes are shown in the Table 1 in format “month/day/year”. The abbreviations L5, L7 and L8 refers to Landsat 5, Landsat 7 and Landsat 8 satellite, respectively.
Seasons
2001–2002
2014–2015
2017–2018
8/17/2001(L5)
7/12/2014(L7)
09/22/2017(L7)
9/2/2001(L5)
8/13/2014(L7)
11/25/2017(L7)
9/10/2001(L7)
9/30/2014(L7)
12/19/2017(L8)
10/12/2001(L7)
10/24/2014(L8)
12/27/2017(L7)
11/29/2001(L7)
11/25/2014(L8)
01/12/2018(L7)
12/7/2001(L5)
12/3/2014(L7)
01/28/2018(L7)
12/23/2001(L5)
12/11/2014(L8)
02/05/2018(L8)
1/16/2002(L7)
1/4/2015(L7)
02/13/2018(L7)
2/1/2002(L7)
1/12/2015(L8)
02/21/2018(L8)
3/5/2002(L7)
1/20/2015 (L7)
03/01/2018(L7)
3/29/2002(L5)
1/28/2015(L8)
03/25/2018(L8)
2/5/2015(L7)
2/13/2015(L8)
3/9/2015(L7)
3/17/2015(L8)
3/25/2015(L7)
2.3 Hydrological modeling
The hydrological analysis (Fig. 3) was performed using the SWAT model (Arnold et al., 1998) for ArcGIS 10.8.1 for the simulation of flow (m3) in the basin under two land cover scenarios: a) historical (2001) and b) current (2018). The daily rainfall variation was integrated into the SWAT database corresponding to the climate period 1979–2013. For the SWAT model, the hydrologic cycle is based on the water balance equation, given by Eq. (1).
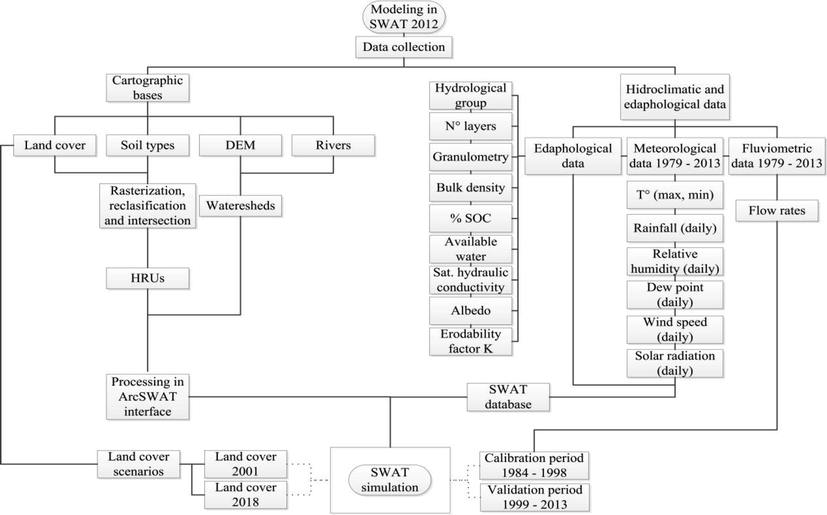
Methodology implemented for SWAT model in ArcSWAT software. In diagram DEM is Digital Elevation Model, HRUs is Hydrologic Response Units, % SOC is Soil Organic Carbon and T° is Temperature.
The soil type and its physical–chemical characteristics, such as depth (cm), texture (%), granulometry (%), bulk density (g cm−3), and organic carbon content (%), were obtained from CIREN-CORFO (2002). The hydrological group was estimated according to the U.S. Soil Conservation Service Curve Number method and the erodibility factor (K) using the equation proposed by Wischmeier and Smith (1978). Daily precipitation (mm), minimum and maximum temperature (°C), relative humidity (%), solar radiation (MJ m−2), and wind speed (m s−1) were obtained from Climate Forecast System Reanalysis (CFSR, 38 km per pixel resolution,
https://globalweather.tamu.edu/). This climate model provides optimized data for use in watershed models like SWAT and it represents a good option when lack of climate data is a problem (Fuka et al. 2013), as occurs with the absence and low consistency of this type of records in the available databases for Chile (Table 2). Crop Forest Scrub Grassland Impermeable Water Bare soil Snow and Ice
Type
Information
Period
Description
DEM
Grid (30 m)
2011
Digital Elevation Model
Land cover
Grid (30 m)
2001–2002 2017–2018
Soil data
Grid (30 m)
2002
Cartography and physical–chemical parameters.
Meteorological data
Daily
1979–2013
Extreme temperatures, rainfall, solar radiation, relative humidity, wind speed
Hydrological data
Average monthly
1979–2013
Observed discharge
The monthly average streamflow was extracted from the DGA-Chile (
https://snia.mop.gob.cl/BNAConsultas/reportes). Once the data were adjusted, a calibration process was carried out adjusting the observed versus simulated surface runoff. Later, validation was carried out to measure the predictive capacity with the parameters estimated in the calibration period, considering a different time. The subroutine of vegetal growth using the physiological parameters of the native species of Nothofagus genus was modified since they are the most representative of the study area (Table 3).
Category
Description
Units
BNP
EUCA
BIO LEAF
Radiation-use efficiency or biomass-energy ratio
%
0.50
0.30
BLAI
Maximum potential leaf area index
–
5.00
5.50
RDMX
Maximum root depth
m
2.50
4.00
CHTMX
Maximum canopy heigth
m
5.00
10.00
HVSTI
Harvest index for optimal growing conditions
–
0.05
0.76
T BASE
Minimum (base) temperature for plant growth
°C
10.00
0.00
Both processes were evaluated using the SWAT CUP software, with the SUFI-2 routine, which performs a sequential uncertainty adjustment. Goodness of fit and predictive capabilities was determined through the coefficient of determination (R2) (Zar, 2010), percent bias (PBIAS), and Nash-Sutcliffe Efficiency (NSE) (Nash and Sutcliffe, 1979).
2.4 Water efficiency analysis
The modified Water Efficiency Index (WEI), given by Eq. (2) developed by Lara et al., (2009) was used to establish spatial and temporal comparisons between current and past scenarios and estimate the effect of land cover changes on surface runoff in each sub-basin. The hydrological simulation model was for the calibration period 1984–1998 and validation period 1999–2013.
For each sub-basin, the monthly water efficiency index (WEI) was determined for the period 1984–2013, considering past sceneries (2001) and actual (2018) based on land cover, and looking for the effects of land cover on WEI. Subsequently, a Kruskal-Wallis test (non-parametric one-way analysis of variance) was applied to evaluate the significant differences (p < 0.05) between the defined land use change scenarios. Finally, multiple comparisons were made through Tukey's HSD test (p < 0.05) using the agricolae (Mendiburu, 2017) in R software.
3 Results
3.1 Land cover maps
The RusBoost algorithm created 7584 training objects for all classes. Classification accuracy of 76% was achieved, with the highest classification errors when the model misclassifies grasslands with scrubs and vice versa (Fig. 4). Forest cover classification accuracy was 82%.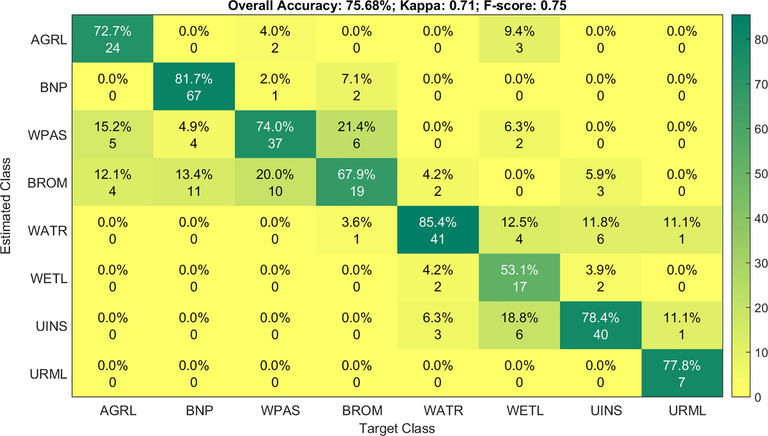
Confusion matrix, Kappa index and F-score validating the classification model in the 2014–2015 season. Percentage values in the main diagonal represent the Sensibility of each class, while the numbers below the Sensibility represent the number of segments in each situation.
3.2 Modelling sceneries
The major transitions of the NF sub-basin correspond to BNP, BROM, and WPAS classes. BNP presented the most considerable net change with 117 ha, obtaining the main surface gain from BROM (239 ha) and the largest loss at the same time (77 ha); in parallel, BROM changed to BNP 179 ha and gained 77 ha of the same. WPAS presented −184 ha of net change, the main change was to BNP (30 ha) and BROM (153 ha). In the Mixed sub-basin, BNP and BROM had the most considerable net change with 361 and 312 ha, respectively, obtaining the most massive area gains from WPAS, a category that ceded 288 ha to BNP and 360 ha to BROM, presenting a net balance of −644 ha in 2018. On the other hand, BROM showed the highest exchange rate dynamics, recording the highest movements of loss, gain, net change, and land use change in the sub-basin. In the Agricultural sub-basin, WPAS lost 879 ha of the total land, highlighting 387 ha to AGRL and 374 ha to BROM; WPAS was the coverage with the most significant net change with −660 ha, followed by AGRL, which losses 299 ha, 480 ha of gains and a net balance of 181 ha, the main contributions of land were received from WPAS and BROM. In turn, BROM presented a net change of 314 ha, obtaining the highest contributions from WPAS and AGRL. The change matrix shown that these changes had no effect on the simulations when comparing the discharges in the water balance.
3.3 Water efficiency index and statistical analysis
The goodness-of-fit indicators and predictive capabilities (Table 4), for the simulated streamflow, showed a low NSE efficiency between 1984 and 1998 (calibration period); however, the efficiency was high for the period 1999–2013. The simulations for each land cover change scenarios showed an increase of actual evapotranspiration in the NF sub-basin by 0.64%; for the Mix and Agr sub-basins a decrease was evidenced with values by 10.77% and 2.65%, respectively.
Indicators
Calibration (1984–1998)
Validation (1999–2013)
RSR
0.85
0.57
NSE
0.28
0.68
R2
0.63
0.76
PBIAS
40.50
14.90
In terms of water efficiency index (WEI), the NF sub-basin decreased by 0.05% the average volume of water at the sub-basin outlet. The Mix and Agr sub-basins showed an increase of 1.31% and 0.52% during 2001–2018, respectively (Table 5). SURQ: Surface runoff (mm); GWD: return flow to the main channel (mm); WYLD: water yield (mm)
Sub-basin
Scenario
SURQ
GWQ
WYLD
(mm)
(mm)
(mm)
NF
2001
29.24
570.46
1828.46
2018
29.30
624.92
1827.56
Balance
0.22%
9.55%
−0.05%
Mix
2001
80.26
1446.06
1805.81
2018
43.59
1350.85
1829.53
Balance
−45.69%
−6.58%
1.31%
2001
609.13
864.00
1521.46
Agr
2018
664.26
819.45
1529.34
Balance
9.05%
−5.16%
0.52%
The water efficiency index showed significant differences (p < 0.05) when comparing land use of each sub-basin (Fig. 5). Tukey's HSD test showed that the differences were given by the Agr sub-basin, which WEI average value of 0.62, as opposed to the values of 0.89 reached by the NF and Mix sub-basins, respectively.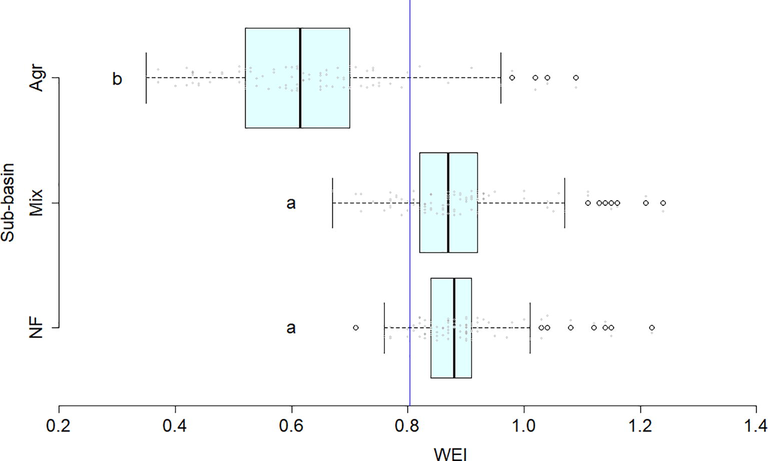
Differences in water efficiency index (WEI) in the NF, Mix, and Agr sub-basins. The blue vertical line indicates the average value. Different letters indicate significative difference (p < 0.05).
4 Discussions
Studies on land use change and hydrological analysis in basins are varied, most of them implemented in tropical and Mediterranean areas in Europe and Asia (Sirabahenda et al., 2020); however, studies in Mediterranean climates are typical of soil and climate zones in south-central Chile (Little et al., 2009). These studies are characterized by analyzing the effects of forest cover and plant species composition on runoff processes and maintenance of streamflow. However, few of them analyze the effect of forest plantations on water availability and, to a lesser extent, compare different land uses in terms of water efficiency.
This study showed that, the most significant land use change was in the sub-basin with mixed land use, where WPAS land use changed to BNP and BROM, increasing the area of native forest and exotic plantations. In this sub-basin, an increase in forestry activity was observed during the period when the “Decreto de Ley 701″ on Forestry Development was in effect (Lara et al., 2009; Saavedra and Sepúlveda-Varas, 2016). During this period (1974–2008), most of the area used for livestock became part of large land extensions covered by exotic plantations. In the NF sub-basin, the dominant species corresponds to Nothofagus dombeyi-(Mirb.) Oerst., which is considered a native species that play an essential role in maintaining streamflows and regulating the hydrological cycle (Esse et al., 2019). On the other hand, in the Mixed sub-basin, the main tree species correspond to a mixture between N. dombeyi, and the exotic species P. radiata and Eucalyptus spp., the last one being perceived by local actors as responsible for the decrease in streamflows and loss productivity of the site. The Agr sub-basin showed a reduction in WPAS and an increase in BROM and AGRL, indicating that the main productive activities are grains, such as wheat and oats. This activity generates a high demand for water resources given the crop rotation regime, especially in those areas where the cultivated area is large and continuous (Sirabahenda et al., 2020).
When comparing the water efficiency index of sub-basins with different land uses, a topic that considers the relationship between rainfall and surface runoff, the NF and Mixed sub-basins showed average efficiency values of 0.89 ± 0.08 and 0.89 ± 0.11 respectively, with no significant differences (p > 0.05). On the other hand, the Agr sub-basin showed highly significant differences (p < 0.05) for the previous one with a lower water efficiency index (0.62 ± 0.15). These results show that basins and sub-basins protected by forest land use are more efficient in terms of water, regardless of the species they are composed of, than those where the main productive activity are grains with annual crop rotations. These results are like those indicated by Pizarro et al., (2019) who studied the soil water consumption of native forest species and exotic plantations in the Mediterranean area of Chile. Sub-basins composed by native and exotic perennial species perform similar ecosystemic functions in the regulation of hydrological processes, such as interception and stem runoff, together with the structure and root depth facilitate water infiltration and percolation (Huber et al., 2008; Pizarro et al., 2019); however, fast-growing exotic species show higher evapotranspiration rates than native species such as N. dombeyi and others, which depending on their land cover, rainfall, geological and geomorphological characteristics can influence water balances, providing different characteristics for each sub-basin, which makes any comparison between them difficult (Huber et al., 2008). On the other hand, in basins and sub-basins for agricultural use established on less steep slopes, the hydrological processes are modulated by crop type and water demand, crop rotations, crop techniques, and irrigation technology, factors favoring the evapotranspiration, infiltration and erosion processes in the winter season (Martínez and Navarro, 2007).
This study showed that water balance was more efficient in sub-basins located in upper areas dominated by perennial tree species and exotic and native forests, which allows to conclude that water efficiency does not depend on tree species that make up the forest but on the hydrological functions. In this sense, it is important to consider multiple rotations of forest plantations that promote clear-cutting favoring soil erosion and disrupting the hydrological regulation processes. Therefore, it is necessary to evaluate different forest management schemes through SWAT modeling and generate scientific information that contributes to their implementation in current regulations and standards, considering water efficiency as an optimization function.
5 Conclusions
Water efficiency does not depend on the tree species that form the forest but on the implicit hydrological functions. For this reason, it is important to study the management alternative methods that replace consider the multiple rotations to which forest plantations are subjected that use clear-cutting as a harvesting technique, favoring soil erosion processes and altering hydrological regulation processes.
Acknowledgements
Carlos Esse is grateful to ANID Initiation Fondecyt No. 11160650 project, for the financing of this study for founding this study. Francisco Correa-Araneda is grateful to ANID Initiation Fondecyt No. 11170390. Rodrigo Santander-Massa acknowledges the financing of the fourth author's postgraduate studies by the Human Capital Training Fund No. 21150903. Pablo Saavedra acknowledges the financing to ANID Human Capital Training Fund No. 22200806. Patricio De los Ríos-Escalante and Francisco Encina-Montoya acknowledges to project MECESUP UCT 0804. Guillermo Figueroa-Muñoz acknowledges the financing to CONICYT-PFCHA/Magíster Nacional/2020-22200247 scholarship and M.I., and S.M.A. for their valuable suggestions.
Declaration of Competing Interest
The authors declare that they have no known competing financial interests or personal relationships that could have appeared to influence the work reported in this paper.
References
- Respuesta hidrológica de una cuenca de meso escala frente a futuros escenarios de expansión forestal. Rev. geogr. Norte Gd.. 2016;65:197-214.
- [Google Scholar]
- Large area hydrologic modeling and assessment: part I. Model development. J. American. Water. Resour. Assoc.. 1998;34(1):73-89.
- [Google Scholar]
- An improved dark-object subtraction technique for atmospheric scattering correction of multispectral data. Rem. Sens. Env.. 1988;24:459-479.
- [Google Scholar]
- CIREN-CORFO, 2002. Materiales y Símbolos, Proyecto Aerofotogramétrico CHILE/OEA/BID, Santiago.
- DGA, 2004. Análisis de disponibilidad de los recursos hídricos superficiales cuenca río Quepe. Departamento de Administración de Recursos Hídricos. S.D.T. N° 175. Dirección General de Aguas, Gobierno de Chile, Santiago de Chile.
- Esse, C., Santander-Massa, R., Encina-Montoya, F., De los Ríos, P., Fonseca, D., Saavedra, P., 2019. Multicriteria spatial analysis applied to identifying ecosystem services in mixed-use river catchment areas in south central Chile. Forest Ecosyst. 6, 25.
- FAO, 2006. Evapotranspiración del cultivo. Cuaderno Técnico 56 - Estudios FAO Riego y Drenaje. Primera Edición. Roma.
- FAO, 2010. Global forest resource assessment 2010. Main report, FAO Forestry Paper 163, Rome, Italy.
- Freund, Y., 2009. A more robust boosting algorithm. arXiv preprint.
- Using the Climate Forecast System Reanalysis dataset to improve weather input data for watershed models. Hydrol. Proc.. 2013;28:5613-5762.
- [Google Scholar]
- Conflicts over industrial tree plantations in the south: who, how and why? Glob. Environ. Change.. 2011;21:165-176.
- [Google Scholar]
- Understanding the relationship of land uses and water quality in Twenty First Century: a review. J. Environ. Manage.. 2016;173:41-48.
- [Google Scholar]
- Effect of Pinus radiata plantations on water balance in Chile. Hydrol. Proc.. 2008;22:142-148.
- [Google Scholar]
- Trading water for carbon with biological carbon sequestration. Science.. 2005;310:1944-1947.
- [Google Scholar]
- Assessment of ecosystem services as an opportunity for the conservation and management of native forest in Chile. For. Ecol. Manag.. 2009;258:415-424.
- [Google Scholar]
- Revealing the impact of forest exotic plantations on water yield in large scale watersheds in South-Central Chile. J. Hydrol.. 2009;374:162-170.
- [Google Scholar]
- Hidrología Forestal. El Ciclo Hidrológico (3era imp,). España: Universidad de Valladolid; 2007.
- Mendiburu, F., 2017. Tutorial de agricolae (Versión 1.2-8). Universidad nacional Agraria La Molina, Perú.
- Assessing land-use effects on water quality, in-stream habitat, riparian ecosystems and biodiversity in Patagonian northwest streams. Sci. Total Environ.. 2011;409:612-624.
- [Google Scholar]
- River flow forecasting through conceptional models. A discussion of principles. J. Hydrol.. 1979;10:282-290.
- [Google Scholar]
- Antecedentes de la relación masa forestal y disponibilidad hídrica en Chile. Uruguay: UNESCO en Montevideo; 2019.
- Raskin, P., 1988. WEAP, Water Evaluation and Planning System. Stockholm Environment Institute, U.S. Center, 11 Curtis Avenue, Somerville, MA 02144 USA.
- The importance of subsurface drainage on model performance and water balance in an agricultural catchment using SWAT and SWAT MODFLOW. Agric. Water Manag.. 2021;255:107058
- [Google Scholar]
- Systematic transitions in land use and land cover in a pre-Andean subwatershed with high human intervention in the Araucania region, Chile. Cien. Inv. Agr.. 2016;43(3):396-407.
- [Google Scholar]
- Santibañez, F., 2017. Atlas agroclimático de chile, estado actual y tendencias del clima: tomo IV. FIA – Universidad de Chile, Chile.
- Evolución temporal y espacial de uso de suelo en subcuenca preandina, región de la Araucanía, Chile: herramienta para la sustentabilidad productiva de un territorio. Rev. geogr. Norte Gd.. 2019;72:9-25.
- [Google Scholar]
- Assessment of the effective width of riparian buffer strips to reduce suspended sediment in an agricultural landscape using ANFIS and SWAT models. Catena. 2020;195:104762
- [Google Scholar]
- Wischmeier, W., Smith, D., 1978. Predicting rainfall erosion losses. A guide to conservation planning, USDA Handbook no. 537.
- Zar, J.H., 2010. Biostatistical Analysis, Prentice Hall Inc, Upper Saddle River, New Jersey, U.S.A.
- Detailed dynamic land cover mapping of Chile: accuracy improvement by integrating multi-temporal data. Rem. Sens. Env.. 2016;183:170-185.
- [Google Scholar]


