

Translate this page into:
Effect of supplemental selenium in fish feed boosts growth and gut enzyme activity in juvenile tilapia (Oreochromis niloticus)
⁎Corresponding author at: Department of Fisheries and Aquaculture, University of Veterinary and Animal Sciences, Lahore, Pakistan and Department of Bioscience and Biotechnology, Chungnam National University, South Korea physioatique@gmail.com (Usman Atique),
-
Received: ,
Accepted: ,
This article was originally published by Elsevier and was migrated to Scientific Scholar after the change of Publisher.
Abstract
The investigations on the role of dietary micronutrient(s), such as selenium, has recently emerged as the fixate of researchers, notably in aquaculture. Our study aimed at investigation of the impact of dietary selenium on growth and digestive enzymes (DE) activity in juvenile tilapia. Three iso-nitrogenous diets with a sequential increase of selenium doses viz. 2 (T1), 4 (T2), and 8 (T3) mg/kg of fish feed, and selenium-deficient (T4) feed were dispensed in independent treatments. The juvenile fish growth and enzyme activities showed direct links to selenium dose. The T1 illustrated significantly higher (P < 0.05) accomplishments in average weight (21.28 ± 5.62 g), length (11.14 ± 1.041 cm), FRC (1.46 ± 0.23), and SGR (2.61 ± 0.07). The intestinal enzymes manifested selenium dose-linked activities with T1 as 2.41 ± 1.34 and 107.66 ± 2.54 of amylase and lipase, respectively. These enzymatic activities approximated with the fish body weight and length gains as well as growth indices (FCR, SGR) in T1. The linear projections further reinforced that selenium dose of 2 mg/kg (T1) is the most suitable dose for sustainable and profitable fish growth and enhanced activity of DE. In conclusion, selenium strongly impacted the juvenile growth, FCR, SGR and enzyme activity.
Keywords
Digestive enzyme
FCR
Growth enhancer
Juvenile tilapia
Micronutrient
Selenium

1 Introduction
Tilapia culture has emerged as a convenient and highly profitable fish farming in over 120 countries (FAO, 2019a). It has shown an 11% annual growth during 1987–2017 (Barroso et al., 2019). In 2017, FAO (2019b) ranked tilapia as the 4th most popular culture fish and included in the top 10 aquaculture producing fish species group. This trend is guiding researchers to explore various growth improvement techniques in tilapia to bridge the demand and supply gap (Iqbal et al., 2017; Iqbal et al., 2020). Fish growth is linked to multiple factors, including plausible environmental conditions, availability of feed ingredients, growth-promoting system, and management (Haider et al., 2016; Mehboob et al., 2017; Moon et al., 2020).
The recent studies have shown the importance of micronutrients that promote fish growth by improving the activity of endogenous digestive enzymes (DE) during the digestion process of fish feed (Ray et al., 2012). Selenium is a micronutrient indispensable for the steady growth of fish (Durigon et al., 2019). However, it is an exceptional example of a nutritional paradox; being essential at lower quantity but toxic if slightly higher (Younus et al., 2015). It is an antioxidant in stress defenses (Lemly, 1993) and an integral for DNA and proteins. For instance, it has been observed to perform an essential functions in maintaining enzyme and the immune system (Patterson et al., 2010). It is an essential constituent of the glutathione peroxidase (GPX) enzyme, which acts as an active antioxidant against reactive oxygen species (Rider et al., 2009). The optimal level of selenium in fish ranges between 0.21 and 1.18 mg/kg of feed (Durigon et al., 2019). It is an essential ingredient of selenoproteins, which are vital to living organisms (Ramesh et al., 2014). Therefore, provision of dietary selenium at optimal levels promotes fish tolerance to environmental stresses (Kucukbay et al., 2009). That is why, in aquaculture, selenium acts as a balancing micronutrient that improves the nutritive profile of fish feed (Hamre et al., 2008).
The level of enzymatic secretions could be used as indicators of digestion, nutritional status, and regulation of feed and feeding strategies in fish. Therefore, estimation of the DE activity is of particular concern due to their crucial role in fish growth and uptake of nutrients (Batool et al., 2018). The DE activity ultimately guides the fish nutritionists to determine the appropriate inclusion levels of carbohydrates, lipids and proteins in fish diets (Furne et al., 2005). We planned this study to evaluate the growth performance of juvenile tilapia and intestinal enzyme activity under the impact of supplemental selenium. We also investigated the projected influence of selenium-supplemented and selenium-deficient fish diets.
2 Materials and methods
2.1 Experimental management
This investigation was conducted at the Research and Training Facilities, Department of Fisheries and Aquaculture, University of Veterinary and Animal Sciences, Lahore, Pakistan. We used cemented rectangular and fixed fish tanks with individual inflow and outflow outlets, of 2.896 × 0.762 × 0.914 m with 2.018 c3 of total water volume, and each tank was further sub-divided into three replicates.
2.2 Feeding, stocking and data collection
The types of fish diets on the basis of selenium per kg (Se/kg) were; 2 (T1), 4 (T2), 8 (T3) and selenium-deficient (Control, T4). Each feed type was properly mixed, considering each diet as an independent treatment with similar protein and energy levels. The feed pastes thus obtained were extruded into pellets, oven-dried at 58 °C for 24 h, followed by packing and storage at −20 °C in tightly sealed glass containers until final apportionment. The given feed formulations, along with the corresponding chemical compositions, are mentioned in Table 1. Fifteen juvenile fish per tank were stocked with wet body weight ranging between 10 and 25 g and feed given @ 3% of body weight, sub-divided into three meals/day. The body weight and length were recorded on a fortnight basis to determine the growth and related indices, as well as next fortnight fish feed ration calculations. After 01 h of each feeding event, the remaining feed (if any), as well as waste pellets, were siphoned to maintain a healthy and sustainable culture environment. We also measured selected physicochemical water quality parameters for the monitoring of sustainable water quality. The details are given in Table 2. a: Vitamin premix (IU or g/kg diet): vitamin A, 16000 IU; vitamin D, 8000 IU; vitamin K, 14.72; thiamin, 17.8; riboflavin, 48; pyridoxine, 29.52; cynocobalamine, 0.24, tocopherols acetate, 160; ascorbic acid (35%), 800; niacinamide, 79.2; Calcium-D- pantothenate, 73.6; folic acid, 6.4; biotin, 0.64; inositol, 320; choline chloride, 1500; Lcarnitine, 100; b: Mineral premix; (g/kg of diet): calcium, 5.5; phosphorus, 17.5; iron, 10; magnesium, 2.8; copper,1.5; iodine, 0.15; manganese, 9.5; zinc, 25; cobalt, 0.13; c: Sodium selenite (Na2SeO3) in milligrams. D.O.: Dissolved oxygen, TDS: Total dissolved solids, EC: Electrical conductivity, WT: Water temperature, Total alkalinity, N.D.: Not detected. All values are mentioned in mg/L (ppm) except pH, temperature, and electrical conductivity. Statistical significance level (P < 0.05).
Serial No.
Ingredients
Inclusion levels (g/100 g)
Basel diet (Control)
Treatment 1
Treatment 2
Treatment 3
1
Fish meal
8
8
8
8
2
Guar meal
30
29.998
29.996
29.992
3
Soya bean meal
9
9
9
9
4
Wheat bran
18
18
18
18
5
Canola meal
8
8
8
8
6
Rice polish
24
24
24
24
7
Vitamin Premix a
2
2
2
2
8
Selenium free mineral premix b
1
1
1
1
9
Selenium dose c
0.00
0.002
0.004
0.008
Chemical composition
1
Crude protein
30.2
30.2
30.2
30.1
2
Crude lipid
7.3
7.2
7.3
7.3
3
Dry matter
86.4
86.4
86.3
86.5
4
Ash
6.8
6.7
6.6
6.9
Parameter
Treatment Tanks
Control
Treatment 1
Treatment 2
Treatment 3
Permissible limits
pH
8.58 ± 0.02
8.56 ± 0.03
8.58 ± 0.02
8.57 ± 0.02
7–9
DO (mg/L)
6.20 ± 0.15
6.04 ± 0.17
6.14 ± 0.29
6.26 ± 0.27
>5
WT (°C)
30.35 ± 0.02
30.4 ± 0.03
30.33 ± 0.03
30.34 ± 0.02
15–35
TDS (mg/L)
396.92 ± 26.9
378.1 ± 23.38
441.8 ± 37.65
430.2 ± 32.5
500–1200
EC (µS/cm)
649.09 ± 14.8
659.3 ± 34.58
663.3 ± 30.43
697.8 ± 23.8
300–1500
Hardness (mg/L)
18.1 ± 0.01
18.2 ± 0.01
18.03 ± 0.02
17.9 ± 0.02
>20
Nitrates (mg/L)
0.83 ± 0.13
0.84 ± 0.15
0.83 ± 0.14
0.84 ± 0.2
0–100
Chlorides (mg/L)
6.5 ± 0.11
6.9 ± 0.19
7.0 ± 0.13
7.0 ± 0.18
4–160
Salinity (mg/L)
0.8 ± 0.001
0.8 ± 0.001
0.8 ± 0.001
0.8 ± 0.002
–
Ammonia (mg/L)
N.D.
0.01 ± 0.003
0.012 ± 0.005
0.010 ± 0.003
0–0.05
2.3 Growth indices
The growth response of the juvenile tilapia was supervised by recording the average gain in weight and length, FCR (feed conversion ratio), SGR (specific growth rate), survival and mortality by employing the following formulae.
2.4 Enzyme activity estimation protocols
2.4.1 Sample preparation
Six live fish pieces per treatment tank were randomly captured and euthanized to degut after every 30 days. The removed gut was homogenized in a chilled Tris-HCl solution, and homogenate was centrifuged at 9300 rpm at 4 °C for 20 min. The acquired supernatant was collected and stored at −4 °C as a crude source of enzymes.
2.4.2 Amylase estimation
The estimation of amylase activity was performed through starch-hydrolysis (Bernfeld, 1955), experimental details given in supplementary material. The formula used is mentioned as under.
Absorption of standard = A; Absorption of sample = Y; A absorption is due to 01 ml (0.01 mg of standard glucose in 01 ml (glucose 10%) therefore 01 mg glucose/10 ml. So, 01 is = 0.01/A.
Y absorption is due to = (0.01/A) × Y = Fwhere F is mg of amylase in the sample. Therefore, the final equation is
The specific amylase activity was calculated as ml of maltose released per gram for one hour.
2.4.3 Lipase estimation
The lipase activity was estimated by the method of Furne et al. (2005), the details of experimental protocol followed are given in supplementary material. The calculation was performed using the formula as under.Y = µM of oleic acid released/minute.
whereas lipase activity unit was specified as the amount of free fatty acid (oleic acid) released from triacylglycerol per unit of time and estimated by the total amount of NaOH required for constant pH maintenance and denoted as milli-equivalents of alkali used.
2.5 Statistical analysis
This data was subjected to statistical analysis system (SAS v.9.1). The dataset was tendered to check normality by the Shapiro-Wilk normality test. We used one-way ANOVA to compare the means. The statistical significance calculated at P < 0.05 for every set of comparisons.
3 Results and discussion
During the fish monitoring, zero mortality was recorded. All the water quality factors were recorded within the permissible limits for sustainable fish growth performance (Table 2).
3.1 Growth indices
3.1.1 Weight and length dynamics
The growth performance of the juvenile tilapia was recorded significantly higher (P < 0.05) in T1 as opposed to T2, T3 and T4. On the other hand, the significantly weak growth outcomes were displayed in T3. However, arrested growth shown by the selenium-deficient (T4) group. Although fish growth was displayed continuously in the T2 and T3, the weight increments during last three fortnights remained insignificant (Fig. 1). The T1 presented significantly higher average gains in body weight (21.88 ± 5.62 g) and length (11.14 ± 1.04 cm). The statistical analyses revealed significant variations (P ≤ 0.05) in the average weight and length gains in all the treatments (Table 3). The detailed comparisons between the average weight and length gains on the basis of selenium-supplemented fish feed are presented in Table 3. The combined linear projections clearly explained the juveniles could demonstrate promising and isometric growth outputs, if dispensed with feed containing 2 mg/Kg and vice versa. It is also mention-worthy that T4 witnessed irregular and weak growth patterns. Statistical significance level (P < 0.05). Different superscripts in the same column indicate significant differences (P < 0.5).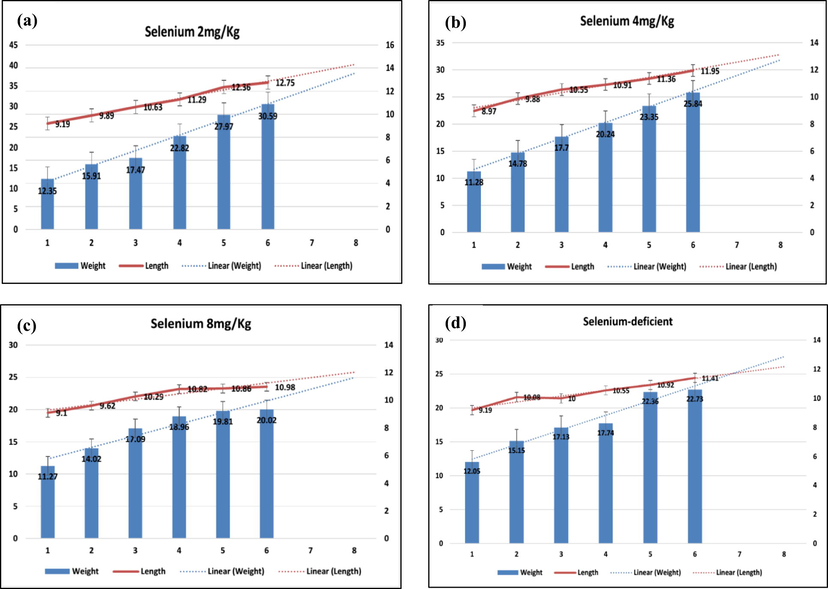
Comparisons of fortnight growth and length gains and their linear projections in juvenile tilapia based on supplemental selenium and selenium-deficient fish diets.
Treatments
Average Weight Gain
Average Length Gain
Treatment 1
21.28 ± 5.625aa
11.14 ± 1.041aa
Treatment 2
20.14 ± 5.159ab
11.05 ± 1.090a
Treatment 3
14.85 ± 2.798c
9.88 ± 0.588c
Control
18.17 ± 3.765bb
10.47 ± 0.717b
The intrinsic importance of supplemental selenium has been illustrated in standard growth increments in juvenile O. niloticus. Like other micro-minerals (Cu, Fe, and Zinc), selenium is essential for the gradually improving and well-noticed growth in nearly all cultured species of the animals. Our results are in line with Lin and Shiau (2005), who reported higher growth rates in Epinephelus malabaricus, under selenium supplementation with a lower growth rate at 4 mg/kg. However, selenium could not be the single factor responsible for lower growth performance. The other potential factors could be the increased RBCs reducing fish immunity. Similarly, Abdel-Tawwab et al. (2010) reported that feed supplemented with 0.5 g OS/kg (5.54 mg/kg) improved growth in tilapia.
Nonetheless, Gaber (2007) reported mixed findings on higher growth in C. carpio, fed on sodium selenite supplemented feed 0.24–0.32 mg/kg (0.12–0.15 mg/kg). Our findings corroborated with El-Hammady et al. (2007), who determined higher growth in fish fed on 2 mg/kg. The other inclusion levels of selenium for species tested include African catfish (3.67 mg/kg; Abdel-Tawwab et al., 2007). However, it was greater than specified for rainbow trout (0.38 mg/kg; Hilton et al. (1980), channel catfish (0.25 mg/kg, Gatlin and Wilson, (1984), and groupers (0.77 mg/kg; Lin and Shiau, (2005). Higher growth was observed in fish at lower levels of supplemental selenium (T1) and vice versa. However, Kim et al. (2003) reported that juvenile tilapia with selenium (0.2–0.5 mg/kg) did not display a substantial growth. Selenium has registered higher bioavailability when administered as Seleno-methionine rather than sodium selenite in catfish (Wang and Lovell, 1997) and Atlantic salmon (Lorentzen et al., 1994). The moderate concentrations of selenium have a beneficial effect on the development of common carp (Kallaya et al., 2011).
3.1.2 FCR, SGR and juvenile mortality
Better FCR was observed in T1 (1.46 ± 0.23) and T2 (1.59 ± 0.35), while SGR was the highest in T1 (2.61 ± 0.071). SGR displayed non-significant variations among the higher selenium (>2 mg/kg) and selenium deficient treatments (Table 4). The juvenile tilapia did not show any mortalities during the entire study, indicating thereby no or sub-lethal toxicity of selenium during the investigation. However, T4 FCR (1.67 ± 0.59) performed worse than T2 (1.59 ± 0.35). This further cemented the essentiality of selenium to fish, while signifying the fine difference between selenium as growth enhancer and toxicant. Abdel-Tawwab and Wafeek (2010) reported 0.5 g OS/kg of fish diet (5.54 mg Se/kg) showed better FCR. The higher the FCR, the lower is the growth efficiency and inverse is the link between SGR and FCR. Hilton and Hodson (1983) reported that the growth rate reduced when rainbow trout (Salmo gairdneri) was fed on a higher selenium (10 mg/kg) dose. They also revealed an increased rate of renal calcinosis having potential influence on growth. Selenium, as a micronutrient in fish feed, is required approximately as 0.1–0.5 mg/g (Gatlin and Wilson, 1984). In fish, the signs of selenium deficiency display constricted growth, exudative diathesis, muscular dystrophy, increased death rates and higher incidence of anemia (Bell et al., 1985). The projected linear relationship revealed no or near-zero growth and length increments in T4. Conversely, juvenile tilapia exhibited promising growth at a lower dose of selenium (2 mg Se/Kg). Therefore, juvenile tilapia growth showed indirect links between fish growth and selenium doses by confirming growth as inversely dosed-dependent. Paradoxically, the T4 exhibited reasonable growth outputs as compared to T2. This signified the toxic impact of higher selenium doses. F.C.R.: Feed Conversion Ratio, S.G.R.: Specific growth rate, S. (%): Survival rate. Statistical significance level (P < 0.05). Different superscripts in the same column indicate significant differences (P < 0.5).
Treatments
Growth Parameters
F.C.R.
S.G.R.
Survival (%)
Treatment 1
1.46 ± 0.23c
2.612 ± 0.071a
100 ± 0.00a
Treatment 2
1.59 ± 0.35b
1.533 ± 0.027c
100 ± 0.00a
Treatment 3
2.09 ± 0.73aa
1.987.588 ± 0.008a
100 ± 0.00a
Control
1.67 ± 0.59a
1.642 ± 0.044b
100 ± 0.00a
3.2 Digestive enzyme activity
3.2.1 Amylase activity
Table 5 displayed the comparative variance between the amylases and lipases activity under the influence of selenium graded and selenium-deficient diets in juvenile tilapia. The amylase activity was recorded the highest in T1 (2.41 ± 1.344), followed by T2 (2.14 ± 1.5). Fig. 2 presents the monthly activity of the amylase in the juvenile tilapia. The linear projections indicated the highest activity was recorded in T1 during third month. Conversely, in second and third months, the activity of amylase displayed a negative trend in T2. However, it exhibited a positive or no trend in T4, which established selenium vital at lower level and without external supplementation. However, higher (>2 mg/kg) selenium is detrimental to the regular activity of amylase. In fish, the difference of gut enzyme activity among fish species could be influenced by growth stage, feed composition and level of micronutrients in fish feeds (Kallaya et al., 2011). The activity of amylase is higher in liver than other organs, while protease and lipase are significantly higher in intestine. However, medium-sized fish displayed higher activity of lipases, while large-sized fish demonstrated higher activity of amylase (Peres et al., 1998). Statistical significance level (P < 0.05). Different superscripts in the same column indicate significant differences (P < 0.5).
Treatments
Enzymes Activity
Amylase
Lipase
Treatment 1
2.41 ± 1.344a
107.66 ± 2.545a
Treatment 2
2.15 ± 1.504a
82.45 ± 1.672b
Treatment 3
1.78 ± 0.75a
67.47 ± 6.332c
Control
1.93 ± 0.699a
64.09 ± 1.177c
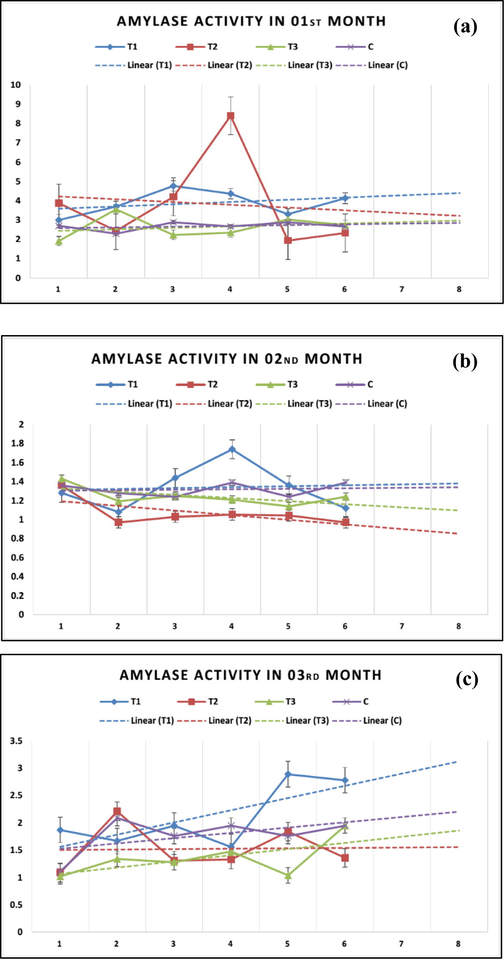
Monthly variations in amylase activity and linear projections in juvenile tilapia based on supplemental selenium and selenium-deficient fish diets.
3.2.2 Lipase activity
The highest lipase activity was observed in an inverse relationship with the selenium levels (Table 5). The highest observed activity was in the T1 (107.66 ± 2.54) while the lowest in the T4 (64.09 ± 1.17). A gradual decline in the lipase activity with the progressive increase in selenium-dose alluded to the adverse influence of higher selenium doses. Monthly lipase activity in juvenile tilapia was influenced by selenium level (Fig. 3). The highest lipase activity was observed in T1, and the lowest T3 and T4. The decreasing trends in the lipase activity validated critical role of selenium in lipase activity.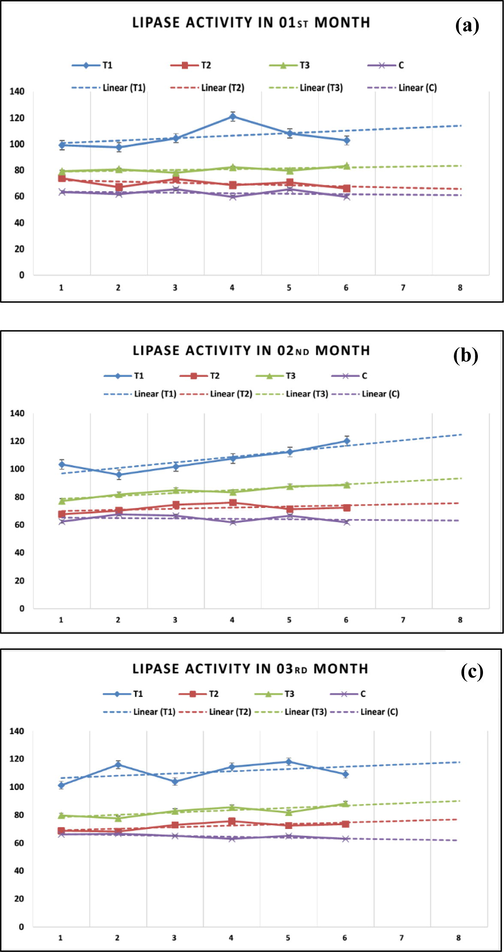
Monthly variations in lipase activity and linear projections in juvenile tilapia based on supplemental selenium and selenium-deficient fish diets.
Selenium is known for its potential role in enzyme activity manifested in enhanced growth and physiological functions. The lipase activity was higher in T1 followed by T2 and T3. Lipase monthly activity revealed that it was maximum in T1 with linear intensification. Although mild, but declining tendency in other treatments confirmed that higher selenium significantly reduced the lipase activity. Stable release of DE is directly associated with the health of gastrointestinal tract, which is linked to the presence of required microflora. The enzyme production is triggered by the presence of food (Hidalgo et al., 1999). Ramesh et al. (2014) investigated that enzymatic activity in Labeo rohita altered when exposed to sub-lethal (2.38 mg/L) concentration of sodium selenite. Our findings in T2 also establish the limited activity of lipase like control (T4) group. The pancreas drains several DE (lipase, amylase, trypsin, and chymotrypsin) into lumen of intestine. The action of Na + and K + ATPase further expands and generates Na + gradient driving the amino acids and vitamin into the cells. This step is extremely critical for the proper accomplishment of absorption of fluids from the intestine, which is mainly accomplished by the gut enzymes activity. Lipases participate in metabolism and transmission of various particles in organisms (Ramesh et al., 2014). They catalyze the hydrolysis of ester bonds in substrates, phospholipids, cholesteryl esters, and vitamin esters (Kurtovic et al., 2009).
The enhanced release of DE can improve digestibility and availability of nutrients from supplemented feedstuffs (Kallaya et al., 2011; Khan et al., 2018; Haider et al., 2018). The DE activity also corroborated with the growth indices in our study. In conclusion, better growth and elevated releases of the DE in the gut of juvenile tilapia have occurred in the fish fed on 2 mg/kg selenium. In contrast, generally, the enzymatic action follows the dose-dependent trend. As selenium has been reported as a paradoxical micronutrient (Lemly, 1993; Iqbal et al., 2020), it could illustrate better growth performances boosted by the elevated activity of gut enzymes. Our study advocates that if fed as appropriate or near to appropriate selenium dose to tilapia, it acts as an essential micronutrient. Better growth and higher activity of intestinal enzymes are inter-linked as well as to dependent on the adequate level of micronutrients like selenium.
4 Conclusions
In conclusion, the results have confirmed our hypothesis that selenium in fish feed acts as a growth enhancer in juvenile tilapia. The fish displayed weight and length gains, better FCR and SGR under 2 mg Se/kg. The growth results were further supported by the gut enzymes activity at the lower level selenium and vice versa. The fish exhibited arrested growth in selenium-deficient treatment with the lowest enzyme activity. This study provides interesting findings on the inclusion of selenium in fish feed to boost growth and DE activity. Therefore, we recommend tilapia farmers adopt 2 mg/kg of selenium in fish feed to boost their production and revenue generation.
Acknowledgement
‘‘The authors (SM and KAAG) would like to express their sincere appreciation to the Deanship of Scientific Research at the King Saud University for its funding of this research through Research, Group Project No. RG-1440-138”.
Author Roles
SI and UA equally participated in this research. SI and UA designed and conducted the study under the supervision of MSM and SM. SI and UA analyzed the data, prepared the illustrations, wrote, and revised the manuscript with HSI. MSH, KAAG, FAM and ZA helped in data analyses and manuscript preparation.
References
- Growth performance and physiological response of African catfish, Clarias gariepinus (B.) fed organic selenium prior to the exposure to environmental copper toxicity. Aquaculture. 2007;272:335-345.
- [Google Scholar]
- Response of Nile Tilapia, Oreochromis niloticus (L.) to environmental cadmium toxicity during organic selenium supplementation. J. World Aquacult Soc.. 2010;41(1):106-114.
- [CrossRef] [Google Scholar]
- Barroso, R.M., Muñoz, A.E.P., Cai, J., 2019. Social and economic performance of tilapia farming in Brazil. FAO Fisheries and Aquaculture Circular No. 1181. Rome, FAO. Licence: CC BY‐NC‐SA 3.0 IGO.
- Impact of azomite supplemented diets on the growth and body composition of catfish (Pangasius hypophthalmus) Pakistan J. Zool. Suppl. Ser 2018:08-12.
- [Google Scholar]
- Some effect of vitamin E and selenium deprivation on tissue enzyme levels and indices of tissue peroxidaion in rainbow trout (Salmo Gairdneri) Br. J. Nutr.. 1985;53:149-157.
- [Google Scholar]
- Enzymes of carbohydrate metabolism. In: Colowick S.P., Kaplan N.O., eds. Methods in Enzymology. Vol Vol. 1. New York: Academic Press; 1955. p. :149-541.
- [Google Scholar]
- Diet selenium improves the antioxidant defense system of juveniles Nile tilapia (Oreochromis niloticus L.) Braz. J. Biol.. 2019;79:527-532.
- [CrossRef] [Google Scholar]
- Synergistic reactions between vitamin E and Selenium in diets of hybrid tilapia (Oreochromis niloticus x Oreochromis aureus) and their effect on the growth and liver histological structure. Egypt. J. Aquatic Biol. Fish.. 2007;11(1):53-81.
- [Google Scholar]
- FAO. 2019a. FAO Global Fishery and Aquaculture Production Statistics 1950–2017 v2019.1.0, published through FishStatJ (www.fao.org/fishery/statistics/software/fishstatj/en).
- FAO. 2019b. Top 10 species groups in global aquaculture 2017. WAPI factsheet (June 2019). Rome. (http://www.fao.org/3/ca5224en/ca5224en.pdf).
- Digestive enzyme activities in Adriatic sturgeon Acipenser naccarii and rainbow trout Oncorhynchus mykiss. A comparative study. Aquaculture. 2005;250:391-398.
- [Google Scholar]
- Efficiency of selenium ion inclusion into common carp (Cyprinus carpio L.) diets. J. Fish. Int.. 2007;2(3):250-254.
- [Google Scholar]
- Dietary selenium requirement of fingerling channel catfish. J. Nutr.. 1984;114:627-633.
- [Google Scholar]
- Nutritive evaluation of fish acid silage in Labeo rohita fingerlings feed. J. Appl. Anim. Res.. 2016;44:158-164.
- [Google Scholar]
- Effect of processed fish waste on growth rate and digestive enzymes activities in Cyprinus carpio. Pakistan J. Zool. Suppl. Ser 2018:191-198.
- [Google Scholar]
- Rotifers enriched with iodine and selenium increase survival in Atlantic cod (Gadus morhua) larvae. Aquaculture. 2008;284(1–4):190-195.
- [Google Scholar]
- Comparative study of digestive enzymes in fish with different nutritional habits: proteolytic and amylase activities. Aquaculture. 1999;170:267-283.
- [Google Scholar]
- The requirement and toxicity of selenium in rainbow trout (Salmo gairdneri) Nutrition. 1980;770:2527-2535.
- [Google Scholar]
- Effect of increased dietary carbohydrate on selenium metabolism and toxicity in rainbow trout (Salmo gairdneri) J. Nutr.. 1983;113:1241-1248.
- [Google Scholar]
- Effect of selenium incorporated in feed on the hematological profile of tilapia (Oreochromis niloticus) J. Aquacult. Res. Develop.. 2017;8:1000513.
- [CrossRef] [Google Scholar]
- Iqbal, S., Atique, U., Mughal, M.S., Younus, M., Rafique, M.K., Haider, M.S., Iqbal, H.S., Sherzada, S., Khan, T.A., 2020. Selenium-Supplemented Diet Influences Histological Features of Liver and Kidney in Tilapia (Oreochromis niloticus). Jordan Journal of Biological Sciences 13, [In Press].
- Organic selenium supplementation promotes shrimp growth and disease resistance to Taura syndrome virus. Science Asia. 2011;37:24-30.
- [Google Scholar]
- Effect of various protein feeds on the growth, body composition, hematology and endogenous enzymes of catfish (Pangasius hypophthalmus) Pakistan J. Zool. Suppl. Ser 2018:112-119.
- [Google Scholar]
- No synergistic affects by the dietary supplementation of ascorbic acid, a -tocopheiyl acetate and selenium on the growth performance and challenge test of Edwardsiella trada in fingerling Nile tilapia, Oreochromis niloticus L. Aquac. Res.. 2003;34:1053-1058.
- [Google Scholar]
- The effects of dietary organic or inorganic selenium in rainbow trout (Oncorhynchus mykiss) under crowding conditions. Aquac. Nutr.. 2009;15(6):569-576.
- [Google Scholar]
- Metabolic stress during winter increases the toxicity of selenium to fish. Aquat. Toxicol.. 1993;27:133-158.
- [Google Scholar]
- Dietary selenium requirements of juvenile grouper. Epinephelus malabaricus. Aquaculture. 2005;250:356-363.
- [Google Scholar]
- Effects of dietary selenite or selenomethionine OH tissue selenium levels of attantic salmon (salmo salar) Aquaculture. 1994;121:359-367.
- [Google Scholar]
- Effect of fenugreek as a feed additive on the growth, body composition and apparent nutrients digestibility of striped catfish Pangasius hypophthalmus Fry. Pakistan J. Zool.. 2017;49(6):2037-2042.
- [Google Scholar]
- Ecological risk assessments and eco-toxicity analyses using chemical, biological, physiological responses, DNA damages and gene-level biomarkers in Zebrafish (Danio rerio) in an urban stream. Chemosphere. 2020;239:124754
- [CrossRef] [Google Scholar]
- Selenium in surface and irrigation water in the Kendrick irrigation district, Wyoming. Environ. Monit. Assess.. 2010;171:267-280.
- [Google Scholar]
- Dietary regulation of activities and mRNA levels of trypsin and amylase in sea bass (Dicentrarchus labrax) larvae. Fish Physiol. Biochem.. 1998;19:145-152.
- [Google Scholar]
- Hematological, biochemical and enzymological responses in an Indian major carp Labeo rohita induced by sublethal concentration of water borne selenite exposure. Chem. Biol. Interact.. 2014;207:67-73.
- [Google Scholar]
- Enzyme-producing bacteria isolated from fish gut- a review. Aquac. Nutr.. 2012;18:465-492.
- [Google Scholar]
- Supra-nutritional dietary intake of selenite and selenium yeast in normal and stressed rainbow trout (Oncorhynchus mykiss): implications on selenium status and health responses. Aquaculture. 2009;295(3–4):282-291.
- [Google Scholar]
- Organic selenium sources, selenomethionine and selenoyeast, have higher bioavailability than an inorganic selenium sources, sodium selenite, in diets for channel catfish (Ictalurus punctatus) Aquaculture. 1997;152:223-234.
- [Google Scholar]
- Effect of selenium incorporated in feed on the hematological profile of Oreochromis niloticus. Abstract Appl. Sci. Eng. 2015:1-22.
- [Google Scholar]
Appendix A
Supplementary data
Supplementary data to this article can be found online at https://doi.org/10.1016/j.jksus.2020.05.001.
Appendix A
Supplementary data
The following are the Supplementary data to this article:


