

Translate this page into:
Effect of probiotics on hematology and histopathology of organs associated with immune system in male and female Wistar rats
⁎Corresponding author. rehman.mmg@pu.edu.pk (Dilara Abbas Bukhari)
-
Received: ,
Accepted: ,
This article was originally published by Elsevier and was migrated to Scientific Scholar after the change of Publisher.
Abstract
In the present study, potential probiotics were isolated from dairy products and characterized on a molecular basis. Male and female (16 + 16, n = 4) Wistar rats were randomly assigned to 5 groups to revise the effects of isolated potential probiotics on the gut immune system: 0-day, negative control, positive control (commercial product Lactobacillus acidophilus-14), laboratory isolated strains Pro-3 (Weissella confusa MZ735961), and Pro-4 (Lactiplantibacillus plantarum MZ727611). Aspartate-aminotransferase, Interleukin-6, bilirubin, and Alanine-transaminase values in both genders were expected but AST and creatinine values had a minor increase in the female group compared to the male probiotic-treated group. Cellular blood count level of mean corpuscular hemoglobin in male groups showed no considerable differences (p = 0.95), while there were decreased differences (p = 0.00) in female groups. The level of mean corpuscular hemoglobin concentration (MCHC) showed distinct variations (p = 0.02) in male groups, while these values were insignificant changes (p > 0.05) among female groups. No damage to the liver, thymus, or colon was ascertained based on morphological findings. The colon wall thickness, external muscle, crypt depth, and mucosa were significantly (p = 0.03) improved in rats given potential probiotics. In conclusion, probiotic supplementation stimulates the immune system. It may protect the intestinal mucosa by strengthening the gut’s immune system and promoting intestinal efficiency (nutrient absorption and number of goblet cells). L. plantarum can therefore offer a reliable, affordable, and safe treatment for functional gastrointestinal illnesses.
Keywords
Potential probiotics
GIT
Histopathological studies
Colon
Immune system

1 Introduction
Probiotics are living organisms that, when given to a host in sufficient quantities, can have various beneficial effects on their health, including anti-inflammatory, anti-cancer, immune response, and diarrhea protection (Han et al., 2020; Guiné et al., 2020). The most significant group of bacteria is those classified as “generally considered safe” (GRAS), which is also known as “lactic acid bacteria” LAB is divided into several genera, including Lactobacillus, Weissella, Leuconostoc, and Pediococcus (Jang et al., 2019; Behera et al., 2020). Furthermore, these species exhibit high survivability in low pH and are widely used by beginners and founders in producing various dairy products (Russo et al., 2017; Fenster et al., 2019).
The defensive impact of lactobacilli has been well established, demonstrating that they can benefit the host by enhancing various immune activations (Aspri et al., 2020; Zhao et al., 2021). Potential probiotics' capability to increase secretory IgA production is another regularly noted way they affect the gut immune response (Arai et al., 2018). Secretory IgA can defend against toxins and pathogens by engaging in several non-inflammatory processes that improve their clearance and stop them from penetrating the intestinal mucosa (Jahnsen et al., 2018).
The large intestine contains these microbes at the highest concentration and metabolic activity, with 1011 to 1012 CFU/g (Bedani and Rossi, 2009). The slow peristaltic and nutrient supply, as well as the optimal conditions for bacterial multiplication, can all be used to explain these probiotics' predominance in these intestine (colon) regions. Probiotic supplementing positively affected intestinal morphology and blood hematology function (Elnesr et al., 2022). Galdeano and Perdigon (2004) examined the existence of fluorescence inside immune cells from PPs, small intestinal villi, and large intestinal lymph nodes.
This investigation aimed to ascertain the effects of orally given L. plantarum on rat hematological variables. Moreover, the beneficial dosages that enhance rats' health were considered.
2 Materials and methods
2.1 Bacterial isolation
Milk and yoghurt samples were collected from various locations throughout Lahore, Pakistan. Standard (0.9 %) saline solution of dairy samples was made by serial dilutions and usually spread on De Man Rogosa and Sharpe (MRS) agar plates at a concentration of only 30uL. Each plate was given a 24 h incubation period to allow for growth. Bacterial colonies were isolated and streaked on plates using a sterilized loop. The plates were then positioned in an incubator at 37 °C for 24 h (Lim et al., 2020). Gram staining was applied to distinguish between gram-negative and positive bacteria and determine the morphology of bacteria, such as rod-shaped. Endospore staining was employed to find out the bacterial spore development, followed by the protocol of Benson (2002).
2.2 Biochemical and molecular characterization
The biochemical method (glucose fermentation) was used to characterize the microbial isolates, followed by Benson (2002). DNA extraction was done using the phenol–chloroform method. The bacterial strains were identified using the 16S rRNA gene sequence by using primers according to the protocol described in Bibi et al. (2023).
2.3 Housing and group management
Female and male (16 + 16, n = 4) Wistar albino rats (Rattus norvegicus), 5–7 weeks old (100–200 g), were ordered from the University of Veterinary and Animal Sciences, Lahore. Rats were acclimatized for 7 days in an animal house at GCU, Lahore, to 30–38 % humidity and light for 24 h. Each rat was given 10 g of conventional chaw with 24 h availability of autoclaved distilled water. For 45 days, rats were given potential probiotics via gavage (0.4 ml) determined by the protocol (Lollo et al., 2013). The groups 0-day, (NC) Negative control, (PC) Positive control, Pro-3 (W. confusa MZ735961) and Pro-4 (L. plantarum MZ727611). The L. acidophilus La-14 (commercial probiotic strain) was used for positive control. CFU (colony forming unit) of group PC (L. acidophilus, 1 × 10¹²/ml), Pro-3 (8.25 × 10¹²/ml), and group Pro-4 (5.00 × 10¹²/ml) were taken by employing the pour plate method, which involves serial dilution of the standard stock. Various dilutions were prepared and selected dilutions having approximately equal CFUs.
2.4 Blood collection and hematological analysis
After 45 days of probiotic treatment, rats were euthanized for sampling. Blood was taken via a cardiac incision. A complete blood count was done using the programmed analyzer (Huma Count 30TS/ Hu123Wma Count 80TS, Germany). The blood samples were permitted to clot before being centrifuged (4000 rpm, 10 min.) for the biochemical analysis. The serum was then aspirated into fresh sample bottles and stored at −20 °C, and the serum analysis was analyzed (Fig. S1) on equipment code (PDL- PAT –EQP-005, Italy).
2.5 Histopathology and growth performance of organs
Rats were euthanized and particular organs (thymus, liver, and colon) were kept in 10–15 % formalin (Fig. S1). Further processing of organs was performed according to Bibi et al. (2023). The relative weight of each organ was calculated according to the protocol described in Shokryazdan et al. (2016). Crypt depth, submucosa, mucosa, mucosa tunic, and total wall of the colon were measured by ImageJ Software (µm) (Hermes et al., 2008).
2.6 Fecal analysis of probiotic-treated rats
To confirm the consumption of potential probiotics, probiotic-treated rats samples were performed according to Bibi et al. (2023). To assess the survival of LAB in phenol, a phenol tolerance test was carried out (Haghshenas et al., 2017).
2.7 Statistical analysis
One-way variance analysis (ANOVA) was used for the statistical analyses. Tukey's test was used for several comparisons. Version 20.0 of the Statistical Package for Social Sciences (SPSS) software was used for all statistical analyses. Alphabets, based on differences in groups, were found by MINITAB version 17. The findings were displayed as the standard error of the mean, with the significance value set at (p < 0.05).
3 Results
3.1 Biochemical and molecular characterization
Two out of 5 bacterial isolates were selected from dairy samples (milk and yogurt), named GCU-DAB-Z-7 and GCU-DAB-Z-10, designed round, soft, creamy white, large, and small colonies (Fig. S1a,b). Gram staining revealed that bacterial isolate cultures were stained purple and had a rod-like shape. This demonstrated that isolated strain cultures were gram-positive bacteria (Fig. S2c,d). When endospore staining was performed, it was found that none of the bacterial isolates contained spores (Fig. S2b). All isolates tested for the glucose fermentation test were positive.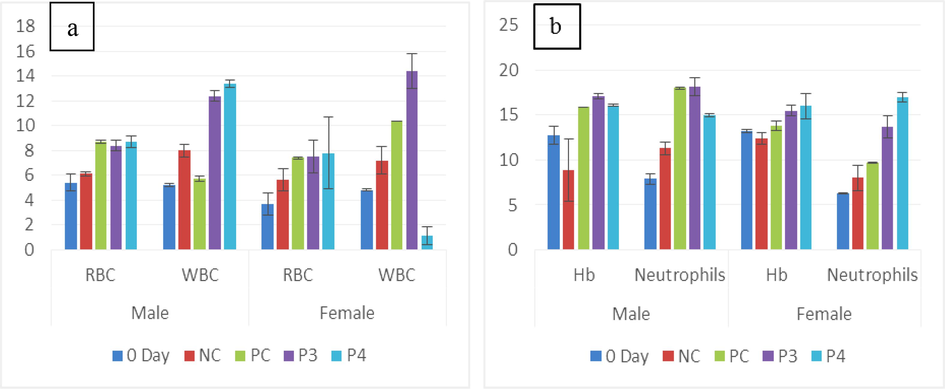
(a) The mean of male and female RBCs (Cell/µL) and WBCs (109/µL) in untreated (0-day and NC) and treated (Pro-3 and Pro-4) groups. (b) Hb (g/dL) and neutrophils of male and female rats between treated and non-treated groups.
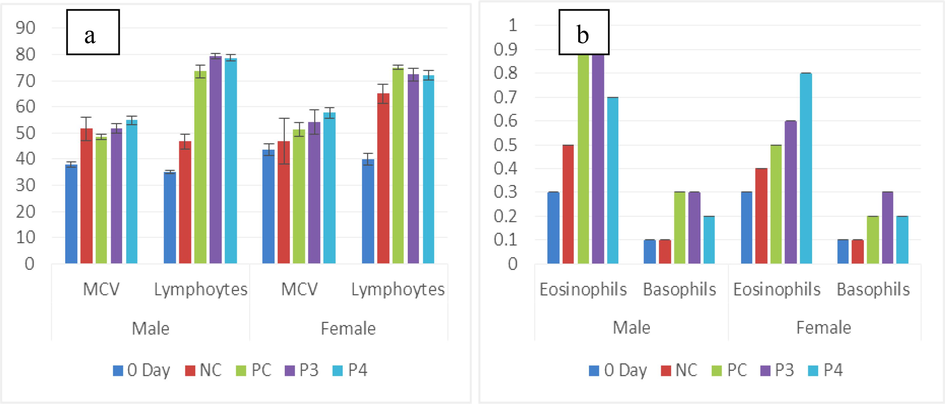
(a) Male and female graph showing the mean of MCV (fL) and lymphocytes (%) in untreated (0-day and NC) and treated (Pro-3 and Pro-4. (b) Eosinophils (%) and basophils (%) of male and female rats between treated and non-treated groups.
The genomic DNA was isolated and the PCR products were visualized (Fig. S3a,b). The 16S rRNA gene nucleotide sequence was done to identify GCU-DAB-Z-7 (L. plantarum), and GCU-DAB-Z-10 (W. confusa) isolates up to species level. It has been found through the dendrogram of mentioned sequences that GCU-DAB-Z-7 and GCU-DAB-Z-10 have a 98 % resemblance to L. plantarum strains and W. confusa strains, respectively (Fig. S4a,b). These strains were confirmed as potential probiotics after morphological, biochemical, and molecular characterization.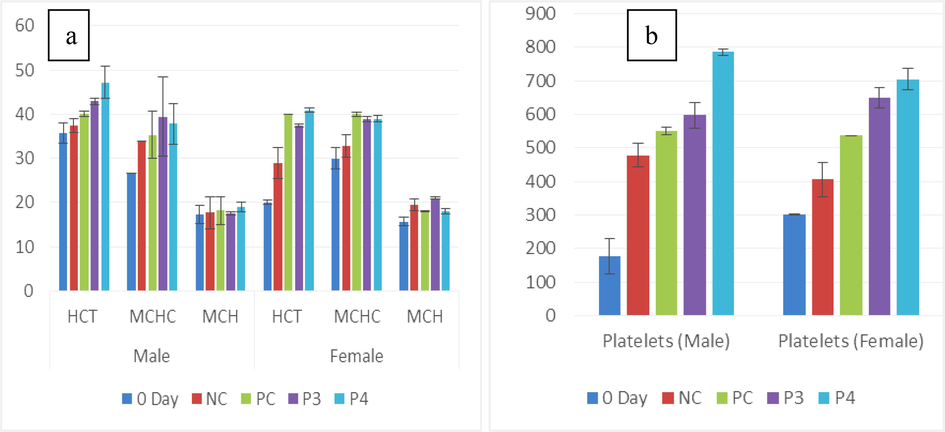
(a) Graph showing the mean of male and female HCT (%), MCHC (g/dL), and MCH (Pg/cell) in untreated (0-day and NC) and treated (Pro-3 and Pro-4) groups. (b) Platelets (%) of male and female rats between treated and non-treated groups.
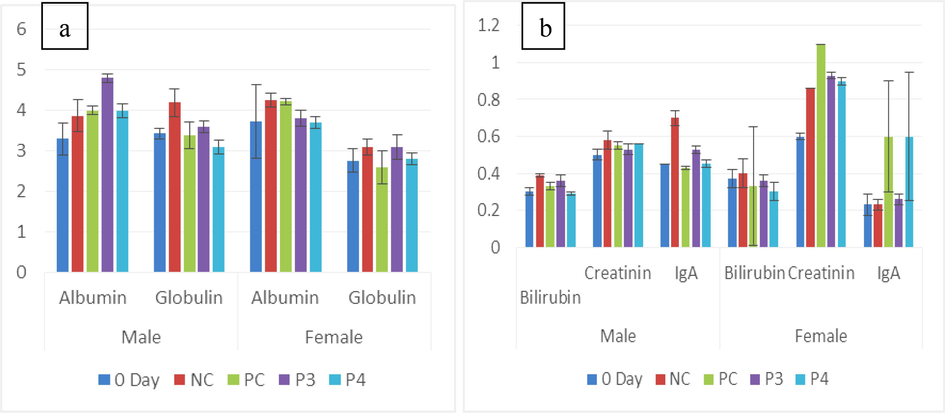
(a) Graph showing the mean of albumin and globulin (g/dL) in untreated (0-day and NC) and treated (PC, Pro-3 and Pro-4). (b) Graph showing the mean of creatinine, bilirubin (mg/dL), and IgA (ug/mL) in untreated (0-day and NC) and treated (PC, Pro-3, and Pro-4).
3.2 Changes in relative body weight and organs
Unusual physical or behavioral changes or unpredicted deaths, throughout the experiment, were not observed by any rat. The information in Table S1 demonstrates initial, final, and weight gain for both sexes. According to the results in Table S2, no discernible differences existed between the three strains in the relative weight of the liver and thymus. This demonstrated that L. acidophilus, W. confusa strains, and L. plantarum had no hepatomegaly and thymomegaly.
3.3 Hematological analysis
3.3.1 Blood count analysis
Probiotic groups of male PC and Pro-4 (8.7 ± 0.1a, 8.7 ± 0.5a cell/ul) showed maximum RBC value among all groups but 0-day (12.8 ± 1.0b cell/ul) recorded minimum value. In females, Pro-4 (7.8 ± 0.3a) showed the highest red blood cells among all treated and non-treated groups. WBC concentration in males was higher in the Pro-4 group (13.4 ± 2.9a 109/uL) while in females, Pro-3 showed a (14.4 ± 1.4ab109/uL) maximum level as compared to 0-day (4.8 ± 0.1d 109/uL). The significance value was calculated as 0.00I. In males Hb level (17.1 ± 0.3a g/dL)) was higher in Pro-3 while in females Pro-4 (16 ± 0.2a g/dL)) showed the highest value but the minimum value was found in NC (8.9 ± 3.5a g/dL) gender groups of rats. Statistical differences were found between each group of male and female rats, while a standard significant value was observed at (p < 0.05) as shown in (Table 1a; Fig. 1a,b). a,b,cdP < 0.05 compared with the control group by ANOVA followed by the Tuckey’s test.
Parameters
Gender
0 Day
NC
PC
Pro-3
Pro-4
p Value
Hb
(g/dL)
M
12.8 ± 1.0b
8.9 ± 3.5a
15.9 ± 0.0ab
17.1 ± 0.3a
16.1 ± 0.1ab
0.033
F
13.2 ± 0.6bc
12.4 ± 0.7c
13.8. ± 0.1abc
15.5 ± 1.0ab
16 ± 0.2a
0.033
RBC
(Cell/ul)
M
5.4 ± 0.7b
6.1 ± 0.2b
8.7 ± 0.1a
8.4 ± 0.4a
8.7 ± 0.5a
0.001
F
3.7 ± 0.1c
5.6 ± 0.5b
7.4 ± 0.2ab
7.5 ± 0.4a
7.8 ± 0.3a
0
HCT
(%)
M
35.8 ± 2.3b
37.4 ± 1.6ab
40.2 ± 0.6ab
42.9 ± 0.8ab
47.2 ± 3.6a
0.025
F
20 ± 0.0c
29 ± 0.0abc
40 ± 5.3bc
37.4 ± 9ab
40.9 ± 4.5a
0
MCHC
M
26.6 ± 2.0b
33.9 ± 3.6ab
35.3 ± 3.1ab
39.4 ± 0.3a
37.8 ± 1.1a
0.028
(g/dL)
F
30 ± 0.5a
32.8 ± 3.5a
40 ± 0.0a
38.9 ± 0.3a
39 ± 0.5a
0.055
MCH
M
17.3 ± 2.5a
17.7 ± 2.5 a
18.2 ± 0.4a
17.6 ± 0.7a
19.0 ± 0.7a
0.958
(Pg/cell)
F
15.7 ± 0.9b
19.5 ± 1.3a
18 ± 0.1ab
21 ± 0.3a
18 ± 0.6a
0.004
WBC
M
5.2 ± 0.9b
8.0 ± 0.9ab
5.7 ± 0.1b
12.4 ± 1.3ab
13.4 ± 2.9a
0.011
(109/uL)
F
4.8 ± 0.1d
7.2 ± 1.1cd
10.4 ± 0.0bc
14.4 ± 1.4ab
11.1 ± 0.7a
0
Basophils
(%)
M
0.1 ± 0.0b
0.1 ± 0.0b
0.3 ± 0.0a
0.3 ± 0.0a
0.2 ± 0.0a
0
F
0.1 ± 0.0c
0.1 ± 0.0c
0.3 ± 0.0bc
0.2 ± 0.0ab
0.2 ± 0.0a
0
Plateletes
M
177.3 ± 53.1c
478 ± 35.2b
551 ± 10.4b
597 ± 37.5b
785.3. ± 9.7a
0
(%)
F
301.8 ± 2.2d
405 ± 52.0cd
536 ± 1.2bc
650 ± 30.0ab
705 ± 32.5a
0
Lymphocytes
M
34.9 ± 2.3a
46.7 ± 8.8a
73.5 ± 2.7a
79.3 ± 4.7a
78.7 ± 2.1a
0
(%)
F
40 ± 2.3b
65.0 ± 3.8ab
75.0 ± 0.8ab
72.3 ± 2.6a
72.0 ± 1.7a
0.018
Neutrophils
M
7.9 ± 0.2c
11.3 ± 0.6bc
18.0 ± 0.5a
18.2 ± 0.6a
15 ± 1.42 ab
0
(%)
F
6.3 ± 0.1c
8.0 ± 1.4c
9.7 ± 0.1bc
13.7 ± 1.2 ab
17.0 ± 0.5 a
0
Eosinophils
M
0.3 ± 0.0b
0.5 ± 0.0b
0.9 ± 0.0a
0.9 ± 0.0 a
0.7 ± 0.0a
0
(%)
F
0.3 ± 0.0c
0.4 ± 0.0c
0.5 ± 0.0bc
0.6 ± 0.0ab
0.8 ± 0.0a
0
MCV
(fL)
M
38 ± 1.0b
51.6 ± 4.6a
48.4 ± 1.1ab
51.7 ± 1.8 a
54.9 ± 1.7 a
0.006
F
43.6 ± 0.6c
47.0 ± 3.0bc
51.4 ± 2.4abc
54.0 ± 1.0 ab
57.7 ± 1.3 a
0.003
Pro-3 male (0.9 ± 0.0a %) and Pro-4 female (0.8 ± 0.0a %) showed the highest eosinophils level, while the least eosinophils value was seen in male and female 0-day (0.3 ± 0.0bd %) group. Basophil concentration was higher in the PC group (0.3 ± 0.0a %), while the lowest and same values were observed in the 0-day and NC (0.1 ± 0.0b %) groups of both. Data and graphs of eosinophils and basophils are shown in Table 1a and Fig. 2a, b, respectively.
Between the male Wistar rats group, Hb, RBC, WBC, HCT, MCHC, eosinophils, basophils, lymphocytes, platelets, and neutrophils, showed significant variation (p<0.05), and MCH, depicted insignificant difference (p>0.05). On the other hand, female Wistar rats group, Hb, RBC, MCH, WBC, basophils, HCT, MCV, eosinophils, platelets neutrophils, and lymphocytes depicted considerable variations (p<0.05) except MCHC showed insignificant value (p>0.05) (Table 1a; Fig. 3a,b).
3.3.2 Serum chemistry analysis
The highest albumin level was seen in male Pro-3 as 4.8 ± 0.1a g/dL (Table 1b), whereas the lowest albumin was seen in 0-day 3.30 ± 0.4a g/dL. While in females highest value was observed in NC (4.26 ± 0.34a g/dL), the lowest was noticed in 0-day (3.73 ± 0.14a g/dL). The lowest globulin level of the male Pro-4 (3.1±‘0.15a g/dL) group was observed, and the highest value was seen in the NC (4.2 ± 0.17a g/dL) group. The most elevated and same globulin recorded values in female groups were of NC (4.2 ± 0.4a g/dL) and Pro-3, respectively, but the minor globulin level was seen in the PC (2.6 ± 0.4a g/dL) group. IgA is responsible for the final immune response. The highest IgA level was seen in Pro-4 (0.70 ± 0.02bc ug/mL) and the lowest was observed in the NC (0.23 ± 0.03a ug/mL) group of males. In females, elevated IgA value was observed in Pro-3 (0.60 ± 0.30a ug/mL), but the least was seen in untreated groups (Fig. 4a,b). In the present study, ALT level was lower in the Pro-4 (51.6 ± 1.20a uL) group of males and PC (45 ± 2.8a uL) of the female, but an elevated level was seen in NC (64.6 ± 1.52a uL) of males and (54.3 ± 2.7a uL) female genders. a,b,cP < 0.05 compared with the control group by ANOVA followed by Tuckey’s test.
Parameters
Gender
0 Day
NC
PC
Pro-3
Pro-4
p Value
Albumin
(g/dL)
M
3.30 ± 0.4b
3.87 ± 0.4ab
4.0 ± 0.1ab
4.8 ± 0.1a
4.0 ± 0.17ab
0.5
F
3.73 ± 0.14a
4.26 ± 0.34a
4.23 ± 0.33a
3.8 ± 0.15a
3.7 ± 0.17a
0.393
Globulin
(g/dL)
M
3.43 ± 0.9a
4.2 ± 0.17a
3.4 ± 0.08a
3.6 ± 0.20a
3.1±‘0.15a
1
F
2.76 ± 0.29a
3.1 ± 0.2a
2.6 ± 0.4a
3.1 ± 0.3a
2.8 ± 0.15a
0.732
IgA
(ug/ml)
M
0.45 ± 0.02bc
0.70 ± 0.00a
0.43 ± 0.00c
0.53 ± 0.02b
0.45 ± 0.02bc
0
F
0.23 ± 0.06a
0.23 ± 0.03a
0.60 ± 0.30a
0.26 ± 0.03a
0.6 ± 0.35a
0.51
ALT
(uL)
M
58.33 ± 3.52a
64.6 ± 1.52a
63.6 ± 2.60a
59.3 ± 3.84a
51.6 ± 1.20a
0.064
F
45.6 ± 2.33a
54.3 ± 2.7a
45 ± 2.8a
49.6 ± 4.8 a
49 ± 4.0a
0.392
AST
(uL)
M
263.3 ± 22.1a
302 ± 39.1a
282 ± 3.60a
286 ± 16.8a
244 ± 20.0a
0.491
F
245.6 ± 27.0a
304 ± 26.6a
271.6 ± 4.4a
292.6 ± 21.6 a
295 ± 47.6a
0.64
Billirubin
(mg/dl)
M
0.30 ± 0.02a
0.39 ± 0.01a
0.33 ± 0.02a
0.36 ± 0.03a
0.29 ± 0.01a
0.071
F
0.37 ± 0.03a
0.40 ± 0.05a
0.33 ± 0.02a
0.36 ± 0.03a
0.30 ± 0.00a
0.39
Creatanine
(mg/dL)
M
0.50 ± 0.00a
0.58 ± 0.04a
0.55 ± 0.01a
0.53 ± 0.02a
0.56 ± 0.02a
0.213
F
0.6 ± 0.05a
0.86 ± 0.08a
1.1 ± 0.32a
0.93 ± 0.03a
0.90 ± 0.05a
0.289
IL-6
(pg/ml)
M
17.0 ± 0.14ab
18.5 ± 0.43a
16.6 ± 0.6bc
15.1 ± 0.3c
16.5 ± 0.18bc
0.02
F
15.7 ± 0.17c
18.3 ± 0.4a
16.6 ± 0.08bc
17.1 ± 0.2b
16.8 ± 0.1bc
0
TP
(g/dL)
M
5.70 ± 0.05c
5.83 ± 0.08a
7.0 ± 0.20b
6.5 ± 0.2c
7.6 ± 0.2c
0
F
7.0 ± 0.24 ab
8.1 ± 0.6 a
6.0 ± 0.05b
7.5 ± 0.20 a
7.2 ± 0.2 ab
0.009
In male and female rats, higher AST concentrations were observed in NC (302 ± 39.1a uL), but Pro-4 (244 ± 20.0a uL) showed the most negligible value in males and 0-day (245.6 ± 27.0a uL) group of females. IL-6 is responsible for neutrophil regulation, and its level was predominantly increased in PC (18.6 ± 0.6bc pg/ml) of males and least was seen in Pro-3 (16.5 ± 0.18bc pg/ml). In females, IL-6 level was increased in Pro-4 (16.8 ± 0.1bc pg/ml) while decreased in the NC (15.3 ± 0.4a pg/ml) group. In males, the minor total protein was observed in 0-day (5.70 ± 0.05c g/dL), while the highest level was seen in Pro-4 (7.6 ± 0.2c g/dL). In females, PC 6.0 ± 0.05b g/dL showed less total protein while NC (8.1 ± 0.6a g/dL) had an elevated value shown in (Fig. 5a,b).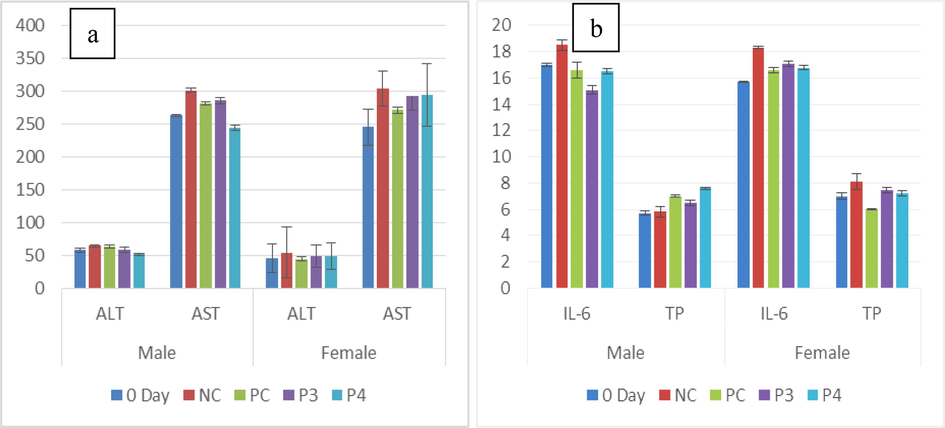
(a) Graph showing the mean of ALT and AST (µL) in untreated (0-day and NC) a) treated (PC, Pro-3 and Pro-4). (b) Graph showing the mean of IL-6 (pg/ml) and Total protein (g/dL) in untreated (0-day and NC) and treated (PC, Pro-3 and Pro-4).
Albumin, globulin, ALT, AST, bilirubin, and creatinine in male Wistar rat groups were considered serum parameters. The creatinine showed insignificant variation (p>0.05), while IgA, TP, and Interleukin-6 showed significant change (p<0.05). In female rats albumin, IgA, globulin, ALT, bilirubin AST, and creatinine showed a considerable difference (p<0.05) while IL-6 and total protein showed no significant difference (p>0.05) (Table 1b).
3.4 Fecal antimicrobial activity results
Potential probiotics showed maximum resistance (zone of inhibition measured in mm) for P. aeroginosa while their effect against E. coli and S. aureus was also observed (Table 2a). The isolates from potential probiotics-treated groups (Pro-3, Pro-4, and L. acidophilus-14) showed significant resistance toward the pathogenic strains P. aeroginosa, S. aureus, and E. coli. Clear zones were formed on all the plates. Pro-4 in males showed maximum resistance than other groups. All the potential probiotics could co-aggregate with pathogens, but other groups (0-day and Negative control) were less effective against pathogens (Table 2a).
Groups
Gender
P. aeroginosa
S. aureus
B. lechiniformes
E.coli
Diameter of inhibition zone in (mm)
0 Day
M
0.00 ± 0.00a
10.7 ± 0.13c
13.33 ± 0.09e
0.00 ± 0.00f
F
0.00 ± 0.00d
11.93 ± 0.12e
10.7 ± 0.88d
10.3 ± 0.88g
NC
M
13.3 ± 0.23c
7.3 ± 0.15b
15.7 ± 0.12a
0.00 ± 0.00c
F
0.00 ± 0.00b
7.13 ± 0.09a
14.4 ± 0.21cd
10.4 ± 0.18d
PC
M
15.3 ± 0.33b
11.3 ± 0.02cd
17.7 ± 0.05cd
17.7 ± 0.03e
F
14.3 ± 0.35b
15.2 ± 0.11cd
17.3 ± 0.17cd
18.2 ± 0.12e
Pro-3
M
11.7 ± 0.35a
11.7 ± 0.1a
17.3 ± 0.07c
17.3 ± 0.08a
F
10.7 ± 0.33a
10.7 ± 0.33a
15.7 ± 0.33bc
16.3 ± 0.18b
Pro-4
M
13.3 ± 0.21a
13.3 ± 0.23b
19.1 ± 0.27c
19.3 ± 0.07b
F
12.3 ± 0.33a
11.4 ± 0.18b
16.7 ± 0.23cd
16.3 ± 0.33ab
p Value
M
0.00
0.00
0.00
0.00
F
0.01
0.00
0.00
0.01
3.4.1 Fecal phenol tolerance test
All groups' fecal contents were tested for survival in 0.4 % phenol. The least bacterial growth was observed in NC groups of males and females, while the highest was kept in the male Pro-4 group and PC group of females. Readings taken at 24 h showed maximum growth and demonstrated that all probiotic combinations survived in 0.4 % phenol, whereas negative control and 0-day were lessened. Fig. 5S (a,b) shows the graph of phenol tolerance.
3.5 Histopathological analysis
The morphology of the glands was unaltered in the treated groups. None of the groups showed damaged liver or thymus histologically affected. The thymus and liver histopathological examination findings were prominent at 10X magnification (Fig. 6a,b). Histopathology of the colon in rats showed no harm in the gut morphology in any group. However, crypt depth, mucosa, sub-mucosa, peripheral muscle, and the total thickness of the colon wall were significantly increased in rats given potential probiotics, respectively. It showed that they improved the morphology of the intestine. The histological magnification ratio was increased in probiotic groups (Fig. 7; Table 2b).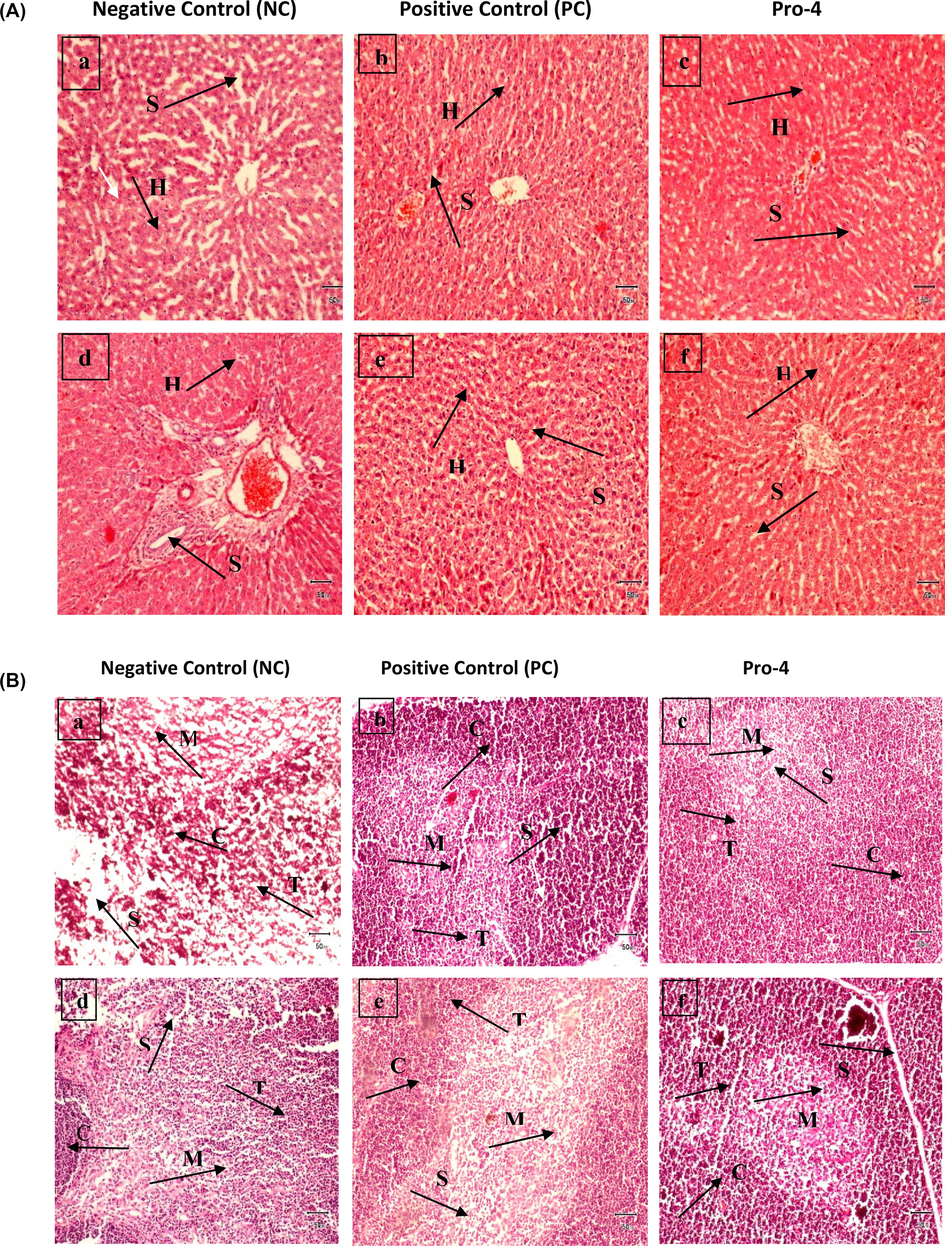
(a) Micrographs of male Wistar rat’s liver (a, b, and c) and female Wistar rats' liver (d, e, and f) at 10X; Negative control; positive control, and Pro-4 (Lactobacillus plantarum MZ727611). It shows histological structures of liver hepatocytes (H) and sinusoids (S). (b) Micrographs of male Wistar rats Thymus (a, b, and c) and female Wistar rats (d, e, and f) at 10X; Negative control; positive control, and Pro-4 (Lactobacillus plantarum MZ727611). They show histological structures of Thymus Cortex (C), Medulla (M), Spaces (S), and Thymocytes (T). No cellular or inflammatory changes are seen in the thymus of male and female rats. Bar = 50 mm.
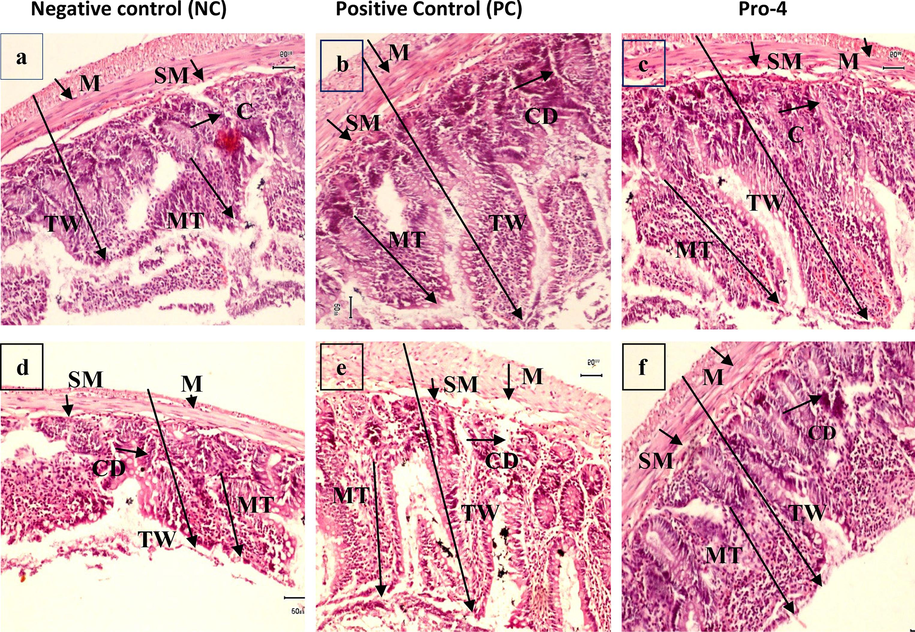
Colon of (a) negative control (b) positive control (c) Pro-4 (Lactobacillus plantarum MZ727611) in male rats, colon of (d) negative control (e) positive control (f) Pro-4 in female rats, mucosa tunic (MT), Crypt depth (CD), Sub-mucosa (SM), total thickness of wall (TW) and Mucosa (M) at 10X Bar = 50 mm.
Groups
Gender
Mucosa (um)
Sub-mucosa (um)
Crypt Depth (um)
Muscle tunic (um)
Total wall of colon (um)
0 day
M
234.0 ± 5.77a
20 ± 10.3a
139.1 ± 20.1b
220 ± 12.0ab
916 ± 5.5a
F
190 ± 25.1a
25.3 ± 8.0c
130.0 ± 24.2ab
225 ± 10.0a
917 ± 6.5ab
NC
M
150.9 ± 20.8b
19.6 ± 8.81b
138 ± 23.0b
230 ± 8.8b
891.3 ± 8.5b
F
210 ± 26.4c
19.2 ± 5.77b
131 ± 25.1b
217 ± 8.0b
871.2 ± 10.1b
PC
M
183 ± 55.4ab
40.1 ± 5.77b
146.1 ± 45.8ab
248.2 ± 10.1a
950 ± 9.5ab
F
210 ± 10.0b
31.5 ± 17.2b
144.1 ± 27.1ab
241.5 ± 10.1a
916 ± 11.5ab
Pro-3
M
230.7 ± 22.1c
21.1 ± 4.5bc
139 ± 23.1ab
225.4 ± 10.0a
978.1 ± 10.1b
F
240 ± 20.1a
20.0 ± 12.5b
140.2 ± 21.2ab
230 ± 0.01a
890 ± 8.80ab
Pro-4
M
260 ± 5.77c
36.1 ± 5.3a
148 ± 27.2ab
240.1 ± 8.9a
990.8 ± 5.7a
F
245.1 ± 18.4ab
28.6 ± 12.0b
142 ± 28.2a
241.8 ± 8.8a
983 ± 8.0a
p Value
M
0
0
0.008
0.015
0.016
F
0
0
0.006
0.035
0
In the colon of male groups, the mucosa was minimum in NC (19.6 ± 8.81b) and maximum in the Pro-4 (260 ± 5.77c) group. Sub-mucosa was minimum in negative control 196 ± 8.81b, whereas it was seen greatest in Pro-4 (40.1 ± 5.77b). Crypt depth was minimum in NC (138 ± 23.0b) and highest in Pro-4 (150 ± 27.2ab). The highest muscle tunic was seen in PC (248.2 ± 10.1a), while the least was observed in 0-day (220 ± 12.0ab). Total colon wall thickness was lowest in NC (891.3 ± 8.5b) and most significant in Pro-4 (990.8 ± 5.7a).
In the colon of female groups, the least mucosa was seen in 0-day (190 ± 25.1a) and maximum in Pro-4 (245.1 ± 18.4ab) group. Sub-mucosa was lower in the negative control (19.2 ± 5.77b) and greatest in PC (31.5 ± 17.2b). Crypt depth was minimum in 0-day (130.0 ± 24.2ab) and highest in PC (144.1 ± 27.1ab). The highest muscle tunic was seen in PC (241.5 ± 10.1a), while the least was observed in NC (130 ± 25.1b). Total colon wall thickness was seen lowest in 0-day (917 ± 6.5ab) and most remarkable in Pro-4 (983 ± 8.0a) (Fig. 8; Table 2b). Significant differences were seen in both genders of all groups.
4 Discussion
In the present study, isolated Lactobacillus were non-motile, gram-positive, catalase-negative, and fermentation-test-negative, and the results of all biochemical tests matched those of Prabhurajeshwar and Chandrakanth, (2019). A phenol tolerance test was used to assess the resistance of L. plantarum and W. confusa, and this is consistent with the findings of Elmansy et al. (2022). The GIT secretes phenol after digestion. Therefore, the potential LAB probiotic strains must be capable of surviving the effects of phenol. The isolated LAB strains withstand 0.4 % phenol so they can survive in the gut and would be considered potential probiotics. In contrast to De Angelis et al. (2006), probiotic isolates demonstrated antimicrobial activity. They produced a substantial inhibition zone against E. coli, B. lechiniformes, S. aureus, and P. aeroginosa (Table 2a).
There was a substantial increase in hemoglobin and RBCs related to the control in male and female rats. Compared with the control group results, the standard group and other treatment groups displayed significant variation (P=0.001) in WBC count and lymphocyte levels, inconsistent with Sujaya et al. (2022). Among the groups of male Wistar rats, HCT, MCHC, platelets, and neutrophil values showed significant differences. MCH exhibited no significant differences compared to NC and 0-day.
However, in female rat groups, values of Hb, MCH, WBC, basophils, MCHC, RBC, MCV, platelets, neutrophils, and lymphocytes indicated significant differences. Basophils and eosinophils showed significant variation among other groups’ and results were inconsistent with Sayed et al. (2018). MCHC showed an insignificant value compared to other female groups (Table 1a). Probiotic groups, 0 days, and negative control had normal lymphocyte range, meaning the body does not have any infection or without the probiotic ingestion. Neutrophils are the granulocytes that help in immune functions. However, the results showing the group differences were similar to Bikheet et al. (2021).
Aspartate transaminase (AST) and alanine transaminase (ALT) concentrations were used to evaluate liver damage as well as the toxicity of potential probiotics. The ALT concentration was lower in treated groups and AST was similar among all groups in males. While ALT showed a similar concentration in females, AST showed a minor increase in the NC group compared to other groups of female rats. These findings were according to Sarwar et al. (2022). As a result, we can assume that no liver damage occurred during research to see how potential probiotics affect the immune system (Table 1a). According to Arai et al. (2018), IgA level was the same in females. Interleukin-6 also plays an essential part in the terminal stage of mucosal immune responses. IL-6 and total protein among the groups of both genders showed no difference among the groups' results, according to Galdeano et al. (2007).
Bilirubin and creatinine levels indicate the degradation of cells in the liver accordingly. The current study showed that male probiotic-treated groups had minimum bilirubin while creatinine levels were lowered in both genders and a modest increase was found in the NC group. NC showed the maximum globulin concentration in males compared to females, while albumin levels were normal among all groups, according to Kumar et al. (2022).
In the present investigation, cells of 0-day and negative control were shrunken; however, the cells of potential probiotics groups were intact. These findings are followed by Cui et al. (2022). According to several studies (Marçal Natali et al., 2005; Pitsouni et al., 2009), probiotics increase immune system cells associated with intestinal mucosa. This may help control and prevent infections where nutritional deficiencies cause diseases. Intestinal development and crypt increase imply that intestinal epithelial cell growth and further absorption increase; similar findings were followed (Marçal Natali et al., 2005). Probiotic supplementation worked well to improve rats' mucosa and muscular tissue. The same results were observed by Mennigen and Bruewer, (2009). In the Colon of Wistar rats, crypt depth, mucosa tunic, total wall, and sub-mucosa were detected. Because of the longer intestinal glands in the colon, the mucosa tunic is significantly denser. The mucosa tunic surface was smooth and contained a rising number of goblet cells (Dellman and Brown, 1992). The decrease in mucosa tunic thickness is due to dietary deficits in gut morphometrics (Bando et al., 2011). In both male and female rats, the least crypt depth was found in 0-day, and NC epithelial cells were degenerating, whereas maximum depth was seen in the Pro-4 (L. plantarum MZ727611) group (Table 2b; Fig. 7). The colon reacted similarly in both genders.
5 Conclusions
Isolated strains, L. plantarum and W. confusa, were identified as potential probiotics on microscopic, biochemical, and molecular attributes. Commercially available probiotic bacteria have been demonstrated to have related immune response benefits as probiotic strains generated in the laboratory. Both strains were well tolerated, and no adverse effects on development, cellular blood constituents, or essential organs, such as the colon, of the treated animals were observed. These potential probiotics could also decline pathogenic microbial populations while increasing beneficial bacterial populations. The fecal tolerance test showed that treated groups have the highest growth as compared to the untreated groups. Overall, L. plantarum seemed to have more good effects than W. confusa. The current study might help develop new probiotic products and provide evidence for selecting various potential probiotics. These results show that the probiotic isolates are secure and evaluate their efficacy in preclinical and clinical studies for human ingestion.
Ethics approval
The Institutional Ethics Committee participants, GC University Lahore, have assessed and approved the existing research plan (Ref. No. GCU-IIB-117).
CRediT authorship contribution statement
Zuhra Bibi: Methodology, Investigation. Naureen Fatima: Data curation. Muhammad Qadeer Sarwar: Investigation, Data curation. Arifullah: Methodology, Investigation. Samina Younas: Methodology, Data curation. Tayyab Manzoor: Methodology. Abdul Rehman: . Dilara Abbas Bukhari: Validation, Supervision, Resources, Conceptualization.
Declaration of competing interest
The authors declare that they have no known competing financial interests or personal relationships that could have appeared to influence the work reported in this paper.
References
- Orally administered heat-killed Lactobacillus paracasei MCC1849 enhances antigen-specific IGA secretion and induces follicular helper T cells in mice. PLoS One. 2018;13(6):1-15.
- [Google Scholar]
- Review on non-dairy potential probiotics and their use in non-dairy-based products. Fermentation. 2020;6(1):1-14.
- [Google Scholar]
- GC-MS-based metabolomics reveals mechanism of action for hydrazine induced hepatotoxicity in rats. J. Appl. Toxicol.. 2011;31(6):524-535.
- [Google Scholar]
- Microbiota intestinal e probiótics: implicações sobre o câncer de cólon. J. Port. Gastrenterol.. 2009;15:19-28.
- [Google Scholar]
- Traditionally fermented pickles: How the microbial diversity associated with their nutritional and health benefits. J. Funct. Foods. 2020;70:103-971.
- [Google Scholar]
- Microbiological Applications: Laboratory Manual in General Microbiology, short version (8th edition.). Mcgraw Hill publishers; 2002.
- Evaluation of isolated probiotics on the efficacy of the immune system in male and female Wistar rats. Saudi Pharm. J.. 2023;31:1036-1046.
- [Google Scholar]
- The effect of two strains of LAB (P. Acidilactaci and L. Lactis) in laboratory rats. Scientific J. Agricult. Sci.. 2021;3(1):137-143.
- [Google Scholar]
- Orally administered brain protein combined with potential probiotics increases Treg differentiation to reduce secondary inflammatory damage following craniocerebral trauma. Front. Immunol.. 2022;13:1-14.
- [Google Scholar]
- Selection of potential probiotic lactobacilli from pig feces to be used as additives in pelleted feeding. Res. Microbiol.. 2006;157(8):792-801.
- [Google Scholar]
- Histologi (Veteriner Ed.). III: Blackwell publishing; 1992.
- Exopolysaccharide produced by Lactiplantibacillus plantarum RO30 isolated from Romi cheese: characterization, antioxidant and burn healing activity. World J. Microbiol. Biotechnol.. 2022;38(12):1-18.
- [Google Scholar]
- Impact of humate substances and Bacillus subtilis PB6 on thyroid activity and histomorphometry, iron profile and blood haematology of quail. J. Animal Physiol. Animal Nutr.. 2022;106(1):110-117.
- [Google Scholar]
- The production and delivery of potential probiotics. A review of a practical approach. Microorganisms. 2019;7(3):1-17.
- [Google Scholar]
- Role of viability of probiotic strains in their persistence in the gut and in mucosal immune stimulation. J. Appl. Microbiol.. 2004;97(4):673-681.
- [Google Scholar]
- Proposed model: Mechanisms of immunomodulation induced by probiotic bacteria. Clin. Vaccine Immunol.. 2007;14(5):485-492.
- [Google Scholar]
- The link between the consumer and the innovations in food product development. Foods. 2020;9(9):13-17.
- [Google Scholar]
- Isolation and characterization of potential probiotics from dairies. Iranian J. Microbiol.. 2017;9(4):234-243.
- [Google Scholar]
- Han, K.J., Lee, J.E., Lee, N.K., Paik, H.D., 2020. Antioxidant and anti-inflammatory effect of probiotic Lactobacillus plantarum KU15149 derived from Korean homemade diced-radish kimchi. J. Microbiol. Biotechnol. 2020; 30(4), 591-598.
- Intestinal ascending colon morphometrics in rats submitted to severe protein malnutrition. Int. J. Morphol.. 2008;26(1):5-11.
- [Google Scholar]
- Do long-lived plasma cells maintain a healthy microbiota in the gut? Trends Immunol.. 2018;39(3):196-208.
- [Google Scholar]
- Probiotic characterization of Lactobacillus brevis KU15153 showing antimicrobial and antioxidant effect isolated from kimchi. Food Sci. Biotechnol.. 2019;28:1521-1528.
- [Google Scholar]
- Corrigendum to “Cholesterol-Lowering Potential probiotics as Potential Biotherapeutics for Metabolic Diseases”. J. Diabetes Res.. 2022;2012:1-14.
- [Google Scholar]
- Probiotic Lactobacillus fermentum KU200060 isolated from watery kimchi and its application in probiotic yoghurt for oral health. Microb. Pathog.. 2020;147:104-430.
- [Google Scholar]
- Lollo, Pablo Christiano B., Carolina Soares de Moura, Priscila Neder Morato, Adriano Gomes Cruz, Wellington de Freitas Castro, Cinthia Baú Betim, Luciana Nisishima et al. 2013. Probiotic yogurt offers higher immune-protection than probiotic whey beverage. Food Res. Int. 54 (1), 118-124.
- Morphoquantitative evaluation of the duodenal myenteric neuronal population in rats fed with hypoproteic ration. Biocell. 2005;29(1):39-46.
- [Google Scholar]
- Effect of potential probiotics on intestinal barrier function. Ann. New York Acad. Sci.. 2009;1165(1):183-189.
- [Google Scholar]
- Does the use of potential probiotics/synbiotics prevent postoperative infections in patients undergoing abdominal surgery? A meta-analysis of randomized controlled trials. European J. Clin. Pharmacol.. 2009;65:561-570.
- [Google Scholar]
- Evaluation of antimicrobial properties and their substances against pathogenic bacteria in-vitro by probiotic Lactobacilli strains isolated from commercial yoghurt. Clin. Nutr. Exper.. 2019;23:97-115.
- [Google Scholar]
- Lactobacillus plantarum with broad antifungal activity: A promising approach to increase safety and shelf-life of cereal-based products. Int. J. Food Microbiol.. 2017;247:48-54.
- [Google Scholar]
- Renoprotection of selected antioxidant-rich foods (Water Spinach and Red Grape) and potential probiotics in gentamicin-induced nephrotoxicity and oxidative stress in rats. Life. 2022;12(1):1-14.
- [Google Scholar]
- Effects of dietary probiotic (Lactobacillus acidophilus) on hematology, blood biochemistry and lipid profile of carbon tetrachloride-induced toxicity in rats. Int. J. Sci. Res.. 2018;2319–7064
- [Google Scholar]
- Safety assessment of two new Lactobacillus strains as potential probiotics for humans using a rat model. PLoS One. 2016;11(7):e0159851.
- [Google Scholar]
- Potential probiotic characteristics and safety assessment of Lactobacillus rhamnosus SKG34 isolated from Sumbawa Mare’s milk. Microbiol. Biotechnol. Lett.. 2022;50(1):51-62.
- [Google Scholar]
- Meta-analysis: randomized trials of Lactobacillus plantarum on immune regulation over the last decades. Front. Immunol.. 2021;12:1-8.
- [Google Scholar]
Appendix A
Supplementary material
Supplementary data to this article can be found online at https://doi.org/10.1016/j.jksus.2024.103375.
Appendix A
Supplementary material
The following are the Supplementary data to this article:


