

Translate this page into:
Effect of acidified biochar on soil phosphorus availability and fertilizer use efficiency of maize (Zea mays L.)
⁎Corresponding authors. sabashir@gudgk.edu.pk (Safdar Bashir), liyunzhou2007@126.com (Yunzhou Li)
-
Received: ,
Accepted: ,
This article was originally published by Elsevier and was migrated to Scientific Scholar after the change of Publisher.
Peer review under responsibility of King Saud University.
Abstract
This study evaluated the impact of various biochars prepared from different sources and their acidified forms on soil phosphorus (P) availability and fertilizer use efficiency (FUE) of maize (Zea mays L.) crop. Plastic pots of 20 kg capacity (59 × 46 × 15 cm) were filled with 15 kg soil and seven seeds of hybrid maize (cv. Pioneer 30Y87) were sown in each pot. Various biochars and their acidified forms, including green waste biochar (GWB), acidified green waste biochar (AGWB), corncob biochar (CCB) and acidified corncob biochar (ACCB) were added in each pot t 90 g/pot before seed sowing. The control treatments were; T1 (C + 50% P), T2 (C + 75% P) and T3 (C + 100% P). The experimental treatments included T4 (CCB + 50% P), T5 (CCB + 75% P), T6 (CCB + 100% P), T7 (ACCB + 50% P), T8 (ACCB + 75% P), T9 (ACCB + 100%P), T10 (GWB + 50%P), T11 (GWB + 75%P), T12 (GWB + 100%P), T13 (AGWB + 50%P), T14 (AGWB + 75%P) and T15 (AGWB + 100%P). Results indicated that soil pH decreased (8.5 with AGWB compared to 8.76 with C), soil organic carbon (SOC) was significantly improved with all treatments. Soil electrical conductivity (EC) and cation exchange capacity (CEC) were also influenced by GWB (26 cmolckg−1) and ACCB (7.25 cmolckg−1). Bioavailability of P was highest (90 mg kg−1) with AGWB compared to control treatments. Similarly, addition of GWB and AGWB along with 50% P recorded significant improvement in plant height and fresh weight compared to control treatments. Therefore, it is suggested that among all the biochar types, AGWB is capable of improving chemical properties of the studied soil, growth, yield and nutrient uptake in maize crop compared to sole the application of P-fertilizers.
Keywords
Maize
Acidified Biochar
Calcareous Soil
P-bioavailability

1 Introduction
Maize (Zea mays L.) one of the most important cereal crop after rice and wheat globally. Maize is cultivated on 9.5 million ha area in Pakistan with annual production of ∼ 3.49 million tons. Cultivation of maize crop is increasing all around the globe that accounts 68% of the total farmlands; however, contributes 46% towards total global maize production (Bashir et al., 2021a). This low yield is due to high phosphorus (P) requirement of maize, and tropical soils have limited available P (Hassan et al., 2017). Phosphorus is an essential macronutrient required by crops in large amount; however, its deficiency is considered as a serious matter of concern for crop production, affecting soil fertility and productivity (Khan et al., 2021). Khan et al. (2021) reported that P solubility in calcareous soil is very low because of its fixation either with lime or with clay surfaces and precipitation with calcium (Ca) ions in the saline soils or aluminum and iron in the acidic soils. Similarly, P is an essential nutrient required for higher yield and better grain quality. Therefore, P application is inevitable since ∼ 90% Pakistani soils are P-deficient (Hassan et al., 2017). Khan et al. (2021) suggested that the incorporation of organic soil amendment with the different P fertilizers sources in alkaline soil significantly improved plant growth through plant growth promoting bacteria (i.e., Bacillus sp. MN-54) and also improved nodulation, nutrient uptake, and crude proteins content in chickpea. Approximately 90% of Pakistani soils have been declared as P deficient and showed the less P availability to plants. Phosphatic fertilizers application is recognized a common practice to preserve and improve P status of soils (Khan et al., 2021). However, the continuous use of P fertilizers has caused many environmental threats around the globe. Thus, innovative and eco-friendly options should be adopted to sustain the soil without causing the deterioration in sustainable ecosystem (Biswakarma et al., 2018).
Among various strategies used to overcome this constraint, application of processed organic residues known as biochar alone or in combination with inorganic P sources is gaining attention recently (Bashir et al., 2019; Zhang et al., 2013; Bashir et al., 2021a). Biochar incorporation to soil can lower soil pH and improve soil quality. Improved physico-chemical and biological properties of soils like aggregation of soil colloids, water holding capacity, soil pH and beneficial microbial populations ultimately enhance crop yields (Bashir et al., 2021b; Xu et al., 2014). Retention of P due to biochar application is owed to the sorption process that enhances P-availability and uptake by plants because of increased soil anion exchange capacity (DeLuca et al., 2015). Farrell et al. (2014) reported significant influence of biochar on P availability in calcareous soil. Maize requires 6.5–7.2 soil pH for optimum growth and production, whereas calcareous soils have higher pH, i.e., 7.6–8.4 (Hassan et al., 2017; Zhang et al., 2013).
Biochars give different response in acidic and alkaline soils, which alter soil pH and calcareousness. Bhatnagar and Sillanpää (2011) indicated that the acid modification of biochar could increase the positive sites, which could facilitate to increase the adsorption of anions (Bashir et al., 2020a). It is well known that biochar significantly alter soil pH; however, its impact on calcareous soil is still unclear. Therefore, this study was conducted to assess; i) the comparative effect of various types of biochars and their acidified forms on soil pH, P bioavailability and ii) maize growth under reduced phosphate fertilizer doses in calcareous soil.
b2 Materials and methods
2.1 Biochar preparation and characterization
Corncobs and green waste were collected from Bahauddin Zakariya University research farm and shifted to green house for drying. After drying, the materials were chopped and ground to small pieces for biochar production. Finally, biochar was prepared using the method described by (Bashir et al., 2018a) in muffle furnace under limited oxygen supply. The collected biochars were crushed and passed through 0.50 mm sieve. For acidification, two sub-samples of biochars (100 g) were taken, 0.5 N (1 L) H2SO4 was added to these samples and shaken well for 1 h at 80 rpm. The suspension was filtered after 12 h by using a membrane of 0.45 μm (GE Water and Process Technologies, Trevose, PA). Biochars were washed with distilled water and oven dried for 48 h at 65 °C. Both sub-samples were mixed well separately to get a homogenous composite sample. For characterization of biochar (Table 1), samples were ground and oven dried until constant weight. Values are means of three replicates ± standard deviations, means followed by different letters are significantly (P ≤ 0.05) different from each other according to Tukey's HSD test; NS indicates that the interactive effect was non-significant; 1. Green waste biochar; 2. Acidified green waste biochar; 3. Corn cob biochar; 4. Acidified corn cob biochar.
Treatments
Phosphorus Rates
50%
75%
100%
50%
75%
100%
50%
75%
100%
Electrical conductivity (dS m−1)
Cation exchange capacity (cmolc kg−1)
Soil organic carbon (%)
Control
1. ± 0.01NS
1.06 ± 0.05
1.12 ± 0.07
7.30 ± 0.30f
7.34 ± 0.13ef
7.70 ± 0.21def
0.423 ± 0.02NS
0.447 ± 0.03
0.458 ± 0.04
GWB1
1.35 ± 0.10
1.41 ± 0.07
1.48 ± 0.12
7.91 ± 0.20b-f
7.86 ± 0.23c-f
7.93 ± 0.16b-e
0.744 ± 0.02
0.757 ± 0.03
0.771 ± 0.03
AGWB2
1.05 ± 0.09
1.11 ± 0.07
1.18 ± 0.12
7.98 ± 0.15bcd
8.13 ± 0.08bcd
8.17 ± 0.03bcd
0.747 ± 0.02
0.751 ± 0.02
0.768 ± 0.03
CCB3
1.28 ± 0.12
1.34 ± 0.10
1.43 ± 0.09
8.35 ± 0.14bc
8.13 ± 0.23bcd
8.08 ± 0.13bcd
0.717 ± 0.02
0.733 ± 0.01
0.746 ± 0.01
ACCB4
1.03 ± 0.10
1.10 ± 0.12
1.13 ± 0.11
8.96 ± 0.20a
8.44 ± 0.21abc
8.47 ± 0.34ab
0.751 ± 0.02
0.764 ± 0.03
0.784 ± 0.04
Ash contents in biochars were determined according to the method proposed by (Slattery et al., 1991). The moisture contents of the biochars were determined gravimetrically through measuring the difference between fresh and dry weights of biochars after drying in an oven at 65 °C (Eyela WFO-600ND, Tokyo Rikakikai, Tokyo, Japan). Phosphorus concentration in biochar digest was measured on a UV–visible spectrophotometer (SPECORD, Analytik jena, Germany) using standard curve, after developing yellow color by vanadate-molybdate method (Chapman and Pratt, 1962).
2.2 Characterization of experimental soil
Soil texture was determined using 1% (w/w) solution of sodium hexa-metaphosphate by following methods described by Estefan (Lu, 2000). For chemical properties, soil saturation paste was prepared with 250 g soil. For pH, a bench type pH meter (Model InoLab pH 720/Set WTW Germany) was used and electrical conductivity (EC) of soil samples was measured on auto ranging microprocessor EC meter (Model, Hanna 9835). Cation exchange capacity was calculated by the method proposed by Polemio and Rhoades (Lu, 2000). Organic matter content was determined by following the method of Walkley and Black (Lu, 2000) and available P in soil was estimated by calorimetric method (Lu, 2000), modified by (Bashir et al., 2018a; Bashir et al., 2020b).
2.3 Determination of organic phosphorus in soil
Ignition method (Andersen, 1976) was used to measure organic P in soil using H2SO4 for soil digestion and NaOH (5 N) for neutralization of the extract. Organic P was estimated using spectrophotometer at 882 nm. Total P uptake was calculated by using the formula;
Phosphorus uptake = (NC × DM) / 100
Here, PC = P concentration (%), DM = dry matter (mg pot 1)
Due to biochar addition, change in P recovery was calculated by using formula used by Mengel and Kirkby (Mengel and Kirkby, 2001);
Nutrient recovery (%) = (PUB − PUC) / PAB
Here, PUB = P uptake in biochar amended treatment, PUC = P uptake in control (without biochar), PAB = P added through biochar.
2.4 Pot experiment
The pot trial was carried out according to complete randomized design (CRD) with three replications at Department of Soil Science, Faculty of Agricultural Sciences and Technology, Bahauddin Zakariya University, Multan, Pakistan. The studied soil was collected from P-deficient sites and soil was air dried prior to physicochemical analysis. Afterwards, the soil was crushed and passed through a 2 mm sieve. The soil was sandy-clay-loam in nature (sand 54.3%, silt 23.5%, and clay 22.2%) had 8.80 pH, 1.16 dS m−1 EC, 0.62% organic matter, 3.34% CaCO3, 13.73 cmolc kg−1 CEC, 0.09% total N, 134 mg kg−1 extractable K, 4.1 mg kg−1 Olsen P and 131 mg kg−1 organic P. Plastic pots of (59 × 46 × 15 cm) of 20 kg soil capacity were filled with 15 kg soil and seeds of hybrid maize cultivar “Pioneer 30Y87” were sown in the pots (seven in each pot). Biochars were coded as GWB for green waste biochar, AGWB for acidified green waste biochar, CCB for corncob biochar and ACCB for acidified corncob biochar. The biochars with a concentration of 90 g/pot were applied prior to sowing. Control treatments were T1 (C + 50% P), T2 (C + 75% P) and T3 (C + 100% P). The experimental treatments included T4 (CCB + 50% P), T5 (CCB + 75% P), T6 (CCB + 100% P), T7 (ACCB + 50% P), T8 (ACCB + 75% P), T9 (ACCB + 100%P), T10 (GWB + 50%P), T11 (GWB + 75%P), T12 (GWB + 100%P), T13 (AGWB + 50%P), T14 (AGWB + 75%P) and T15 (AGWB + 100%P). The NPK (250, 175 and 125 kg ha−1) was applied as in the form of urea, single super phosphate and sulphate of potash, respectively. The whole amounts of P and K were applied at the time of sowing and N was applied in three splits. During the cropping period, weeds were manually controlled and six maize plants were maintained in each pot. Carbofuran was applied to shield the maize plants from Atherigona soccata and Ostrinia nubilalis. The pots were irrigated according to moisture needs. At vegetative stage, three plants were removed from the pots and remaining three were maintained for reproductive stage. The impact of P and biochar application on P uptake and maize growth was elucidated by recording different parameters in accordance with (Mengel and Kirkby, 2001). The P contents in plant tissues were measured by Lu (2000). The extracts for P estimation were obtained through wet digestion method by using concentrated H2SO4 and 35% H2O2 (Wolf, 1982).
2.5 Estimation of P content in plants and biochar
Colorimetric method (vanadate-molybdate yellow) was used to determine P contents in the biochar (Chapman and Pratt, 1962). In a volumetric flask (50 ml), digested aliquot (5 ml), 0.25 % ammonium vanadate (5 ml) and 5% ammonium molybdate were added. This flask was left for half an hour. At 400 nm, readings on spectrophotometer were noted. The P contents (%) in plant samples were measured by Method 54a, US Salinity Lab. Staff (1954).
2.6 Statistical analysis
For statistical analysis, software named Statistix 9® for Windows (Analytical Software, Tallahassee, USA) was used. Analysis of variance (two-way) following Tukey's HSD test was used to analyze the data (Steel et al., 1997).
3 Results
3.1 Effect of biochars on soil chemical properties at vegetative and reproductive stages of maize
The interaction of P and acidified biochar had significant (P ≤ 0.05) effect on soil pH (Fig. 1). Soil pH was dramatically decreased when acidified biochars were added (AGWB and ACCB) at 0.6% w/w compared to control. Overall, the lowest soil pH (8.5) was observed for AGWB-amended soil with 100% P dose. The pH of GWB and CCB-amended soil was 0.35 and 0.62% higher than ACCB and AGWB-amended soil with 100% P application. The AGWB and ACCB application decreased soil pH by 2.66 and 2.01%, respectively under 50% P dose. Thus, addition of acidified biochar lower soil pH more than non-acidified biochars. Similarly, soil pH was significantly decreased by 0.61, 2.20, 0.76 and 1.75% with GWB, AGWB, CCB and ACCB application combined with 50% P at reproductive stage. Soil EC was also influenced by all biochars and an increase was noted in EC with increasing P rate from 50 to 100% during both growth stages (Table 1 and S2). Similarly, soil CEC was affected by biochars only and interaction among biochars and P rates was non-significant (Table 2). The highest CEC (7.25 cmolckg−1) was recorded for ACCB and the lowest CEC (6.60 cmolckg−1) was noted for control treatment. Likewise, at reproductive stage soil CEC was significantly affected (P ≤ 0.05) by biochars (Table 1). The highest increase in CEC at reproductive stage was recorded with GWB, AGWB, CCB and ACCB (by 8.26, 9.32, 14.34 and 22.71%, respectively) P at 50%. Likewise, biochars significantly (P ≤ 0.05) increased SOC compared to control treatments at vegetative stage. However, biochars by P rates interactions were non-significant (Table 2). The highest SOC (0.77%) was also recorded for AGWB and ACCB and 100% P, while the lowest SOC (0.56%) was observed for control treatment with 50 and 75% P supply. Similarly, the highest SOC (0.784%) at reproductive stage was noted for ACCB and 100% P supply.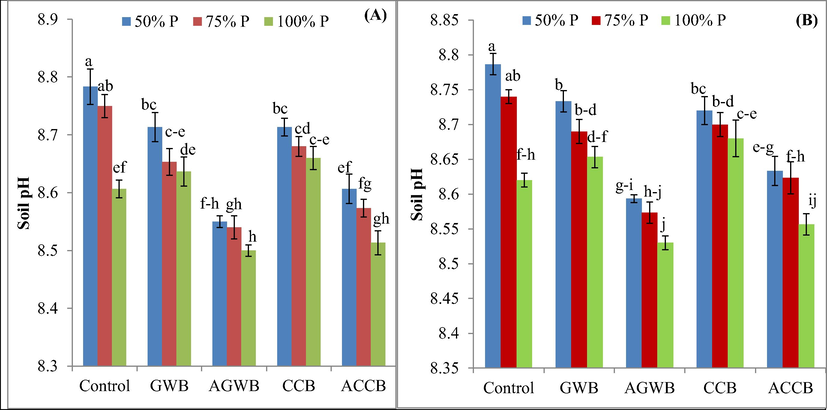
Effect of acidified and non-acidified biochars and phosphorus rates on post-harvest soil pH at vegetative (A) and reproductive (B) growth stage of maize plants. Error bars represent ± standard deviations; different letters over bars indicate significant (P ≤ 0.05) difference according to Tukey's HSD test; GWB, AGWB, CCB and ACCB represent green waste biochar, acidified green waste biochar, corn cob biochar and acidified corn cob biochar, respectively.
Treatments
Phosphorus Rates
50%
75%
100%
50%
75%
100%
50%
75%
100%
Electrical conductivity (dS m−1)
Cation exchange capacity (cmolc kg−1)
Soil organic carbon (%)
Control
1.33 ± 0.002NS
1.39 ± 0.04
1.45 ± 0.06
6.60 ± 0.05NS
6.60 ± 0.05
6.69 ± 0.06
0.56 ± 0.01NS
0.56 ± 0.008
0.57 ± 0.02
GWB1
1.68 ± 0.09
1.74 ± 0.06
1.81 ± 0.11d
7.01 ± 0.05
7.01 ± 0.05
7.04 ± 0.03
0.74 ± 0.01
0.75 ± 0.02
0.72 ± 0.02
AGWB2
1.38 ± 0.09
1.44 ± 0.07
1.51 ± 0.11
7.087 ± 0.06
7.08 ± 0.05
7.13 ± 0.06
0.76 ± 0.006
0.73 ± 0.02
0.77 ± 0.02
CCB3
1.61 ± 0.12
1.67 ± 0.09
1.76 ± 0.09
7.24 ± 0.05
7.19 ± 0.05
7.19 ± 0.06
0.75 ± 0.02
0.76 ± 0.01
0.76 ± 0.03
ACCB4
1.36 ± 0.12
1.43 ± 0.12
1.46 ± 0.10
7.25 ± 0.06
7.18 ± 0.02
7.19 ± 0.02
0.75 ± 0.009
0.76 ± 0.01
0.77 ± 0.01
3.2 Effect of biochars on P availability in soil and plant shoots at vegetative and reproductive stages of maize crop
Biochars by P doses interaction significantly altered P availability in plant shoots and soil. The highest available P (90 mg kg−1) was recorded for AGWB with 100% P supply, while the lowest available P (30.6 mg kg−1) was recorded for control treatment with 50% P fertilizer application (Fig. 2). Soil available P was increased by 125.31% with AGWB over control treatment. The P contents were increased by 8.21, 26.07, 5.81 and 47.78% with the application of GWB, AGWB, CCB and ACCB under 100% of P supply at reproductive stage compared to control treatment. Likewise, soil organic P was significantly (P ≤ 0.05) altered by biochars and P interaction (Table 3). The highest soil organic P (140 mg kg−1) was recorded with GWB and 75% P application. However, the lowest soil organic P was recorded for ACCB with 100% P application rate. At reproductive stage, soil organic P was enhanced by 3.10, 17.82, 4.49 and 15.89% with the application of GWB, AGWB, CCB and ACCB, respectively. Biochars significantly (P ≤ 0.05) increased P contents in shoots compared to control. The 100% supply and addition of GWB, AGWB and CCB increased P concentration by 6.88, 37.38, 5.89 and 43.88%, respectively compared to control treatments. The values are means of three replicates ± standard deviation, means followed by different letters are significantly (P ≤ 0.05) different from each other according to Tukey’s HSD test; 1. Green waste biochar; 2. Acidified green waste biochar; 3. Corn cob biochar; 4. Acidified corn cob biochar.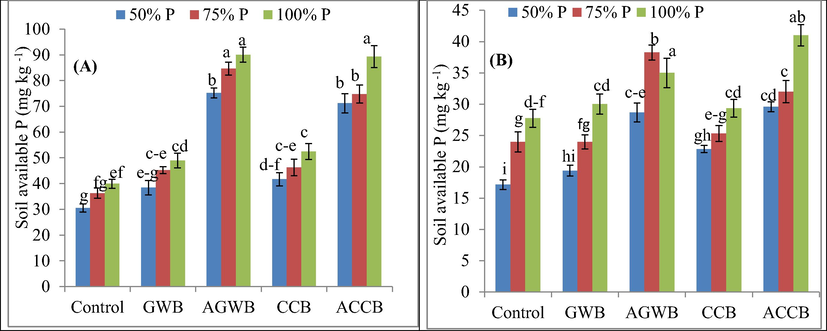
Effect of acidified and non-acidified biochars and phosphorus rates on post-harvest soil available phosphorus at vegetative (A) and reproductive (B) growth stage of maize plants. Error bars represent ± standard deviations; different letters over bars indicate significant (P ≤ 0.05) difference according to Tukey's HSD test; GWB, AGWB, CCB and ACCB represent green waste biochar, acidified green waste biochar, corn cob biochar and acidified corn cob biochar, respectively.
Treatments
Phosphorus Rates
50%
75%
100%
Control
218 ± 1.23ad
228 ± 7.52abc
235 ± 7.52a
GWB1
209 ± 14.43cde
217 ± 5.31ad
228 ± 2.11abc
AGWB2
203 ± 6de
215 ± 1.87ad
193 ± 10.51e
CCB3
230 ± 1.79ab
231 ± 7.26ab
224 ± 3.90ad
ACCB4
210 ± 7.13cde
211 ± 4.50be
198 ± 8.50de
3.3 Effect of biochars on plant growth
The interaction among biochars and P doses significantly affected plant height, and fresh and dry biomass (Table 4). The longest plant height (127.67 cm) was observed for CCB application under 100% P supply against the lowest (88.72 cm) in control treatment (Table 4). Biochars by P doses interaction improved plant fresh and dry biomass at vegetative and reproductive stages (Fig. 3). Values are means of three replicates ± standard deviations, means followed by different letters are significantly (P ≤ 0.05) different from each other according to Tukey's HSD test; 1. Green waste biochar; 2. Acidified green waste biochar; 3. Corn cob biochar; 4. Acidified corn cob biochar.
Treatments
Phosphorus Rates
50%
75%
100%
50%
75%
100%
Root fresh weight (g pot−1)
Root dry weight (g pot−1)
Control
100 ± 4e
147 ± 8 cd
141 ± 4d
18 ± 2 g
23 ± 1ef
24 ± 0def
GWB1
153B ± 7 cd
166 ± 3b
160.5 ± 4bc
23 ± 2ef
26 ± 1cde
24 ± 1def
AGWB2
154B ± 7 cd
194 ± 5a
143 ± 4d
28 ± 1bcd
32 ± 2ab
27 ± 2cde
CCB3
98 ± 7e
153B ± 3 cd
161 ± 4bc
21 ± 1 fg
32 ± 1ab
32 ± 1ab
ACCB4
198 ± 4a
161 ± 9bc
159 ± 4bc
35 ± 1a
30 ± 1bc
27 ± 2cde
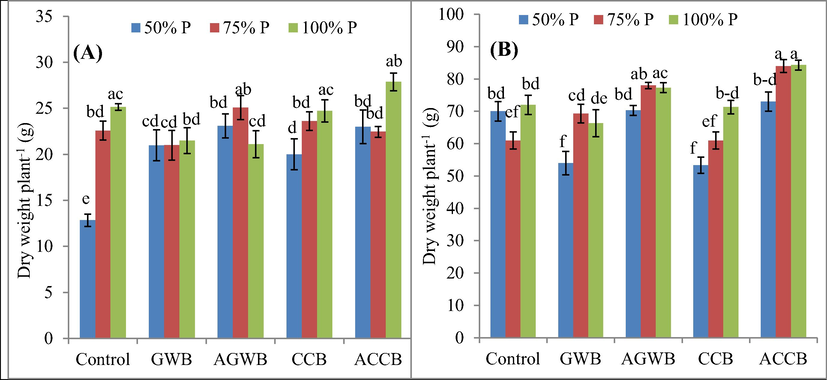
Effect of acidified and non-acidified biochars and phosphorus rates on post-harvest plant dry weight at vegetative (A) and reproductive (B) growth stage of maize plants. Error bars represent ± standard deviations; different letters over bars indicate significant (P ≤ 0.05) difference according to Tukey's HSD test; GWB, AGWB, CCB and ACCB represent green waste biochar, acidified green waste biochar, corn cob biochar and acidified corn cob biochar, respectively.
3.4 Yield-related traits
Under 100% p supply, cob length was increased by 5.15 and 4.63% with GWB and CCB application, respectively compared to control treatment (Table 5). Biochars and P doses interaction significantly (P ≤ 0.05) influenced cob weight. Cob weight was increased by 71.67, 54.17, 119.17 and 101.67% with CCB, ACCB, GWB and AGWB application, respectively under 50% P supply compared to control treatment. Significant increase was noted in 1000-grain weight with all biochars (Fig. 3). Values are means of three replicates ± standard deviations, means followed by different letters are significantly (P ≤ 0.05) different from each other according to Tukey's HSD test; 1. Green waste biochar; 2. Acidified green waste biochar; 3. Corn cob biochar; 4. Acidified corn cob biochar.
Treatments
Phosphorus Rates
50%
75%
100%
50%
75%
100%
50%
75%
100%
Plant height (cm)
Cob length (cm)
Cob weight (g)
Control
175 ± 5e
192 ± 10a-d
199 ± 4a-d
15 ± 0.56 cd
16 ± 0.43a-d
16 ± 0.40abc
40 ± 4 g
72 ± 3def
76 ± 4cde
GWB1
186 ± 5de
189 ± 5cde
196 ± 3a-d
16 ± 0.58abc
17 ± 1.42ab
17 ± 0.64a
88 ± 3bc
78.5 ± 3cde
94 ± 5ab
AGWB2
197AB ± 3 cd
210 ± 5a
203 ± 8abc
17 ± 0.88ab
17 ± 0.09ab
16 ± 0.61a-d
81 ± 2 cd
102 ± 4a
78 ± 4cde
CCB3
199 ± 8a-d
194 ± 9a-d
196 ± 10a-d
15 ± 0.64a-d
16 ± 0.56a-d
17 ± 0.64a
69 ± 5ef
78 ± 4cde
82 ± 5bcd
ACCB4
191 ± 4cde
203 ± 6abc
209 ± 5ab
15 ± 0.64bcd
14 ± 0.74d
16 ± 0.90a-d
62 ± 3f
72 ± 4def
74 ± 3de
3.5 Phosphorus in plant tissues
The P concentration in plant tissues, including shoot, root and grain was significantly (P ≤ 0.05) increased by all biochars and P levels (Table 7). The highest P concentration in plant tissues was recorded for ACCB in combination with 75 and 100% P doses. Phosphorus concentration in plant shoot was increased by 2.61, 13.44, 6.08 and 19.29% with the application of GWB, AGWB, CCB and ACCB, respectively under 100% P supply compared to control treatment. Addition of 50% P dose increases P contents by 29.23, 15.49, 36.27 and 19.29% with the application of GWB, AGWB, CCB and ACCB, respectively.
3.6 Phosphorus recovery
Plant P recovery was significantly influenced by P doses by biochars interactions (Table 6). Higher P recovery was recorded for AGWB under 50% P supply. In case of non-acidified biochar, the highest P recovery was recorded for CCB under 50% P dose. The values are means of three replicates ± standard deviation, means followed by different letters are significantly (P ≤ 0.05) different from each other according to Tukey’s HSD test; 1. Green waste biochar; 2. Acidified green waste biochar; 3. Corn cob biochar; 4. Acidified corn cob biochar. Values are means of three replicates ± standard deviations, means followed by different letters are significantly (P ≤ 0.05) different from each other according to Tukey's HSD test; NS indicates that the interactive effect was non-significant; 1. Green waste biochar; 2. Acidified green waste biochar; 3. Corn cob biochar; 4. Acidified corn cob biochar.
Treatments
Phosphorus rates
50%
75%
100%
Control
–
2.18 ± 0.16i
5.84 ± 0.48 fg
GWB1
3.8 ± 55hi
8.66 ± 67efg
6.65 ± 63 fg
AGWB2
23.05 ± 1.09a
21.02 ± 0.60abc
17.47 ± 0.67c
CCB3
11.27 ± 0.72de
9.53 ± 0.92ef
10.05 ± 0.76ef
ACCB4
21.94 ± 1.08ab
19.74 ± 0.84bc
14.44 ± 0.97d
Treatments
Phosphorus Rates
50%
75%
100%
50%
75%
100%
50%
75%
100%
Phosphorus in shoot (mg g−1)
Phosphorus in grain (mg g−1)
Phosphorus in root (mg g−1)
Control
0.39 ± 0.01 h
0.44 ± 0.012gh
0.48 ± 0.07d-g
0.91 ± 0.04cde
0.82 ± 0.03ef
0.77 ± 0.009f
0.51 ± 0.02NS
0.55 ± 0.018
0.59 ± 0.013
GWB1
0.51 ± 5.81b-e
0.53 ± 0.02a-d
0.50 ± 0.01c-f
0.88 ± 0.064def
0.94 ± 0.06 cd
0.97 ± 0.03 cd
0.61 ± 0.02
0.65 ± 0.02
0.64 ± 0.03
AGWB2
0.45 ± 0.013 fg
0.52 ± 0.02b-e
0.55 ± 0.018ab
1.34 ± 0.03a
1.44 ± 0.044a
1.38 ± 0.037a
0.61 ± 0.01
0.67 ± 0.03
0.62 ± 0.019
CCB3
0.54 ± 0.02a-c
0.55 ± 0.012ab
0.51 ± 0.03b-e
1.03 ± 0.03bc
1.10 ± 0.04b
1.14 ± 0.03b
0.61 ± 0.013
0.64 ± 0.023
0.62 ± 0.026
ACCB4
0.47 ± 0.013e-g
0.56 ± 0.014ab
0.58 ± 0.022a
1.37 ± 0.033a
1.44 ± 0.048a
1.42 ± 0.04a
0.62 ± 0.02
0.68 ± 0.031
0.67 ± 0.020
4 Discussion
Biochar is organic carbon, nutrient-rich material, which has highly aromatic structure and retains in soil for centuries after introduction to soil (Farrell et al., 2014). Biochar retains higher amounts of essential plant nutrients than organic soil amendments due to its high surface area, porosity and CEC (Lehmann et al., 2011). In addition, biochar provides more plant nutrients by adding organic matter and improves soil physicochemical properties. In this experiment, acidified and non-acidified biochars significantly (P ≤ 0.05) improved soil chemical properties, i.e., pH, EC, CEC and SOC. It is interesting to mention that the significant reduction in soil pH was observed at vegetative and reproductive stage with acidified biochars (Fig. 1a, b). The highest decrease in soil pH was recorded with the incorporation of AGWB. The findings of the current study suggested that this reduction might be due to the excessive release of protons (H+) from the exchange sites of acidified biochars. It can be demonstrated that the production of organic acid during the decomposition of organic matter present in soil, might also contributed to reduced pH [25, 26]. The addition of biochar to acidic soils increased soil pH because of its liming effect and presence of basic substances [12, 6, 27]. However, soil pH decreased after the incorporation of GWB, CCB, AGWB and ACCB in this study. The presence of carboxylic functional groups on biochar surface can be produced through slow oxidization process (Cheng et al., 2008). Thus, formation of acidic functional groups might have great contribution to neutralize alkalinity and eventually lower soil pH. Blackwell et al. (Blackwell et al., 2010) confirmed that acidified biochars were only effective to reduce soil pH under calcareous condition. Electrical conductivity is mainly dependent on ash composition and ash content of biochar as well as ionic composition of soil. The GWB had high EC, which might be due to high ash content (Table S1). Lentz and Ippolito (Lentz and Ippolito, 2012) found that non-acidified biochar increased soil EC for short time.
The CEC is most important soil property, which determines nutrients availability and their adsorption/desorption in soil. Incorporation of biochars significantly increased soil CEC by 6 to 9% relative to control in current study. Large surface area of biochar could enhance soil sorption sites and improved soil CEC [12, 25, 9]. Additionally, high CEC of biochar may also contribute to increase soil CEC [31,32].
Biochars increased SOC (Table S2). Biochar increases soil microbial activity (Saranya et al., 2011), which may increase organic matter content in the soil. We assumed that incorporation of acidified biochar into alkaline soil could ameliorate soil alkalinity and enhance carbon sequestration might contribute towards lessening carbon dioxide discharge and improve organic matter contents in calcareous soils [12, 27]. Agbede et al. (Agbede et al., 2008) and Cros and Sohi (Cross and Sohi, 2011) reported that biochar addition to soil can increase SOC, which improves SOC. Under reduced phosphatic fertilizer doses, 0.6% w/w biochars addition increases soil available P contents (Fig. 2 ab). Acidified biochars have the ability to reduce soil pH and concentration of Ca and Mg in alkaline soil, which might promote the chances of P solubility in calcareous soils (Bashir et al., 2018b). Biochar alters soil pH; hence, influences P precipitation and increases solubility by affecting P interaction with Ca2+ (DeLuca et al., 2015). Additionally, soil available P content decreased from vegetative to reproductive stage and this decrease was comparatively slower in acidified biochar compared to control treatment (Fig. 2ab). Acidified biochars proved effective in decreasing soil pH (Fig. 2ab). This decrease in soil pH might be one of the main reasons to improve P availability in AGWB and ACCB treatments. Combustion process volatilize C from plant tissue and break organic bonding of P; hence, P contents with charred material may increase. Therefore, GWB and CCB was produced at low pyrolytic temperature (350–400 °C) in the current study since pyrolysis of material at low temperature provides more available P and avoids P precipitation by changing pH (Atkinson et al., 2010). The mechanisms suggested for biochar influence on P availability are change in soil pH, which then influences the interaction of P with other cations, or enhanced retention through anion exchange (Bashir et al., 2018b).
Incorporation of biochars with P doses significantly (P ≤ 0.05) altered P status in soil and its uptake by plant tissues. The present study confirmed that addition of acidified biochars increased organic P in soil (Table S3). Because of organic nature of biochar, it may contain high concentration of organic P. However, soil organic P was decreased with the application of in acidified biochars compared to non-acidified biochars. Acidic contents increased mineralization, which increased available and decreases organic P (Sadler and Stewart, 1975). Biochar poses some indirect effects on P availability and uptake through changes in the soil environment because of microorganisms (Atkinson et al., 2010). Phosphorus concentration was significantly (P ≤ 0.05) higher in all biochars; however, P contents in shoots were lower with AGWB and ACCB application than control treatment at reproductive stage. Current study suggested that the highest P accumulation in leaves was recorded during vegetative stage and decreased rapidly towards crop maturity. It might be due to temporary effect of acidified biochar or it may be due to the translocation of P from shoots to grain. The increased grain P contents might be attributed to acidified biochar and P translocation from shoots to grain. Similarly, Wang et al. (2012) reported that biochar incorporation in ryegrass significantly improved yield and P uptake.
The P concentration in roots was higher under GWB application compared to control treatment at reproductive stage (Table 7). It might be due to higher P uptake to aerial parts in biochars applied soil over control. Atkinson et al. (2010) explained that change in soil pH influenced P interaction with other cations and enhanced retention through anion exchange, which increased P availability. Sometimes biochar stimulated root growth as reviewed by (Lehmann et al., 2011; Steiner et al., 2008). Good plant height is very important for photosynthesis, which ultimately affect yield. Biochars combined with P application enhanced plant height and biomass production compared to control treatment (Table 5). It might be due to improved P use efficiency with the application of acidified biochars. These results are in line with who reported that P levels enhanced plant height and dry weight of maize. Similarly, earlier studies Bashir et al. (2019); Bashir et al. (2021b) described that biochar application could accelerate plant growth. Biochar application combined with P enhanced plant development, growth and yield compared to control. Biochar positively influenced growth, development and yield of maize because of several active substances in the biochar after pyrolysis process (Bashir et al., 2021b).
Cob weight and 1000-grain weight were significantly (P ≤ 0.05) increased by the application of acidified biochar, while cob length remained unaffected (Table 5). The increased cob length might be attributed to higher photosynthesis, dry matter portioning and its assimilation (Imran, 2015). The increase in 1000-grain weight with increasing P levels and acidified biochars might be due to the improvement in source-sink relationship. Biochar increased the P availability to plants [42, 36], which improved plant growth and grain yield.
Imran (2015) suggested that application of biochar along with P doses showed the prominent increase in dense root system; thus, helped plants to uptake more P for the growth, survival, maintenance and reproduction. It has been demonstrated that incorporation of of acidified biochars in calcareous soil could enhance the chlorophyll contents, which absorbed more light and produced higher dry matter. Furthermore, the highest P use efficiency (23.05%) was found when soil was amended with AGWB which might be possible due to the more P availability in acidified biochar-treated soil. Our results suggested that the combination of acidified biochar with lower P fertilizer rates could prominently accelerate the yields, which might be due to the synergistic effects of biochar and fertilizer.
5 Conclusion
Although the impact of acidified biochar application on calcareous soils is not well established, our results revealed that acidified biochar improves chemical properties soil properties. Acidified biochar improved soil fertility by lowering soil pH, improved soil organic content, enhanced bioavailable P and P uptake at vegetative and reproductive stages. Incorporation of acidified biochars improved maize growth, yield and nutrient uptake compared to simple biochars. However, better results were recorded when acidified biochar was applied in combination with inorganic P compared to sole application of inorganic P. Thus, application of biochars in combination with inorganic P is recommended for improving fertility status of alkaline soil and crop growth.
6 Funding source
This work was supported by projects of the national Nature Science Foundation (No. 32060679) and projects of Guizhou University (No. GuidapeiYU[2019]52 and No. [2017]50). The current work was funded by Taif university Researchers supporting project number (TURSP-2020/38) Taif University, Taif, Saudi Arabia.
Acknowledgements
This work was supported by projects of the national Nature Science Foundation (No. 32060679) and projects of Guizhou University (No. GuidapeiYU[2019]52 and No. [2017]50). This work was financially supported by the Researchers supporting project number (TURSP-2020/38) Taif University, Taif, Saudi Arabia. Funding of this research project was provided by Higher Education Commission, Government of Pakistan under Start-up Research Grant Project (SRGP) # 1005.
Declaration of Competing Interest
The authors declare that they have no known competing financial interests or personal relationships that could have appeared to influence the work reported in this paper.
References
- Effect of Poultry Manure on Soil physical and chemical properties, growth and grain yield o sorghum in Southwest, Nigeria. Am.-Eurasian J. Sustain. Agric.. 2008;2(1):72-77.
- [Google Scholar]
- An ignition method for determination of total phosphorus in lake sediments. Water Res.. 1976;10(4):329-331.
- [Google Scholar]
- Potential mechanisms for achieving agricultural benefits from biochar application to temperate soils: a review. Plant Soil.. 2010;337(1-2):1-18.
- [Google Scholar]
- Efficiency of KOH-modified rice straw-derived biochar for reducing cadmium mobility, bioaccessibility and bioavailability risk index in red soil. Pedosphere. 2020;30(6):874-882.
- [Google Scholar]
- Role of sepiolite for cadmium (Cd) polluted soil restoration and spinach growth in wastewater irrigated agricultural soil. J. Environ. Manage.. 2020;258:110020.
- [CrossRef] [Google Scholar]
- Comparative role of animal manure and vegetable waste induced compost for polluted soil restoration and maize growth. Saudi J. Biol. Sci.. 2021;28(4):2534-2539.
- [CrossRef] [Google Scholar]
- Efficiency of different types of biochars to mitigate Cd stress and growth of sunflower (Helianthus; L.) in wastewater irrigated agricultural soil. Saudi J. Biol. Sci.. 2021;28(4):2453-2459.
- [CrossRef] [Google Scholar]
- Comparative efficiency of wheat straw and sugarcane bagasse biochar reduces the cadmium bioavailability to spinach and enhances the microbial activity in contaminated soil. Int. J. Phytorem.. 2019;21(11):1098-1103.
- [CrossRef] [Google Scholar]
- Comparative efficiency of rice husk derived biochar (RHB) and steel slag (SS) on cadmium (Cd) mobility and its uptake by Chinese cabbage in highly contaminated soil. Int. J. Phytorem.. 2018;20(12):1221-1228.
- [CrossRef] [Google Scholar]
- Bashir, S., Shaaban, M., Hussain, Q., Mehmood, S., Zhu, J., Fu, Q., Aziz, O., Hu, H. 2018. Influence of organic and inorganic passivators on Cd and Pb stabilization and microbial biomass in a contaminated paddy soil. J. Soils Sedim. DOI 10.1007/s11368-017-1796-z.
- A review of emerging adsorbents for nitrate removal from water. Chem. Eng. J.. 2011;168(2):493-504.
- [Google Scholar]
- Effect of phosphate solubilizing bacteria on yield of transplanted rice under lateritic belt of West Bengal. Int. J. Curr. Microbiol. Appl. Sci.. 2018;7:3192-3204.
- [Google Scholar]
- Effect of banded biochar on dry land wheat production and fertiliser use in south-western Australia: an agronomic and economic perspective. Soil Res.. 2010;48(7):531-545.
- [Google Scholar]
- Natural oxidation of black carbon in soils: changes in molecular form and surface charge along a climosequence. Geochim. Cosmochim. Acta. 2008;72(6):1598-1610.
- [Google Scholar]
- The priming potential of biochar products in relation to labile carbon contents and soil organic matter status. Soil Boil Biochem.. 2011;43(10):2127-2134.
- [Google Scholar]
- Biochar effects on soil nutrient transformations. Biochar for environmental management: science. Technology and implementation. New York, USA: Taylor and Francis; 2015. p. :421-454.
- Biochar and fertiliser applications influence phosphorus fractionation and wheat yield. Biol. Fertil. Soils. 2014;50(1):169-178.
- [Google Scholar]
- Phosphorus solubilizing bacteria and growth and productivity of mung bean (Vigna radiata) Pak. J. Bot.. 2017;49(3):331-336.
- [Google Scholar]
- Effect of germination on proximate composition of two maize cultivars. J. Bio. Agric. Health Care. 2015;5(3):123-128.
- [Google Scholar]
- Khan, Muhammad I., Afzal, Muhammad, J., Bashir, Safdar, Naveed, Muhammad, Anum, Sara, Cheema, Sardar, A., Wakeel, Abdul, Sanaullah, Muhammad, Ali, Muhammad, H., Chen, Zhongbing, 2021. Improving Nutrient Uptake, Growth, Yield and Protein Content in Chickpea by the Co-Addition of Phosphorus Fertilizers, Organic Manures, and Bacillus sp. MN-54. Agronomy 11(3), 436.
- Biochar effects on soil biota – a review. Soil Biol. Biochem.. 2011;43(9):1812-1836.
- [Google Scholar]
- Biochar and manure affect calcareous soil and corn silage nutrient concentrations and uptake. J. Environ. Qua.. 2012;41(4):1033-1043.
- [Google Scholar]
- Methods of inorganic pollutants analysis. In: Soil and agro-chemical analysis methods. Beijing: Agricultural Science and Technology Press; 2000. p. :205-266.
- [Google Scholar]
- Mengel, K., Kirkby, E.A., 2001. Principles of Plant Nutrition. 5th ed., Kluwer Academic Publishers, London. pp: 479–480.
- Changes in time in form and availability of residual fertilizer phosphorus in a catenary sequence. Can. J. Soil Sci.. 1975;55:149-159.
- [Google Scholar]
- Influence of biochar and Azospirillum application on the growth of maize. Madras Agric. J.. 2011;98:158-216.
- [Google Scholar]
- As alkalinity of animal and plant products. Aust. J. Experiment. Agric.. 1991;31:321-324.
- [Google Scholar]
- Principles and procedures of statistics: A biometrical approach (2nd ed.). New York: McGraw Hill Book Co.; 1997. p. :400-428.
- Nitrogen retention and plant uptake on a highly weathered central Amazonian ferralsol amended with compost and charcoal. J. Plant Nutr. Soil Sci.. 2008;171(6):893-899.
- [Google Scholar]
- Predicting phosphorus bioavailability from high-ash biochars. Plant Soil.. 2012;357(1-2):173-187.
- [Google Scholar]
- A comprehensive system of leaf analyses and its use for diagnosing crop nutrient status. Commun. Soil Sci. Plant Anal.. 1982;13(12):1035-1059.
- [Google Scholar]
- Biochar had effects on phosphorus sorption and desorption in three soils with differing acidity. Ecol. Eng.. 2014;62:54-60.
- [Google Scholar]
- Zhang, X.S., Yang, G.X., Jiang, H., Liu, W.J., Ding, H.S. 2013. Mass production of chemicals from biomass-derived oil by directly atmospheric distillation coupled with co-pyrolysis. Sci. Rep.
Appendix A
Supplementary data
Supplementary data to this article can be found online at https://doi.org/10.1016/j.jksus.2021.101635.
Appendix A
Supplementary data
The following are the Supplementary data to this article:


