

Translate this page into:
Ecological stoichiometric characteristics of soil SOC, TN, and TP under different restoration methods in QiXing river wetland
⁎Corresponding author. junhuang242424@outlook.com (Jun Huang)
-
Received: ,
Accepted: ,
This article was originally published by Elsevier and was migrated to Scientific Scholar after the change of Publisher.
Peer review under responsibility of King Saud University.
Abstract
Objectives
Different recovery methods, (1) Return farmland to wetland (RFW), (2) Return Farmland to Forest (RFF) areas are located in QiXing River Wetland National Natural Reserves. The purpose of this study was to analyze the impacts of different wetland restoration on the soil elements.
Methods
From three regions that RFW, RFF, and NW (Natural Wetland for reference) in QiXing river wetland, the soil samples were collected for soil SOC, TN, TP, NO3−-N, NH4+-N, and SAP contents determination. C:N:P ratios were calculated in the spring, summer, and autumn of 2018.
Results
In this study, soil SOC, TN contents reached Ⅰ standard of China, TP was in medium above to excellent, the soil C:N:P ratios of RFW, RFF, and NW were 138:7.8:1, 131:5.4:1, 145:7.6:1 (molar ratios, the same is as follows), in QiXing river wetland, closed to on China’s soils. And the SOC, TN, NO3−-N, and C:N:P ratios of RFW higher than of RFF, and C:N of RFF more than RFW, indicating that soil SOC were rich in QiXing river wetland, the RFF was more beneficial to available phosphorus release and by N restriction. As elements of plant growth that NH4+-N, TP shown as spring and summer were inferior to autumn, owing to demand of elements in the flourishing period more than in the mature period.
Conclusions
The C:N:P ratios of RFW higher than of RFF, indicating that soil SOC were rich in QiXing river wetland, the RFF was more beneficial to available phosphorus release and by N restriction. While RFW was more beneficial to promotes plants growth and restoration, and soil carbon and nitrogen metabolism and balance.
Keywords
Soil carbon
Nitrogen
Phosphorus
Stoichiometric characteristics
QiXing river wetland

1 Introduction
Ecological stoichiometry focuses on the mass balance of multiple nutrient elements by the study of the changes of those and their ratios (Rong et al., 2015). Carbon (C), nitrogen (N), and phosphorus (P) are the most important nutrient of soil, which ecological stoichiometric characteristics play a critical role in exploring the material cycle, multi-element balance, and nutrient limit of the ecosystem (Michaels et al., 2001). The stoichiometric characteristics of soil C, N, and Pon cycles influence by climate conditions, hydrological regimes, and biological, directly or indirectly, leading to more complexity (Xu et al., 2019). Therefore, the stoichiometric characteristics of soil C, N and P have a good sign effect, such as C:N and C:Preflect the growth of plants, N:P restricts plant growth (Luo et al., 2012; Qian et al., 2018). Wetlands that transitional region between terrestrial and aquatic ecosystems play an important role in storing carbon and nitrogen, protecting species diversity and keeping regional ecological security (Hefting et al., 2013). Hence, the restoration and protection of wetlands is still an important task and have a hot topic (Yepsen et al., 2014). The ecological stoichiometric characteristics of wetland soil not only reflect the cycling status of nutrients and affect of soil quality, but also have an important significance to reveal the productivity, stability, and restoration effect of the wetland ecosystem (Yanf, 2002). Cui et al. (2009) reported the soil SOC and TP content were higher in the cultivated poplar to wetland compared with natural restoration wetland in Lake. However, Li et al. (2016) researched the soil organic matter, available nitrogen, available phosphorus, and available potassium of natural restoration wetland were higher than that of artificial restoration method, indicated that natural restoration wetland more significant affect on soil improvement in WuYu river wetland. Zhou et al. (2020) showed the soil total phosphorus, available phosphorus, and available nitrogen of natural restoration in the middle-reaches of Heihe River were superior to restoration protection, the organic carbon and total nitrogen were the highest by built trestles and regular mowing. The Yellow River delta wetland after the artificial restoration found the soil C:N was lower than 25, the SOC and TN were higher than the unrecovered area, which proved to decompose organic matter was not restricted by N and promoted to the release of nutrients (Dong et al., 2011; Shugart and Botkin, 1981; Su et al., 2018). Therefore, it is important to choose a reasonable restoration method to promote the restoration and protection of wetlands in China.
QiXing wetland national nature reserve is a representative and typical wetland in Sanjiang plain of northeast China, located in the north of Baoqing county, Heilongjiang province. The topography of the QiXing wetland is a typical low plain and floodplain of the valley, formed the hilt-land that is suitable for reclamation and cultivation in the wetland. Since the 1950s, the QiXing wetland had been mainly used for agricultural cultivation. With the development of agriculture, the corridor connectivity of the QiXing river was damaged, by 2000, which reduced by 51%, and the landscape index and species diversity decreased (Liu et al., 2004). Until 2002, according to the wetland different terrain, flooding, and other, the QiXing river adopted two major projects of returning farmland to the wetland.1. For the areas with intermittent flooding, the natural restoration wetland without human interference was selected return farmland to wetland (RFW), 2. For the hilt-land with less flooding, the cultivated populous L with human interference was selected return farmland to the forest (RFF). Much researches in QiXing wetland mainly includes the area decrease analysis, the characteristics of climate change, the breeding behavior of Chlidonias hybridus, the diversity and abundance of invertebrates, and Ammonia-Oxidizing Archaea and other aspects (Yu et al., 2014). The objectives of this study were to examine (1) the stoichiometric characteristics of soil SOC, TN, TP, NO3−-N, NH4+-N, and SAP under different restoration methods wet land (2) the equilibrium mechanism of interaction of soil nutrient elements under different restoration methods wetland (3) the effects of soil carbon, nitrogen, and phosphorus after different restoration methods in QiXing wetland.
2 Materials and methods
2.1 Study sites
The QiXing wetland (132° 5′–132° 26′ E, 46° 40′–46° 52′ N) for this study is located in China’s a humid and sub-humid continental monsoon climate zone. The region is characterized by quickly rises temperature spring, warm and humid summer, sharply drops temperature autumn, and cold and long winter, with mean annual precipitation, which confined mainly to April to September, and annual temperatures, annual relative humidity are shown in Table S1. Gramineae are natural plants such as Calamagrostis angustifolia, Phragmites australis, and Carex, are widely distributed in QiXing wetland. In the meantime, Artemisia atrovirens and other plants are associated in high floodplain or hilt-land. The study sites were established on QiXing river wetland national nature reserve in the experimental area (Fig. S1).
2.2 Sample collection
In 2018, most soil samples were collected in spring, summer, and autumn, respectively (Table S2). Three plots were selected for each research areas, and the distance between each plot not <100 m. Three subplots were arranged in each plot, a total of 27, and the distance between each subplot not <50 m, within each subplot soil samples according to the three points method. Sample was air-dried and sieved (0.25 mm), divided into 3 equal parts and put into sealing bags for the analysis of ammonium nitrogen (NH4+-N), nitrate-nitrogen (NO3−-N) and available phosphorus (SAP) contents.
2.3 Sample analysis
The soil SOC, TN, and TP were determined via point analysis with EDAX energy spectrometer ((HITACHI)S-4800, Japan). Soil samples were subjected to scanning electron microscopy (SEM) analysis. The soil NO3−-N, and NH4+-N were determined.
2.4 Data analysis
Two-way ANOVA with SPSS 19.0 software was used to analyze the variation of soil properties. And Pearson correlation analysis was used to study the elements.
3 Results
3.1 Soil SOC, TN and TP and their variability
The different restoration methods and seasons displayed that soil SOC content (44.72 g·kg−1–54.72 g·kg−1, all data) was not significantly different (Fig. 1A), and was consistent with TN (2.61 g·kg−1–2.79 g·kg−1) in spring (Fig. 1B), and TP (0.81 g·kg−1–1.52 g·kg−1) in spring and summer (Fig. 1C). Soil TN content showed as summer higher and autumn than spring in RFW; TP content was better autumn than spring and summer in different wetlands. The average variation coefficient of soil SOC was demonstrated as spring > summer, and > autumn in different restoration methods, consistent with TN and TP, generally, whereas the TN of RFW and TP of RFF were spring > autumn, and > summer (Table 1). RFW: Return Farmland to Wetland; RFF: Return Farmland to Forest; NW: Natural Wetland.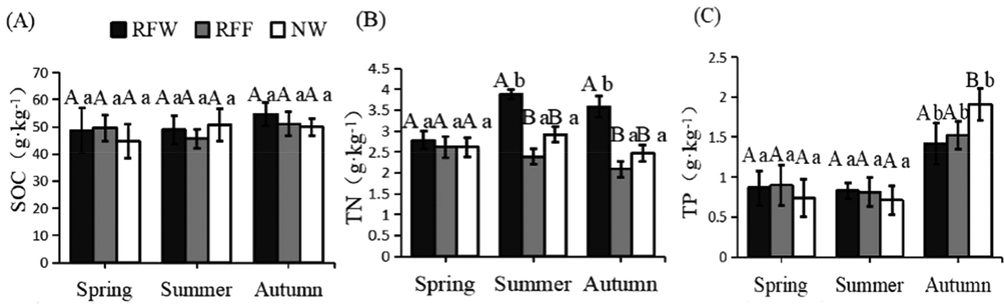
Contents of SOC, TN, and TP under different restoration methods in QiXing River wetland.
Element
Restoration method
Min (g·kg−1)
Max (g·kg−1)
C.V. (%)
Average C.V.(%)
Spring
Summer
Autumn
Spring
Summer
Autumn
Spring
Summer
Autumn
SOC
RFW
RFF
NW40.00
33.50
27.2041.20
31.10
31.2044.70
47.90
43.3056.60
62.90
60.3055.80
52.20
58.2061.10
59.80
58.808.80
13.60
18.408.10
11.80
10.107.60
6.80
8.508.17
10.73
12.33
TN
RFW
RFF
NW8.16
4.73
3.3515.80
6.056.0522.90
19.20
10.2019.60 20.20 20.30
29.80
11.90
19.1038.80
34.30
33.8025.30
37.60
49.6014.00
20.30
30.1015.60
20.20
22.6018.30
26.03
34.10
TP
RFW
RFF
NW0.45
0.32
0.270.84
0.88
0.991.20
1.40
1.201.90
2.10
1.603.07
2.20
2.102.30
2.40
2.8035.90
40.70
35.3020.40
21.50
17.1018.30
27.84
10.2224.87
30.01
20.87
Different capital letters represent significant differences between different restoration methods and different little letters represent significant differences between different seasons (P < 0.05). Value = M ± S.D. RFW: Return Farmland to Wetland; RFF: Return Farmland to Forest; NW: Natural Wetland.
3.2 The stoichiometric ratios of soil SOC, TN and TP and their variability
The soil C:N (17.38–18.93), C:P (55.39–60.47), and N:P (2.93–3.54) ratios of different wetlands were not significantly different in spring (Fig. 2). In other seasons, the C:N (12.58–24.49), C:P (36.63–71.47), and N:P (1.29–4.96) showed the difference. The soil C:P and N:P ratios were varied widely in autumns > spring and summer (Table 2).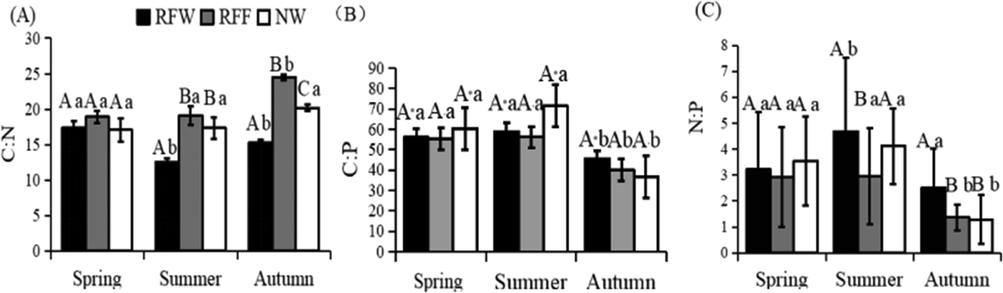
Contents of C:N, C:P, and N:P under different restoration methods in QiXing River wetland.
Stoichiometric ratio
Restoration method
Min
Max
C.V. (%)
Average C.V.(%)
Spring
Summer
Autumn
Spring
Summer
Autumn
Spring
Summer
Autumn
C:N
RFW
RFF
NW2.90
2.80
2.301.30
2.20
2.501.50
1.30
1.4035.70
28.20
32.9023.10
27.50
28.1322.60
33.20
35.505.20
4.45
9.053.14
7.08
8.502.22
1.90
2.463.52
4.47
6.67
C:P
RFW
RFF
NW61.90
77.90
43.0031.30
74.80
59.5047.10
48.80
25.00141.0
211.0
99.00158.3
159.4
147.491.00
88.30
66.506.77
5.38
9.466.71
9.10
8.358.35
11.14
14.597.27
8.54
10.80
N:P
RFW
RFF
NW0.80
1.19
1.101.30
1.80
1.091.00
0.20
0.8011.00
10.00
12.0012.00
9.10
12.7010.50
7.70
6.4059.05
84.42
45.9657.91
83.84
31.2371.19
36.59
49.8762.72
68.28
42.34
3.3 Soil NO3−-N, NH4+-N, and SAP in wetland
The different restoration methods displayed that soil NO3−-N (0.86 mg·kg−1-–1.43 mg·kg−1), NH4+-N (129.6 mg·kg−1–285.6 mg·kg−1), and SAP (0.93 mg·kg−1–1.12 mg·kg−1) contents (Fig. 3). The soil NO3−-N, SAP contents were stable, except NO3−-N of NW was autumn < spring and summer, same as NH4+-N (Table 3).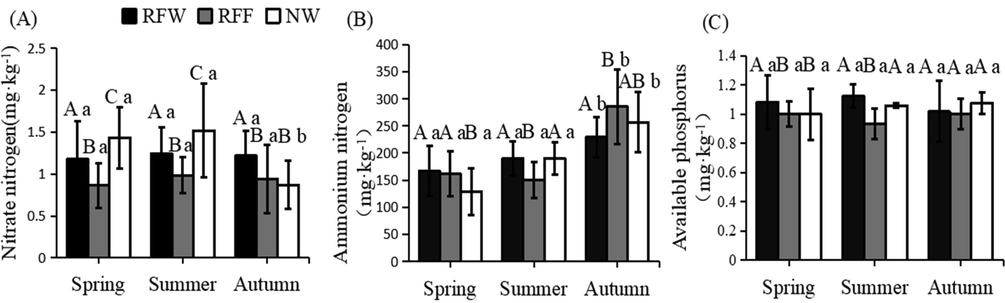
Contents of nitrate nitrogen, ammonium nitrogen, and available phosphorus contents under different restoration methods in QiXing River wetland.
Element Restoration method
Min (mg·kg−1)
Max (mg·kg−1)
C.V. (%)
Average C.V.(%)
Spring
Summer
Autumn
Spring
Summer
Autumn
Spring
Summer
Autumn
NO3−-N
RFW
0.50
0.60
0.60
2.20
2.20
2.80
38.30
25.70
24.30
29.43
RFF
0.60
0.60
0.30
1.80
1.10
2.03
30.30
21.70
42.90
31.63
NW
0.90
0.70
0.20
2.40
2.70
2.40
25.20
36.70
63.10
41.66
NH4+-N
RFW
70.00
133.0
203.0
238.0
252.0
329.0
46.70
31.80
37.70
38.73
RFF
98.00
77.00
168.0
259.0
203.0
476.0
41.90
32.70
68.20
47.60
NW
133.0
84.00
245.0
357.0
182.0
483.0
43.00
30.20
55.60
42.93
SAP
RFW
0.10
0.18
0.90
1.20
1.30
1.70
17.05
7.15
20.06
14.75
RFF
0.96
0.90
0.90
1.06
1.40
1.60
8.64
11.40
10.56
9.20
NW
0.92
0.90
0.90
1.10
1.10
2.70
17.10
6.60
7.10
10.27
3.4 The characteristics of soil SOC, TN and TP contents in different wetlands
In this study, the average soil SOC content was erage (44.72 g·kg−1–54.72 g·kg−1) of RFW, RFF, and NWreachedⅠ standard. According to the classification standard of soil SOC is superior to the 23.20 g·kg−1 for Ⅰ level in China. The standard classification of carbon, nitrogen, and phosphorus content of classification in China was described in Table S3. The soil SOC and TN were significant positive correlated (P < 0.01), which reflects this synergistic relationship (Table 4). In wetland restoration, TN and TP were positively correlated (P < 0.05), while TN and SAP was a negative linear correlation indicating that there was also a synergistic relationship between TN and TP in wetland restoration. The stoichiometric ratios correlation between RFF and NW was generally higher than that of RFW (Table 5). A linear regression was used to distinguish seasons and soil nutrient elements, and stoichiometric ratios and nutrients and SAP, and seasons. A linear regression analyses between soil nutrient elements and seasons were tested and the results were tabulated (R2 = 0.68) (Table 6). SOC: Soil organic carbon; TN: Total nitrogen, TP: Total phosphorus; NO3−-N:Nitrate nitrogen; NH4+-N: Ammonium nitrogen; SAP: Soil available phosphorus; RFW: Return Farmland to Wetland; RFF: Return Farmland to Forest; NW: Natural Wetland. * represents significant correlation at 0.05 levels, while ** represents significant correlation at 0.01 levels. The same is as follows. R2: square of the total correlation coefficients (n = 81); X: the seasons.
Restoration method
Element
SOC
TN
TP
NO3−-N
NH4+-N
SAP
RFW
SOC
1.000
0.310**
−0.267*
0.061
0.128
0.058
TN
1.000
0.148*
0.009
−0.097
−0.273*
TP
1.000
0.052
0.182
−0.163
NO3−-N
1.000
−0.07
0.127
NH4+-N
1.000
0.095
SAP
1.000
RFF
SOC
1
0.368**
−0.432**
0.039
0.321**
0.241*
TN
1.000
0.126*
−0.046
−0.121
−0.036
TP
1.000
0.006
−0.238*
−0.231*
NO3−-N
1.000
0.132
−0.04
NH4+-N
1.000
0.457**
SAP
1.000
NW
SOC
1
0.263*
−0.549**
0.195
−0.271*
0.079
TN
1.000
−0.027
0.138
0.162
−0.221*
TP
1.000
−0.179
0.317**
0.078
NO3−-N
1.000
−0.263*
−0.295**
NH4+-N
1.000
0.108
SAP
1.000
Restoration method
stoichiometry
C:N
C:P
N:P
C:NO3−-N
C:NH4+-N
C:SAP
RFW
C:N
1.000
−0.057
−0.065
0.051
−0.220*
−0.178
C:P
1.000
0.996**
0.025
0.041
−0.064
N:P
1.000
−0.003
0.008
−0.103
C:NO3−-N
1.000
0.133
0.511**
C:NH4+-N
1.000
0.382**
C:SAP
1.000
RFF
C:N
1.000
−0.045
−0.074
−0.125
−0.17
−0.098
C:P
1.000
0.953**
0.145
0.303**
0.464**
N:P
1.000
0.056
0.237*
0.327**
C:NO3−-N
1.000
0.381**
0.621**
C:NH4+-N
1.000
0.536**
C:SAP
1.000
NW
C:N
1.000
−0.179
−0.228*
−0.065
0.355**
0.072
C:P
1.000
0.992**
0.016
−0.021
0.426**
N:P
1.000
0.016
−0.051
0.402**
C:NO3−-N
1.000
−0.005
0.341**
C:NH4+-N
1.000
0.08
C:SAP
1.000
Y
Equations
RFW
R2
RFF
R2
NW
R2
SOC
y = 2.5678x + 43.283
0.6347
y = 0.7559x + 47.31
0.0702
y = 3.0782x + 44.579
0.7903
TN
y = 0.395x + 2.6312
0.4903
y = −0.2663x + 2.9002
0.994
y = −0.0737x + 2.8187
0.1029
TP
y = 0.2777x + 0.4816
0.7021
y = 0.3135x + 0.4499
0.6964
y = 0.5837x − 0.0489
0.7303
C:N
y = 0.175x + 15.877
0.0037
y = 0.035x + 19.207
0.3372
y = 0.575x + 16.947
0.7175
C:P
y = −5.31x + 64.25
0.5614
y = −7.62x + 65.847
0.7063
y = −11.92x + 80.03
0.4479
N:P
y = −0.825x + 5.21
0.3391
y = −0.465x + 2.8733
0.7902
y = −0.925x + 5.28
0.422
NO3−−N
y = 0.0218x + 1.1686
0.423
y = 0.0391x + 0.8493
0.4005
y = −0.2807x + 1.8347
0.638
NH4+-N
y = 31.13x + 132.89
0.9782
y = 62.056x + 74.95
0.6812
y = 64x + 63.926
0.999
SAP
y = −0.0332x + 1.1416
0.3884
y = −0.0101x + 0.9786
0.2623
y = 0.0378x + 0.97
0.8985
4 Discussion
The soil SOC content is an important index to measure soil quality and has important significance for soil stability and biodiversity. Our results indicated that the soil SOC nutrient was rich in the different wetlands, promoting the plant’s restoration and the growth of native plants. Generally, the SOC content of the restored wetlands (RFW, RFF) in this paper was higher than that of the natural wetland (NW), which is similar to the research results of Wang. The soil nitrogen is mainly obtained from the residues of plants and animals, biological nitrogen fixation, atmospheric deposition, and others in the wetland ecosystem (Sun et al., 2015). According to the classification, soil nitrogen content increased to 2.00 g·kg−1 for the first level in China. TN (2.08 g·kg−1–3.88 g·kg−1) was in excellent condition, and TN of restored wetlands was generally better than of NW, related with the residual nitrogen caused by the used of fertilizers before the restored wetland and the longer time of soil nitrogen metabolism. The soil TN composition and transformation can be influenced by microorganism, including bacteria, fungi and actinomycetes which were dominant in microorganisms in QiXing river wetland. This was also one of the factors that the TN content of RFW was higher than that of RFF. As available nitrogen not only reflect the nutrient supply and availability of wetland soil, but also affect the growth of vegetation and the stability of wetland system (Shugart and Botkin, 1981). In this study, the NO3−-N content of RFF was generally lower than that of RFW and NW, because of the above-ground biomass of the main vegetation of RFF was large. The change of soil NO3−-N content not only the related to plant absorption, also closely related with moisture conditions (Wang et al., 2015). In this study, the contents of soil NO3−-N and NO3−-N in different wetlands were shown similar trend, increased NH4+-N, while decreased NO3−-N with the seasons, generally. The NH4+-N was higher than NO3−-N indicated the importance of soil NH4+-N as nitrogen that can be directly used by plants for growth in QiXing river wetland. TP ranging from 0.71 g·kg−1 to 1.91 g·kg−1, was in the medium above to excellent condition. Soil TP content is related to some factors including, vegetation, precipitation (Xiao et al., 2017). The C:N ratio is negatively correlated with the mineralization rate of soil N and positively correlated with the fixed rate of N. High C:N ratio is conducive to the accumulation of soil organic matter, while low C:N ratio is conducive to the release, leading to the high soil mineralization, and increasing the soil available nitrogen.
5 Conclusions
The soil C:N ratios of RFW, RFF, and NW were 17.69 (molar ratios), 24.59, 19.07, and C:N:P ratios were 138:7.8:1, 131:5.4:1, 145:7.6:1, respectively. The mean value was 138:6.9:1, were closed to China’s scale in QiXing river different wetland, resulting to that the soils organic carbon were rich, the availability of phosphorus was released to outward, and the growth of the native plants was restored. The plant’s growth restricted by N, the RFF was highest in terms of available phosphorus release and N restriction. The SOC, TN, and NO3—N of RFW was higher than RFF, indicated that the metabolism and balance of soil SOC and TN of RFW that was beneficial to plant growth and promoted vegetation restoration. Particularly, in the flourishing period, resulting to NH4+-N, TP of spring and summer were inferior to autumn. The variation and correlation of soil SOC, TN, and TP contents and ratios and NO3−-N, NH4+-N, and SAP of NW lower to RFW and RFF indicated good stability.
Declaration of Competing Interest
The authors declare that they have no known competing financial interests or personal relationships that could have appeared to influence the work reported in this paper.
References
- Evaluating the ecological performance of wetland restoration in the Yellow River Delta, China. Ecol. Eng.. 2009;35(7):1090-1103.
- [Google Scholar]
- Change characteristics of soil carbon and nitrogen contents in the Yellow River Delta soil after artificial restoration. Shengtai Xuebao/Acta Ecol. Sinica. 2011;31(16):4778-4782.
- [Google Scholar]
- Wetlands in agricultural landscapes for nitrogen attenuation and biodiversity enhancement: Opportunities and limitations. Ecol. Eng.. 2013;56:5-13.
- [Google Scholar]
- Characteristic of soil nutrient restoration under different modes of returning farmlands to wetlands in the Riparian Wetlands of Wuyu'er River. Wetland Sci.. 2016;14:586-589.
- [Google Scholar]
- Wetland landscape structure and the spatial-temporal changes in 50 years in the Sanjiang Plain. Acta Geogr. Sinica – Chin. Ed.. 2004;59(3):400-407.
- [Google Scholar]
- Soil stoichiometry characteristics of alpine meadow at its different degradation stages. Chin. J. Ecol.. 2012;31(2):254-260.
- [Google Scholar]
- Element stoichiometry, new production and nitrogen fixation. Oceanography. 2001;144:68-77.
- [Google Scholar]
- Carbon, nitrogen and phosphorus contents and their ecological stoichiometry in litters and soils on meadow of Wugong Mountain, Jiangxi, China at different altitudes. Yingyong Shengtai Xuebao. 2018;29(5):1535-1541.
- [Google Scholar]
- Leaf carbon, nitrogen and phosphorus stoichiometry of Tamarix chinensis Lour. in the Laizhou Bay coastal wetland, China. Ecol. Eng.. 2015;76:57-65.
- [Google Scholar]
- Forest Succession: Concepts and Application. New York: Springer-Verlag; 1981. p. :267-276.
- The research about correlation between soil microbial quantity and soil physicochemical properties in QiXing River Wetland. Nat. Sci. J. Harbin Normal Univ.. 2018;32:74-80.
- [Google Scholar]
- Research on pre-reproduction behavior of whiskered tern in QiXinghe Wetland, Heilongjiang Province, China. Chin. J. Wildlife. 2015;36:202-205.
- [Google Scholar]
- Soil recovery across a chronosequence of restored wetlands in the Florida Everglades. Sci. Rep.. 2015;5(1):1-8.
- [Google Scholar]
- Impacts of vegetation restoration strategies on soil organic carbon and nitrogen dynamics in a karst area, southwest China. Ecol. Eng.. 2017;101:247-254.
- [Google Scholar]
- Stocks and stoichiometry of soil organic carbon, total nitrogen, and total phosphorus after vegetation restoration in the Loess Hilly Region, China. Forests. 2019;10(1):27.
- [Google Scholar]
- New knowledge on the progress of international wetland science research and priority field and prospect of Chinese wetland science research. Adv. Earth Sci.. 2002;17(4):508-514.
- [Google Scholar]
- Agricultural wetland restorations on the USA Atlantic Coastal Plain achieve diverse native wetland plant communities but differ from natural wetlands. Agri. Ecosys. Environ.. 2014;197:11-20.
- [Google Scholar]
- Reasons for sharp reduction of QiXinghe wetland area in Heilongjiang Province. J. Nat. Disaster.. 2014;23:234-239.
- [Google Scholar]
- A comparison of the development of wetland restoration techniques in China and other nations. Wetlands 2020:1-10.
- [Google Scholar]
Appendix A
Supplementary data
Supplementary data to this article can be found online at https://doi.org/10.1016/j.jksus.2021.101407.
Appendix A
Supplementary data
The following are the Supplementary data to this article:


