

Earthquake risk assessment for Kuwait City, Kuwait
⁎Corresponding author at: Kuwait Institute for Scientific Research (KISR), 13109 Safat, Kuwait. dewaky@yahoo.com (Abd el-aziz Khairy Abd el-aal) akabdelaal@kisr.edu.kw (Abd el-aziz Khairy Abd el-aal)
-
Received: ,
Accepted: ,
This article was originally published by Elsevier and was migrated to Scientific Scholar after the change of Publisher.
Abstract
Estimating the expected losses from a seismic disaster, whether economic or human is considered one of the most important priorities for urban development in countries, especially those with continually expanding urban areas, high-rise buildings, and skyscraper construction as is the case in Kuwait City. It is necessary to conduct an earthquake risk assessment study due to Kuwait’s geographical location which makes it close to the most important global seismic belt, the Zagros Seismic Belt, and its proximity to local seismic sources. To conduct such a study, three inputs including seismic hazard, exposure, and vulnerability modules were incorporated, considering the inputs’ uncertainty. To assess the seismic hazard module, a unified earthquake catalog was compiled, a seismotectonic model of 27 seismic sources was designed, the recurrence parameters of seismicity and the strongest predictable earthquake were calculated for each source, and the unified hazard spectrums were obtained. Earthquake scenarios were generated to create a seismic hazard module. The exposure module is performed using data from the Kuwaiti Public Authority for Civil Information including coordinates of 33,066 facilities and buildings, area, height, shape, and type of buildings, the materials used in their construction, their occupancy, and replacement cost. The vulnerability module was implemented using mean damage ratio curves by choosing the most appropriate equations that describe the condition of buildings in Kuwait, the vast majority of which are modern multi-story concrete buildings. The final results including the economic losses of the exposures were calculated using probabilistic metrics (predicted annual losses, loss exceedance curve, and probable maximum loss). The results showed that the annual average loss is $12,793,319.52 and that seismic source No.27 to the north of Kuwait has a significant value to the losses, but the frequent occurrence of losses from seismic source No.15 to the east of Kuwait, in the Zagros region, gave the most danger to Kuwait. Seismic risk results can be used to create emergency response scenarios and risk mitigation strategies.
Keywords
Probabilistic seismic risk
Seismic hazards
And probable maximum loss

Data availability
Data will be made available on request.
1 Introduction
Kuwait is one of the world’s major countries that produces and exports oil. It is bounded by the Arabian Gulf (to the north and west), Iraq (to the east), and Saudi Arabia (to the south and west) (Fig. 1). Its strategic location near the Zagros seismic belt besides its local structures influences the seismic activity of the area. Low to medium rate of seismicity is observed within Kuwait (Fig. 1) caused by small, medium, and large earthquakes that were recorded through local, regional, and teleseismic events (Abd el-aal et al. 2020; Abd el-aal et al. 2021a,b,c; Al-Mutairi et al. 2022). These earthquakes affect man-made structures and life. Therefore, ideal urban and industrial planning strategies, precise building codes, and practical and effective mechanisms for designing earthquake-resistant constructions should be implemented to mitigate earthquake risks and preserve lives so as not to destabilize the economic and social conditions in Kuwait.
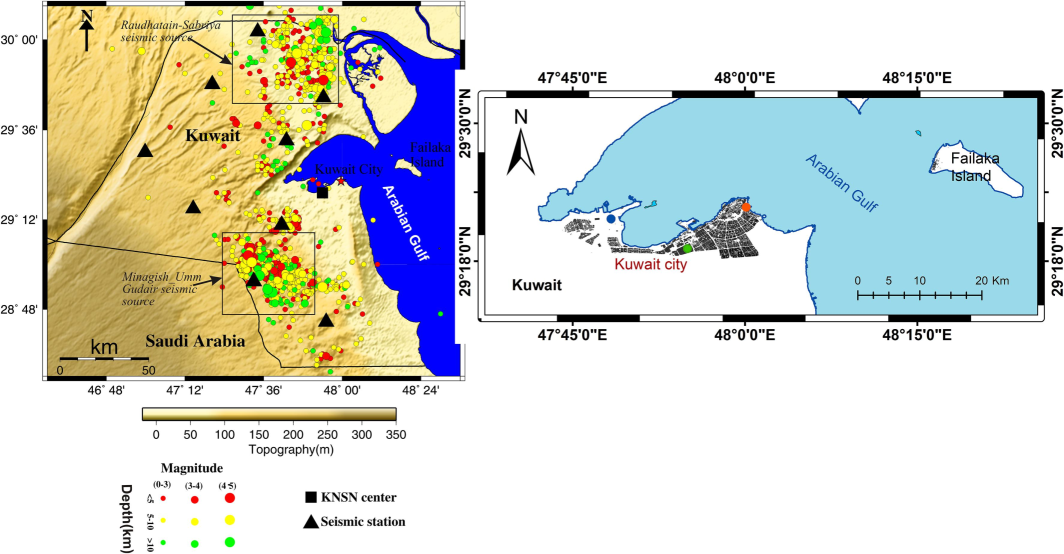
- The seismicity and the major seismic sources of Kuwait (left) and Kuwait city and the exposure elements (black polygons) for which the seismic risk were estimated. The orange (site 1), blue (site 2), and green (site 3) colored circles are the locations for which the UHS were produced (right). (For interpretation of the references to colour in this figure legend, the reader is referred to the web version of this article.)
Hazard assessment is very effective in determining the potential areas where the seismic hazards will pose high, moderate, or small risks. It is calculated using probabilistic seismic hazard assessment (PSHA) to predict the ground acceleration in Kuwait City. Risk assessment is an essential step in earthquake risk management. To manage earthquakes in an area, we must determine what this risk is and make all the necessary plans to reduce and/or transfer this risk. To reduce earthquake risks, risk assessment models are used to calculate future probabilistic losses of structures (exposed elements) in the event of an earthquake (Pollner 2001; Andersen 2002; Marulanda et al. 2010). Thus, investors, insurance companies, and governments can create effective and implementable strategies to reduce losses and develop a permanent and long-term plan for financial protection (Freeman et al. 2003) to be used in emergency response, reconstruction, restoration, and infrastructure loss recovery for protecting the economic and social situation of the area affected by catastrophic events.
In this study, seismic hazard maps and uniform hazard spectra (UHS) were created. In addition, modules were produced for seismic hazards and vulnerability, with the aim of the probabilistic assessment of seismic risks of each exposed element in Kuwait City. Also, maps of seismic risk have been created to show the economic loss in the city. Both the seismic hazard and risk maps contribute significantly to appropriate risk management decision-making and provide health, housing, transportation, and other institutions with the necessary information about disaster risks and priority measures to reduce infrastructure vulnerability and improve building codes in the study area.
2 Tectonics
Kuwait is affected by four regional tectonic movements. The convergent movement between Arabian, Turkish, and Eurasian plates along the Zagros-Belt zone, the convergent movement between Arabia and Eurasia along the zones of Makran and Owen Fracture, The divergence of the Gulf of Aden and the Red Sea floors along the axial basins, and the left-lateral movement along the NE-SW Gulf of Aqaba-Dead Sea fault. The focal mechanism of some earthquakes along the NW-SE trending Zagros belt revealed thrust faults with moderate dip angles of 40°:50° and oblique faults (Allen et al. 2004; El-Hussain et al. 2018).
The geological structures in Kuwait are diverse, including fractures, faults, anticlinal and synclinal folds, arches, troughs, and stylolites. The faults in Sabiriyah lie in a north–south direction with steep dips and small fault throws. There are also grabens on the north–south trending Kuwait Arch. There are many petroleum traps in Kuwait, such as the Carand oil traps at the Abduliyah and Bahrah fields (Carman 1996). There are also the Minagish, Sabiriyah, Burgan, Ahmadi, Bahrah, and Raudhatain oil fields, which are believed to have been created as a result of the interaction between Zagros folds and the Arabian plate (Davies 1965). The composite focal mechanism of thirty-three earthquakes in Kuwait was studied and strike-slip with normal fault component was identified (Al-enzi et al. 2007).
The geographic location of Kuwait near the highly seismically active Zagros thrust Belt, contributes to its seismicity, as it is affected by earthquakes of variable magnitudes at various depths below the earth’s surface (Gu et al. 2017). Historically, no reports of earthquakes have been recorded in Kuwait. However, instrumental earthquakes began to be recorded after 1900. Kuwait is affected by many earthquakes, such as the earthquake of November 15th, 2019 earthquake (M = 4) which is believed to have been caused by the reactivation of surface and subsurface structures (Abd el-aal et al. 2020; Abd el-aal et al. 2021a). Also, the June 2nd, 1993 earthquake (M = 4.7) struck Kuwait destroying many properties in the city. The occurrence of this earthquake was mainly due to ongoing oil extraction operations near the Minagish-Umm Gudair oil fields. Additionally, the main seismic sources in Kuwait are classified into two sources. One of them is located in the northwest and is called the Minagish-Umm Gudair source. The other lies in the southeast and is called Raudhatain-Sabriya source (Abd el aal et al. 2024). The nature of the structures affecting seismic activity in the region was determined by studying the composite focal mechanism of thirty-three earthquakes (Al-enzi et al 2007) and revealed the presence of strike-slip faults with components of normal and reverse faults.
3 Data and uncertainty
Several different types of seismic and building data were used in this study. Earthquake data for the Kuwait and Zagros Seismic Belt regions were used. The uncertainty values in the earthquake catalog were completely confirmed by relocating local earthquakes and estimating the values. Event re-location had the least errors in the epicentral distance, depth, and residual. The earthquakes were located using P-phase and S-phase readings. During the event re-location process, we considered that the largest value for uncertainty (RMS) should not exceed 0.10 s for all relocated events. The maximum expected magnitude and the recurrence parameters were also calculated. The standard division values were estimated for them, it was also taken into account that their values should not exceed 10 % (Lienert and Havskov 1995).
4 Earthquake risk model
Modeling the earthquake risk expected to happen in the future is necessary to assess the risk of loss. This model is built based on all seismological and engineering information available for the study area to predict future earthquake scenarios. Each of these scenarios represents an individual simulation of a hazardous event in an area. Also, the uncertainties that accompany the seriousness of the event, the frequency characteristics, and the subsequent losses resulting from these events must be taken into account. Therefore, the earthquake risk model was built depending on probability formulas taking into account uncertainty during quantitative risk analysis. This mathematical relationship also includes hazard, exposure, and vulnerability modules to determine the expected losses (Fig. 2) (Grossi and Kunreuther 2005; Cardona et al. 2008,2009; ERN-AL 2010; Woo 2011).
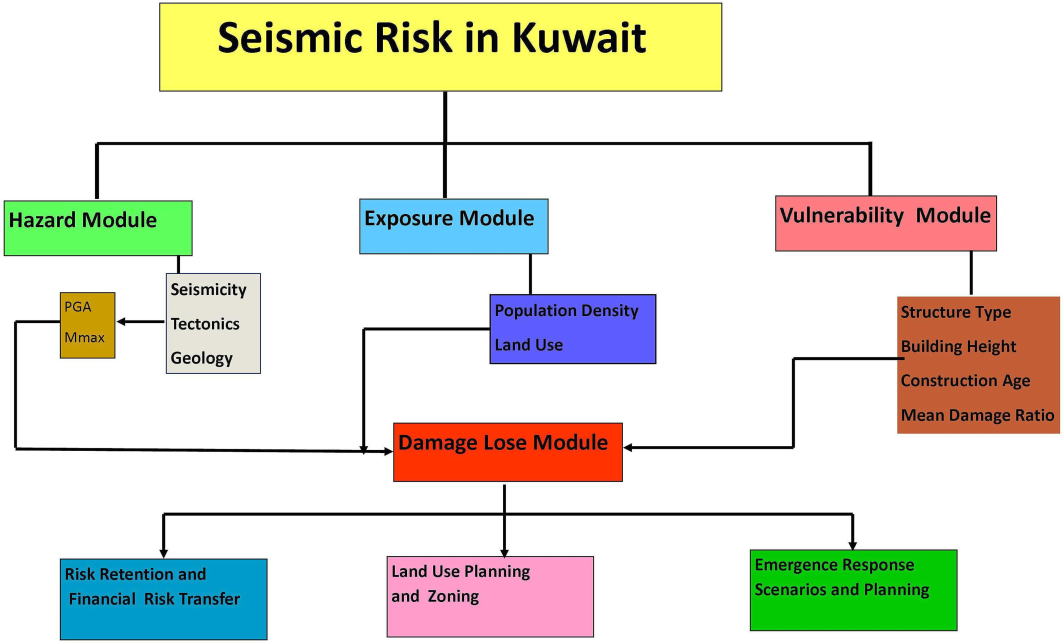
- Probabilistic seismic risk and subsequent disaster risk management applications.
4.1 Seismic hazard model
The hazard model is defined as the severity and frequency of a hazard, which may be an earthquake, volcano, landslide … etc., at a specific location. To create such a module (Cornell 1968; Esteva 1970; McGuire 1978; Bender and Perkins 1987), Seismic hazard was estimated using PSHA. A comprehensive and unified catalog of quakes has been prepared that includes all the historical and instrumental events recorded in Kuwait and its surroundings to study the local and regional effects of earthquakes on Kuwait. These quakes were compiled from many sources and linear regression relationships were used to standardize the magnitude of these events to the moment magnitude (Mw) scale. Any duplicates were eliminated and the catalog de-clustering was applied to exclude the dependent events (Abd el-aal et al 2022). Based on the geographical distribution of earthquakes, structural and tectonic settings, and focal mechanism, a seismotectonic source model was built to show the seismic sources (local and regional) affecting Kuwait. This model consists of 27 area-source-type seismic sources (Fig. 3). Each source was subdivided into 1-unit magnitude bins. In each bin, the earthquake cumulative number was graphed vs. time to estimate the magnitude of completeness (Mc) (Burkhard and Grunthal, 2009; Abd el-aal et al. 2021a,b,c&Abd el-aal et al 2022).
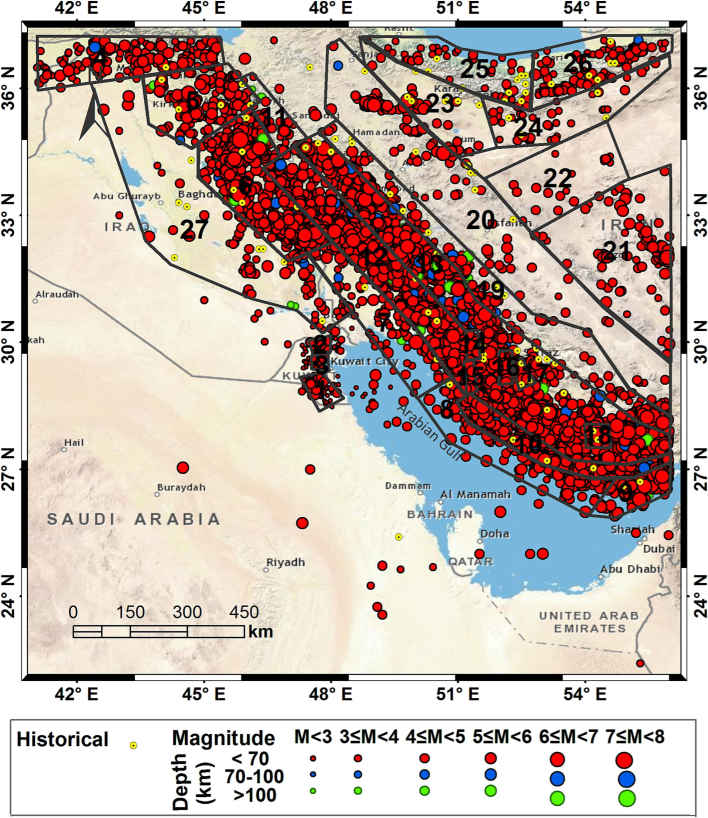
- Seismotectonic source model shows the regional and local seismic sources affecting Kuwait.
The recurrence parameters b, β, and λ were estimated to define the ratio between small and large earthquakes, tectonics, and the activity rate, respectively, for each seismic source (Table 1). The highest quake magnitude was predicted for the seismic sources using the Kijko (2004) procedure and by adding ½ unit of magnitude to the maximum observed at the seismic source. Moreover, two attenuation relations (García et al. (2005) and Abrahamson and Silva (1997)) were used to predict the ground motion on bedrock. The earthquakes at each source were modeled to follow a Poisson process.
| Seismic source | b | STD | β | STD | λ | STD | Mmax | STD |
|---|---|---|---|---|---|---|---|---|
| 1 | 0.9 | 0.08 | 2.08 | 0.19 | 2.39 | 0.401 | 5.3 | 0.77 |
| 2 | 0.91 | 0.11 | 2.09 | 0.26 | 1.637 | 0.319 | 5 | 0.91 |
| 3 | 0.99 | 0.18 | 2.29 | 0.42 | 0.901 | 0.34 | 4.7 | 0 |
| 4 | 0.7 | 0.09 | 1.6 | 0.2 | 0.941 | 0.193 | 7.1 | 0.65 |
| 5 | 0.65 | 0.08 | 1.5 | 0.19 | 0.957 | 0.169 | 6.5 | 0.34 |
| 6 | 0.76 | 0.04 | 1.75 | 0.08 | 0.707 | 0.043 | 7.5 | 0.3 |
| 7 | 0.8 | 0.11 | 1.83 | 0.25 | 0.377 | 0.07 | 6.7 | 0.64 |
| 8 | 0.72 | 0.09 | 1.65 | 0.21 | 1 | 0.201 | 6.1 | 0.31 |
| 9 | 0.57 | 0.05 | 1.32 | 0.12 | 1.18 | 0.17 | 6.9 | 0.32 |
| 10 | 0.75 | 0.05 | 1.73 | 0.1 | 1.754 | 0.185 | 6.5 | 0.27 |
| 11 | 0.94 | 0.18 | 2.16 | 0.41 | 0.388 | 0.132 | 5.3 | 0.34 |
| 12 | 0.74 | 0.03 | 1.7 | 0.07 | 0.901 | 0.047 | 6.8 | 0.26 |
| 13 | 0.69 | 0.02 | 1.59 | 0.05 | 1.395 | 0.069 | 7 | 0.26 |
| 14 | 0.7 | 0.11 | 1.62 | 0.25 | 0.723 | 0.144 | 6.1 | 0.33 |
| 15 | 0.84 | 0.11 | 1.93 | 0.25 | 1.51 | 0.324 | 6.1 | 0.4 |
| 16 | 0.89 | 0.12 | 2.05 | 0.28 | 1.183 | 0.298 | 6.1 | 0.36 |
| 17 | 0.67 | 0.12 | 1.54 | 0.27 | 0.8 | 0.161 | 6.2 | 0.27 |
| 18 | 0.52 | 0.09 | 1.19 | 0.2 | 0.242 | 0.037 | 6.5 | 0.26 |
| 19 | 0.71 | 0.06 | 1.64 | 0.14 | 0.884 | 0.113 | 6.7 | 0.31 |
| 20 | 0.67 | 0.08 | 1.53 | 0.19 | 0.417 | 0.063 | 6.7 | 0.33 |
| 21 | 0.78 | 0.09 | 1.79 | 0.22 | 1.389 | 0.382 | 7.3 | 0.91 |
| 22 | 0.87 | 0.19 | 2 | 0.45 | 0.217 | 0.088 | 4.6 | 0.31 |
| 23 | 0.39 | 0 | 0.91 | 0 | 0.025 | 0.006 | 7.6 | 0.61 |
| 24 | 0.59 | 0.13 | 1.36 | 0.29 | 1.901 | 0.645 | 7.6 | 0 |
| 25 | 0.97 | 0.19 | 2.24 | 0.44 | 1.626 | 0.607 | 4.9 | 0.3 |
| 26 | 0.81 | 0.14 | 1.87 | 0.33 | 3.803 | 0.864 | 5.2 | 0.3 |
| 27 | 0.61 | 0.1 | 1.4 | 0.22 | 0.08 | 0.013 | 7.1 | 0.47 |
| BG | 0.84 | 0.18 | 1.93 | 0.4 | 0.26 | 0.067 | 5.2 | 0.33 |
Finally, a set of stochastic seismic events should be produced to include all the probabilities of the expected magnitude and hypocenters to identify the intensity and frequency of the expected stochastic events for each seismic source. By modeling the attenuation characteristics of an event from the focus to a site and evaluating local geologic conditions, the severity of the event on a particular site can be determined. In this study, 14238 seismic hazard scenarios were generated to assess the seismic risk in Kuwait City using six magnitudes for each hypocenter. These six magnitudes are evenly spaced between the smallest and highest magnitudes of each seismic source.
4.2 Exposure model
The exposure model is an important and necessary input for seismic risk calculation. The study area was divided into several polygons, each polygon representing an exposure element. The potential economic and social losses are calculated for each exposure element in the event of an earthquake. To do these calculations, tabulated databases can be used for each exposure element. If this data is not available, mathematical methods that depend upon the availability of social info such as population density (human exposure) or economic statistics such as building statistics and their monetary value (economic exposure) can be used to create a database using available technologies and programs such as Geographic Information Systems (GIS) and remote sensing or using cadastral information (Cardona et al. 2012).
In this study, a database was created for 33,066 exposure elements (Fig. 1) exposed in Kuwait City, which includes information about the characteristics of these elements (constructions). The database includes the building’s locations, age, shapes, geometric, physical, and social characteristics, area, vegetative cover area, levels number, height, and the height of each floor as well. It also includes information on the economic activity of each building, the construction type, the materials these buildings are made of, and the building’s replacement values. It is also important to calculate the building occupancy to calculate the social impact, such as the maximum occupancy of each exposure element and its percentage over different hours during day and night, in order to create different temporal seismic scenarios for earthquake occurrence. However, if this information is not available, it is sufficient to calculate the occupancy density according to the building category (Coburn and Spence 1992) as is the case in the current study. The accuracy of these data greatly governs the accuracy and quality of the results. This study focused on calculating exposure to residential buildings and vital infrastructure including commercial, industrial, and governmental buildings such as hospitals, schools, malls, hotels, banks, schools, universities, bridges, mosques, churches, … etc., in order to preserve them to ensure a quick and effective recovery in times of disasters.
4.3 Vulnerability model
The vulnerability model is one of the models necessary to calculate the probable seismic risk. This module calculates loss (L) quantitatively and numerically in terms of damage to constructions, interruption of services, and human and social weakness. This module is characterized by the ability to provide the entire information essential to compute the likelihood of reaching /or exceeding loss values in what is known as seismic demand (S) (Cardona et al. 2012). It describes the loss's statistical moment variation (the Mean Damage Ratio (MDR) and its standard deviation) to different seismic demand values.
This model determines the destruction of each exposed element by the intensity of a particular event at a location (Miranda 1999). Developing or choosing a vulnerability equation for an exposed element depends on the structure classification. The classification of a structure depends on the building’s type, use, age, materials, and number of stories. Most buildings in Kuwait City are made of reinforced concrete materials, the construction of which has increased in recent decades. The height of the stories also varies for each exposed element in the city from single-story buildings to high-rise towers whose height exceeds 300 m. There are also buildings whose floor height is 3.5 m and others whose floor height is 6 m. An appropriate vulnerability function was determined for each exposure element in Kuwait City. The vulnerability function calculates the damage for each building using the vulnerability curve. This curve defines MDR versus the earthquake intensity in terms of peak and spectral ground accelerations.
5 Results and Discussions
5.1 Seismic hazard maps and spectra
Fig. 4 shows hazard maps demonstrating 5 % damped Spectral Acceleration (SA) for the Peak Ground Acceleration (PGA) and 0.1, and 1sec. spectral periods for return periods of 475, 975, and 2475-year. This figure shows a gradual increase in seismic activity from the eastern side to the western side of Kuwait City at the PGA and 0.1sec SA. Also, the seismic hazard at Failaka Island shows small seismic hazards. However, the seismic activity at the 1sec SA shows a gradual increase from west to east of Kuwait City. Also, the hazard at this spectral acceleration is the highest at Failaka Island. Overall, these figures show higher seismic hazards at the short period SA (0.1sec) compared to those at the long period SA (1sec). Furthermore, these maps show the highest hazard at the return period 2475-year followed by that at the 975-year return period. While it shows its lowest acceleration values at return period 475-year. These maps clearly reflect the seismicity and structures in the study area.
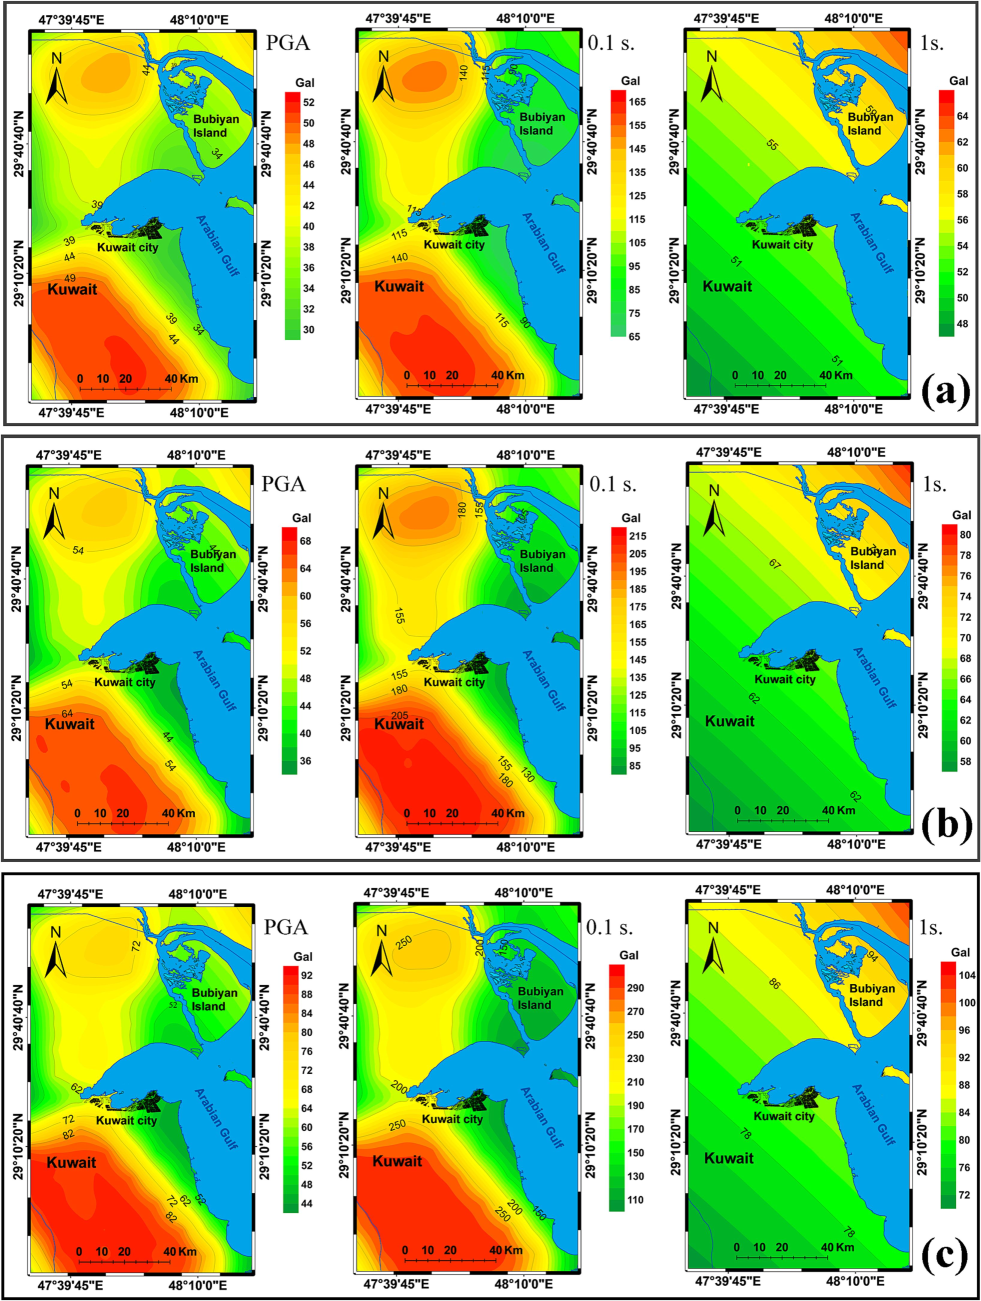
- Probabilistic seismic hazard maps for PGA, 0.1 and 1 s at 475 (a), 975 (b), and 2475 (c) years return period for Kuwait city.
Furthermore, UHS was assessed at three sites in Kuwait City to define the hazard at SA from 0 to 4secs at return periods of 475, 975, and 2475-year., equivalent to the probability of ground motion exceeding 10 %, 5 %, 2 %, respectively, over 50 yr (expected building design life). Fig. 5 shows the highest hazard values at 0.1sec SA except for site 1 where the highest hazard (81.7 Gal) is observed at 0.2sec SA for only the return period 475-year. The hazard is increasing from the eastern side (79.3 Gal) to the western side (113.04 Gal) at 0.1sec SA for the 475-year return period. At the remaining spectral periods, the hazard values are very close. In addition, the highest hazard (203.5 Gal at 0.1 sec SA) is observed at the 2 % probability of ground motion exceedance over the expected building design life. These results confirm the results obtained from the hazard maps.
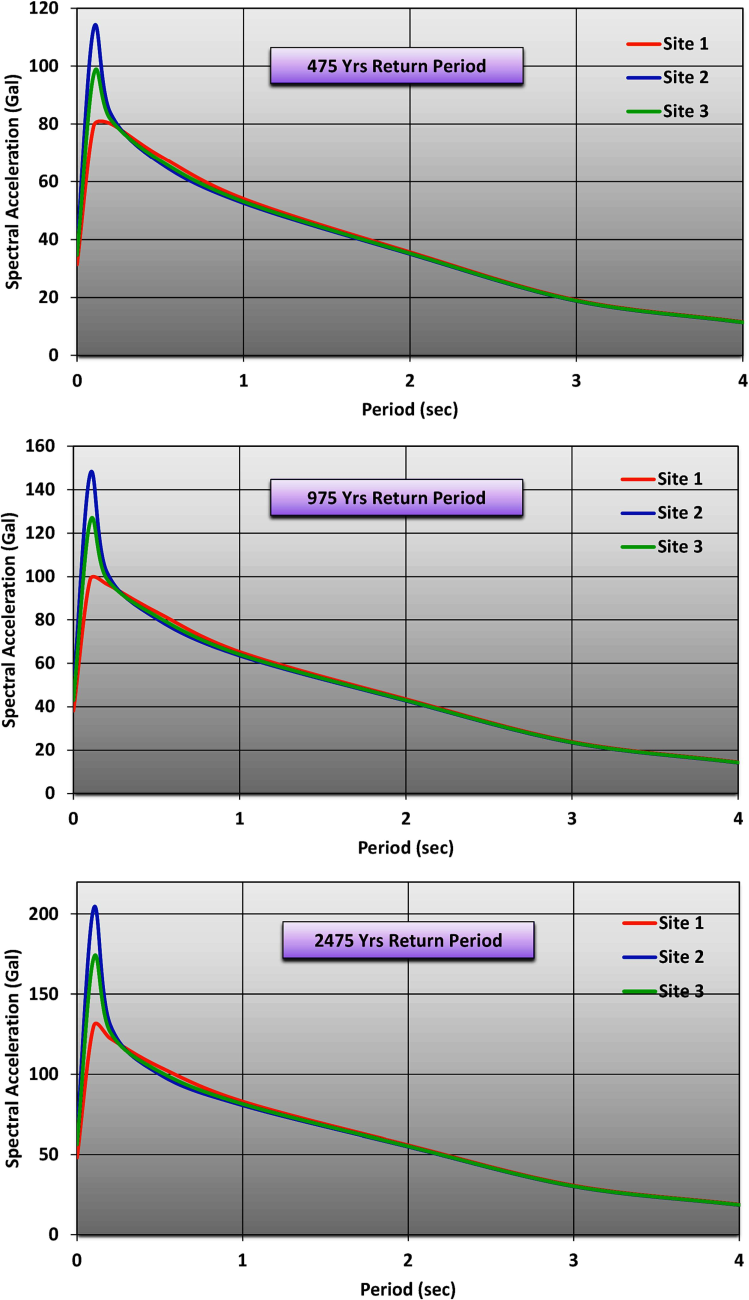
- The 5 % damped spectral acceleration UHS at 475, 975, and 2475 years return periods on bedrock for three sites in Kuwait city. The location of these sites is shown in Fig. 1 in the same colors drawn here.
5.2 Seismic risk assessment
After completing the hazard, exposure, and vulnerability modules and designing them in the required format, the seismic risk is calculated to evaluate the potential impacts and losses of future seismic risks, whether economic losses and/or loss of life or injuries. Seismic risk is measured by calculating the anticipated number of events per unit time that will cause losses L greater than or equal to the loss l, which is known as the loss exceedance rate v(l). The total probability theory is used to calculate the loss exceedance rate as follows:
The vulnerability module is included in the calculations of the previous equation, which indicates the inherent uncertainties in seismic risk calculations. Therefore, the economic loss is calculated from the product of the damage ratio and the value at risk for each exposed element (building). The losses are then gathered using Ordaz et al. (1998, 2000) and Ordaz (2000) procedures. Finally, the net total losses are estimated.
The Loss exceedance curve (LEC) is a very important measure used to assess seismic risk. This curve estimates the financial cost necessary to achieve the risk managers' objectives. LEC is defined as the yearly frequency of exceeding a definite loss. It can be calculated for the most sever seismic event in a year. However, it is preferable to calculate it for all events, cumulatively, in one year, as it calculates the probability of one or more dangerous seismic events occurring. After calculating this curve, other measures can be obtained to evaluate seismic risk, including probable maximum loss (PML) and average annual loss (AAL). AAL (expected loss per year) can be estimated for each building and building groups while the PML can be estimated for the entire study area (Ordaz and Santa-Cruz 2003).
The AAL is the sum of future losses expected during an event and the probability of its occurrence annually for all stochastic events. Assuming that the process of dangerous earthquake occurrence is stationary and that the damaged constructions will be restored immediately after the seismic event, the predicted annual loss can take into account the economic losses of each structure for all predicted events. The AAL for the entire portfolio for Kuwait City was calculated and found to be $12,793,319.52.
The PML is the amount of loss for a certain annual exceedance frequency. In the PML curve, the percentage or economic value of loss is determined in relation to return periods. For buildings, PML represents an assessment of the expected maximum losses resulting from a hazardous event. Its importance is highlighted in determining the size of the reserves that the government or insurance companies must keep to evade extreme losses that may exceed their ability to adapt. Fig. 6 shows the probable maximum loss curve for the entire buildings of Kuwait City. It shows increasing of the loss with increasing the return period with an exponential relationship. Fig. 7 shows the annual economic loss expected for Kuwait City. This figure indicates that the average economic annual loss for each property in the city is nil. Fig. 8 shows the expected absolute monetary loss for each property in Kuwait City. The median expected absolute monetary loss is $386.81. These results show a small risk situation in Kuwait city. It is attributed to the small to moderate levels of both seismicity and seismic hazards in Kuwait City. In addition, the buildings in the City are well-prepared and are mostly made of reinforced concrete materials. Therefore, their vulnerability is small to moderate, and can resist small to moderate earthquakes.
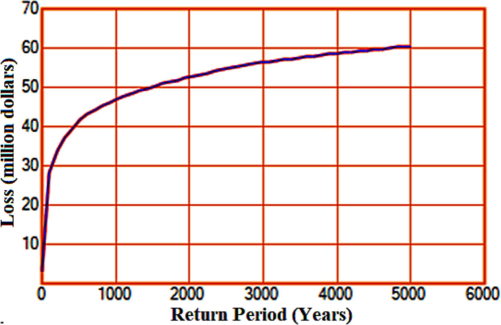
- The PML curve for the entire portfolio of buildings of for Kuwait city.
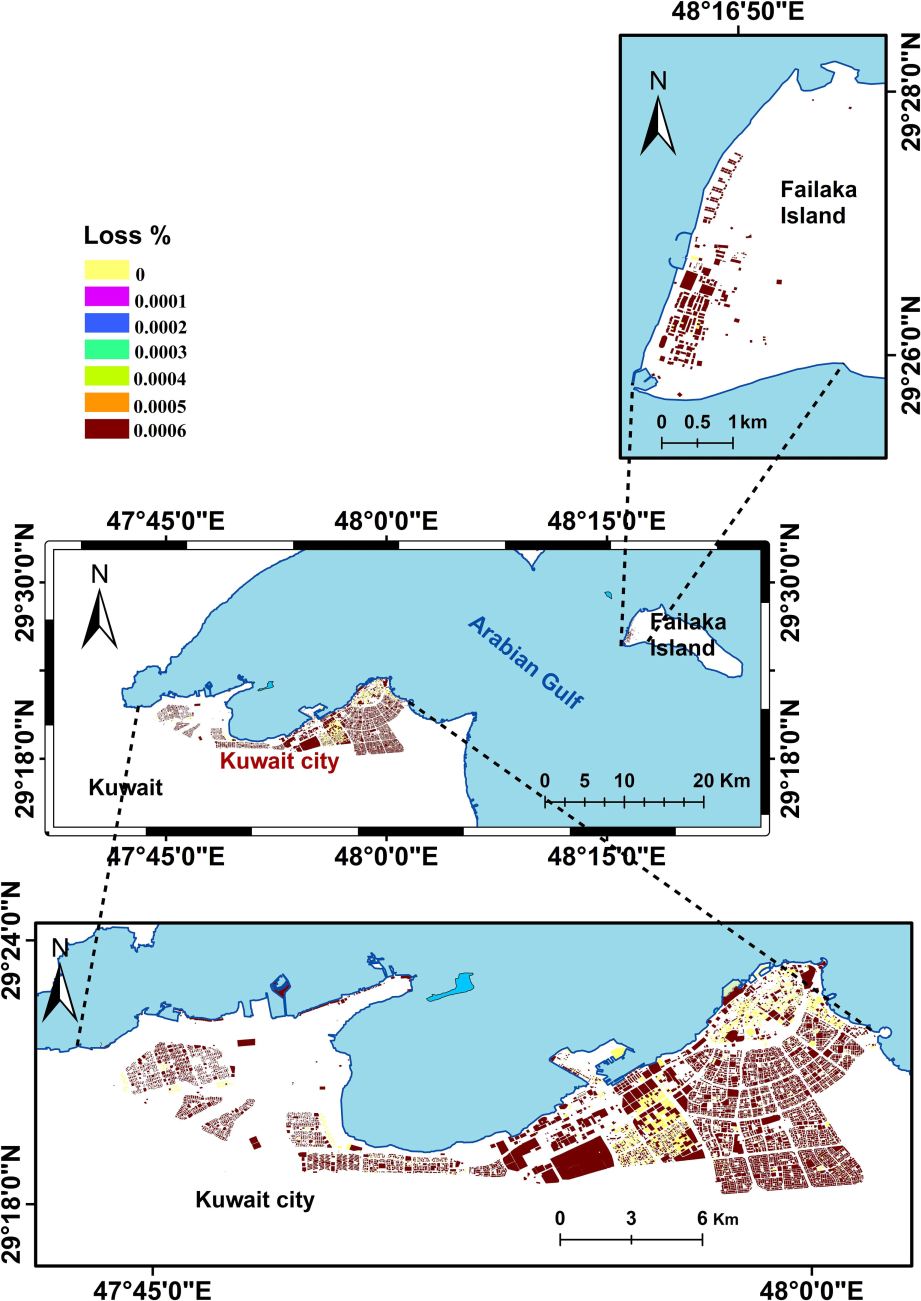
- The expected annual economic loss, represented building by building, for Kuwait city and the western coast of Failaka island.
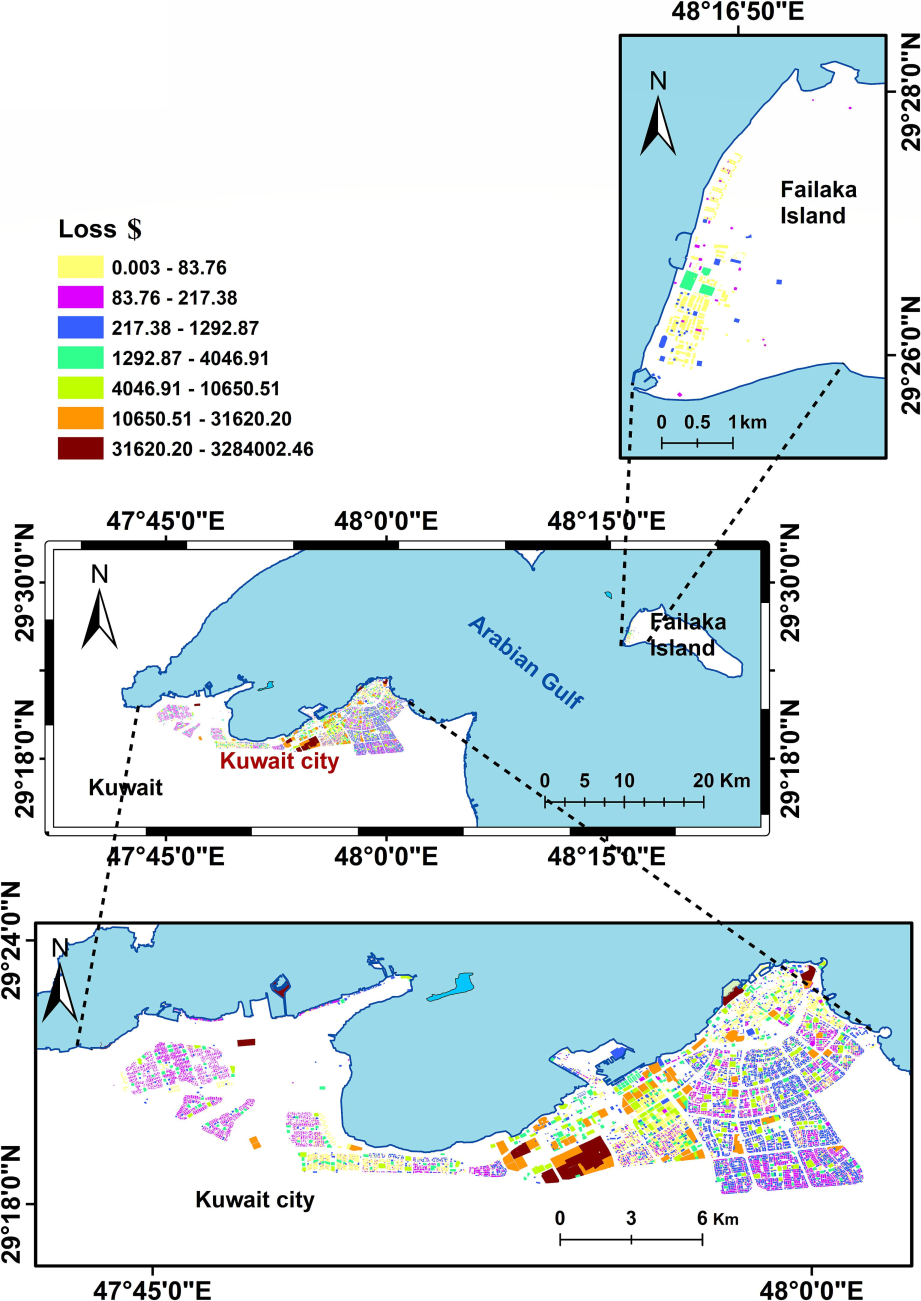
- The expected absolute monetary loss, represented building by building, for Kuwait city and the western coast of Failaka island.
Furthermore, the critical seismic risk was calculated to determine the facilities where damage may be concentrated in the event of a devastating future earthquake. Table 2 shows the five worst deterministic earthquake scenarios. This table shows that earthquake scenarios from seismic source 15 would cause the greatest damage to Kuwait City property. Also, this seismic source would produce the highest annual scenario recurrence frequency. Moreover, the uncertainty inherent in the models, specifically with regard to hazardous earthquakes, their frequency, and resulting losses, has been minimized by incorporating uncertainty into hazard and risk assessment. These results are very useful to risk managers, insurance companies, and decision-makers and should be taken into consideration when designing future urban development plans to reduce risks resulting from future earthquakes in Kuwait City.
| Earthquake scenario | Loss ($x106) | |
|---|---|---|
| Seismic source | Earthquake magnitude | |
| 15_SF1 | 5.70 | 6.33 |
| 5.43 | 3.70 | |
| 5.17 | 2.14 | |
| 4.90 | 1.21 | |
| 4.63 | 6.60 | |
6 Summary and Conclusion
The probabilistic seismic risk model was created for Kuwait City using three models. First, the seismic hazard model was established using PSAH in several stages, the first was the compilation of a homogeneous catalog of earthquakes. This model was then used with all available geological and seismological data to create a seismotectonic model. Then, the recurrence parameters and the maximum expected magnitude were calculated. Alternative attenuation relations were also used to reduce uncertainties. Finally, maps of PGA and SA of 0.1 and 1secs were produced for return periods 475, 975, and 2475-yea. UHS was created for several spectral periods for later use for engineering purposes. A set of 14,238 earthquake scenarios were generated using 6 different magnitudes for each hypocenter for each seismic source. Second, an exposure model was created for 33,066 buildings/exposed elements and the expected losses of these elements were calculated. Third, the vulnerability model was designed in which the MDR versus ground acceleration was calculated for each building.
Finally, these three models were combined and the seismic risk of the exposure elements was calculated in terms of numerical metrics such as LEC, PML, and AAL. Risk maps were created to reveal the relative and absolute economic loss in Kuwait City. The absolute risk map shows that the majority of buildings suffer small to moderate losses which are attributed to small to moderate levels of seismic hazards and well-prepared constructions. However, some buildings will suffer significant losses due to the type of soil and therefore need some retreatment and restoration of the buildings.
The outcomes of this study are very important because it provide a catastrophic risk model which increases the awareness of the public and private sectors about the expected losses from future earthquakes so that they can identify the emergency liabilities needed for rapid economic and social recovery when a catastrophic event occurs. Moreover, the results are very useful for decision-makers to develop emergency response plans and facilitate risk transfer strategies for financial protection. Also, it can be used in land use planning, holistic evaluation of risk, structural retrofitting benefit, and cost-strengthening studies.
7 Authors' contributions
The authors, Abd el-aal and Mostafa analyzed the data, wrote the research, and drew figures. Co-author Al-Jeri processed the data. Co-author Al-Enezi improved the research and performed the final revision.
CRediT authorship contribution statement
Abd el-aziz Khairy Abd el-aal: Writing – review & editing, Writing – original draft, Visualization, Validation, Supervision, Resources, Methodology, Investigation, Formal analysis, Data curation. Farah Al-Jeri: Resources, Formal analysis, Data curation. Abdullah Al-Enezi: Writing – review & editing, Supervision, Funding acquisition. Shaimaa Ismail Mostafa: Writing – review & editing, Writing – original draft, Visualization, Formal analysis.
Acknowledgment
Deep thanks to the Kuwait Institute for Scientific Research, Kuwait and the KNSN for providing seismic data. Data for buildings in Kuwait City were obtained from the Kuwaiti Public Authority for Civil Information. The manuscript is a part of project no EC143K, under the title “Seismic risk maps of Kuwait” funded by the Kuwait Institute for Scientific Research.
Declaration of competing interest
The authors declare that they have no known competing financial interests or personal relationships that could have appeared to influence the work reported in this paper.
References
- Seismological aspects of the 15 November 2019 earthquakes sequence. Kuwait. Arab. J. Geosci.. 2020;13:941.
- [CrossRef] [Google Scholar]
- Tectonic and anthropogenic characteristics of the 15 November 2019 micro earthquakes sequence. Kuwait. Geotectonics.. 2021;55:137-152.
- [CrossRef] [Google Scholar]
- Modeling and simulating ground motion from potential seismic sources to Kuwait: Local and regional scenarios. Geotectonics.. 2021;55
- [CrossRef] [Google Scholar]
- Earthquake deterministic hazard and sensitivity analysis for residential Cities in Kuwait. J. Volcanol. Seismol.. 2021;15(6):445-462.
- [CrossRef] [Google Scholar]
- Seismic hazard maps and spectra deduced for sustainable urban developments in Kuwait. Arab. J. Geosci.. 2022;15:1764.
- [CrossRef] [Google Scholar]
- Local seismicity type of Kuwait revealing tectonic and anthropogenic characteristics. J. Seismol.. 2024;28:635-655.
- [CrossRef] [Google Scholar]
- Empirical response spectral attenuation relations for shallow crustal earthquakes. Seismol. Res. Lett.. 1997;68(1):94-127.
- [Google Scholar]
- Al-enzi A, Sadeq A, Abdel-Fattah R (2007) Assessment of the Seismic Hazard for the state of Kuwait. Int rep EC011C, submitted to KFAS, Kuwait 2007.
- Late Cenozoic reorganization of the Arabia-Eurasia collision and the comparison of shortterm and long-term deformation rates. Tectonics.. 2004;23(2):TC2008.
- [CrossRef] [Google Scholar]
- Earthquake hazard assessment studies in the state of Kuwait. Geomate. J.. 2022;22(90):85-101.
- [CrossRef] [Google Scholar]
- Inter-American Development Bank: Technical paper; 2002.
- Bender BK, Perkins DM (1987) SEISRISK III: a computer program for seismic hazard estimation. USGS Open File Report. 82–293. https:// doi. org/ 10. 3133/ b1772.
- Cardona OD, Ordaz MG, Reinoso E, Yamín LE, Barbat AH (2012) CAPRA - Comprehensive Approach to Probabilistic Risk Assessment: International Initiative for Risk Management Effectiveness. WCEE LISBOA.
- Earthquake loss assessment for integrated disaster risk management. J. Earthq. Eng.. 2008;12(sup2):48-59.
- [Google Scholar]
- Coburn A, Spence R (1992) Earthquake protection. Wiley, Sussex ERN-AL (2010) CAPRA, Comprehensive Approach for Probabilistic Risk Assessment. http://www.ecapra.org/. Accessed 2 May 2012.
- Davies CCS (1965) The Post-Jurrassic Tectonic History of Kuwait and Vicinity, Kuwait Oil Company, KR-11 (unpublished). 34 pp.
- Developing a seismic source model for the Arabian Plate. Arab. J. Geosci.. 2018;11:435.
- [CrossRef] [Google Scholar]
- ERN-AL (2010) CAPRA, Comprehensive Approach for Probabilistic Risk Assessment. http://www.ecapra.org/. Accessed 2 May 2012 Esteva L (1970) Regionalización sı́smica de México para fines de ingenierı́a. Instituto de Ingenierı́a, Universidad Nacional Autónoma de México.
- Esteva L (1970) Regionalizaciόn sísmica de México para fines de ingenierı́a. Instituto de Ingeniería. Universidad Nacional Autόnoma de México. 229-246.
- Freeman PK, Keen M, Mani M (2003) Dealing with increased risk of natural disasters: challenges and options. 8, 2003–2197. International Monetary Fund, Fiscal Affairs Department.
- Inslab earthquakes of Central Mexico: Peak ground-motion parameters and response spectra. Bull. Seismol. Soc. Am.. 2005;95(6):2272-2282.
- [Google Scholar]
- Catastrophe modeling: a new approach to managing risk. In: Catastrophe modeling. Boston: Springer; 2005.
- [Google Scholar]
- Source mechanism study of local earthquakes in Kuwait. Seismol. Res. Lett.. 2017;88(6):1465-1471.
- [Google Scholar]
- Estimation of the maximum earthquake magnitude, mmax. Pure Appl. Geophys.. 2004;161(8):1655-1681.
- [Google Scholar]
- A computer program for locating earthquakes both locally and globally. Seismol. Res. Lett.. 1995;66:26-36.
- [Google Scholar]
- Revealing the socioeconomic impact of small disasters in Colombia using the DesInventar database. Disasters. 2010;34(2):552-570.
- [Google Scholar]
- McGuire RK (1978) FRISK: computer program for seismic risk analysis using faults as earthquake sources. USGS Open-File Report:78–1007. https://doi. org/ 10. 3133/ofr78 1007.
- Approximate seismic lateral deformation demands in multistory buildings. J. Struct. Eng.. 1999;125(4):417-425.
- [Google Scholar]
- Ordaz MG, Santa-Cruz S (2003) Computation of physical damage to property due to natural hazard events. IDB/IDEA Program of Indicators for Risk Management. National University of Colombia, Manizales.
- Ordaz MG, Miranda E, Reinoso E, Pérez-Rocha LE (1998) Seismic Loss Estimation Model for México City. Universidad Nacional Autónoma de México, México.
- Pollner JD (2001) Managing catastrophic disaster risks using alternative risk financing and pooled insurance structures. Technical paper; no.WTP 495 World Bank.
- Woo G (2011) Calculating catastrophe. Imperial College Press, London Distributed by World scientific Publishing Co.
Appendix A
Supplementary material
Supplementary data to this article can be found online at https://doi.org/10.1016/j.jksus.2024.103514.
Appendix A
Supplementary material
The following are the Supplementary data to this article:


