

Earthquake recurrence characteristics for potential seismic zones in the southern Red Sea region and their hazard implications on Jizan city
⁎Corresponding author. aabdelfattah@ksu.edu.sa (Ali K. Abdelfattah) ali_kamel100@yahoo.co.uk (Ali K. Abdelfattah)
-
Received: ,
Accepted: ,
This article was originally published by Elsevier and was migrated to Scientific Scholar after the change of Publisher.
Peer review under responsibility of King Saud University.
Abstract
This study aims to quantify seismic hazard assessments in the Jazan region. For this purpose, we determined earthquake recurrence parameters for potential seismic zones that may export risk to the region. A total number of ten seismic zones were identified based on the morphotectonic nature, seismic energy pattern, and previous studies. Estimates of the b-value varied from 0.74 to 1.42, reflecting different processes of tectonic activities. The maximum possible magnitudes (Mmax) of 5.9 ± 0.3 to 8.3 ± 1.1 are anticipated to be occurred in the region between 48 and 2090 years with annual probabilities of 13%, 23%, and 36% in 25, 50, and 100 years of life, respectively. Finally, the maximum expected magnitudes obtained from this study were used in cooperation with five alternative attenuation relationships to predict peak ground accelerations. The seismic hazard map of 84% was produced at hard rock using logic tree uncertainties, showing a high seismic hazard alongside the coastline shores while a low seismic hazard extended inside the Arabian Shield that is assumed to have a stable continental crust. The response spectra at hard rock in Jizan city showed maximum PGA values corresponding to spectral frequencies of 2–5 Hz, implying that high-frequency vibrations may have an impact on building structures.
Keywords
Recurrence parameters
Ground motion
Seismic hazard

1 Introduction
The Jazan area is at a complex triple junction of active spreading ridges that runs along the Red Sea, Gulf of Aden, and Afar depression. The relative movement between the Arabian, Nubian, and African plates, is ascribed to the dilatational tectonic process accommodated along the Red Sea, Gulf of Aden, and Afar depression (Fig. 1). Ongoing extension stress regime created three active ridges that represented the southwestern margins of the Arabian Shield. In the southern Red Sea, the spreading rate is about 6–7.5 mm/yr, while in the eastern Gulf of Aden, it is around 10 mm/yr (Viltres et al., 2020). The spreading rate is about
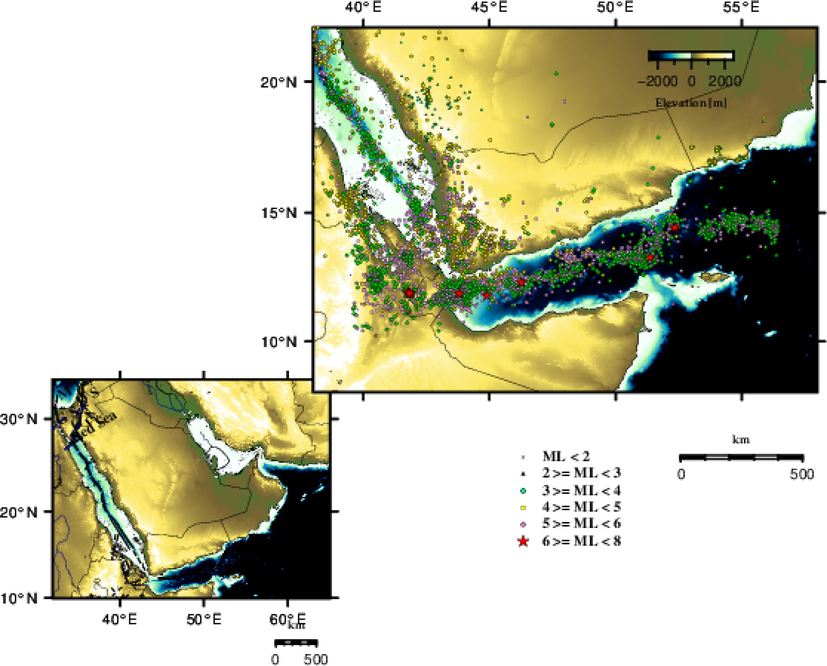
- The distribution of epicentrs in the study area in the period of 1964 to 2020.
The seismic activity in the Red Sea is ascribed to the tectonic processes activated due to the drift of the Arabian plate away from the African plate. Seismic activity is most prominent along the spreading ridges. However, a low level of earthquakes of small-to-moderate magnitudes occurs inside the Arabia plate, approximately 200–300 km from the Red Sea axis, which extends into the Asir area in the southern part of Saudi Arabia where Jazan is located (Ambraseys and Melville, 1983). The seismicity is relatively high and spatially clustered at this triple junction. Moreover, the seismicity is likely distributed consistency with the axial deep troughs (Fig. 1). Over the Arabian shield, the region has historically experienced three earthquakes associated with volcanic eruptions (641, 1256 and possibly in 1800 AD). The seismic activity in the Arabian plate likely occurs as seismic clusters in space and time, as shown in Fig. 1. The province of Jazan locates near to the destructive earthquake that occurred on 13 December 1982, north Yemen, with a body wave magnitude of 6.0 that caused approximately 1700–2800 deaths. Furthermore, tens of thousands of homeless people were concentrated 70 km south of the Sana metropolis in a highly-populated area. The province was recently struck by an earthquake sequence that began in 2014 and had a mainshock of 4.5 measured moment magnitude (Abdelfattah et al., 2017). Furthermore, the province has a high rate of small-sized earthquakes that occur annually. The mainshock of the 2014 earthquake sequence was widely felt by residence in the province, alarming much concern to the population, government, and seismological researchers. Consequently, research focusing on seismic hazard assessment in the region becomes essential.
Seismic hazard assessment for a specific region depends on earthquake recurrence parameters and attenuation models which are used to predict seismic ground motions from future earthquakes. In this study, earthquake recurrence characteristics were investigated, which are the maximum probable earthquake magnitude (Mmax), the annual activity rate (λ), and the Gutenberg-Richter b-value for a total number of ten seismogenic zones that may provide a seismic hazard to the metropolis of Jizan. The seismic hazard analysis was deterministically considered as a measure of the mean of peak ground accelerations using the computed earthquake recurrence parameters in all potential seismic zones. Furthermore, the response spectrum was approximated in the city of Jizan using alternative spectrum models with equal weights. To this end, the epistemic approach was used to assess uncertainties in the estimated response spectrum.
2 Data
The compilation of a homogeneous earthquake catalogue is one of the vital inputs required to quantify seismic hazard. We used the earthquake catalogue of Basem (2021) that was compiled using the data published by the International Seismological Center (ISC), The geological survey in the United States, the geological survey of Saudi Arabia, the Earthquake monitoring Center in Oman, and the Seismological Observatory Centre in Yemen. Moreover, for the seismic activity in the province in Jazan, we used the event list data from International Seismological Center (ISC), and Saudi Seismological Network (SSN). Fig. 1 shows the distribution of epicenters, as a function in earthquake magnitude. Fig. 2 shows the distribution of focal mechanism solutions of earthquakes in the study area. Based on the morphotectonic nature, seismicity pattern, and previous studies (Hofstetter and Beyth 2003; Sokolov et al., 2017; Rehman et al., 2017; Ayele 2017; El-Hussain et al., 2018), we divided the area into ten seismogenic zones (Fig. 3).
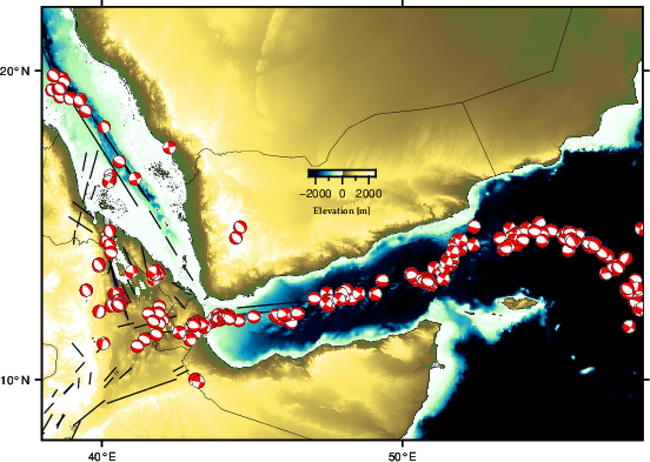
- The focal mechanism solution for earthquakes of magnitude greater than 4.0 that occurred in the study in the period 1964–2020.
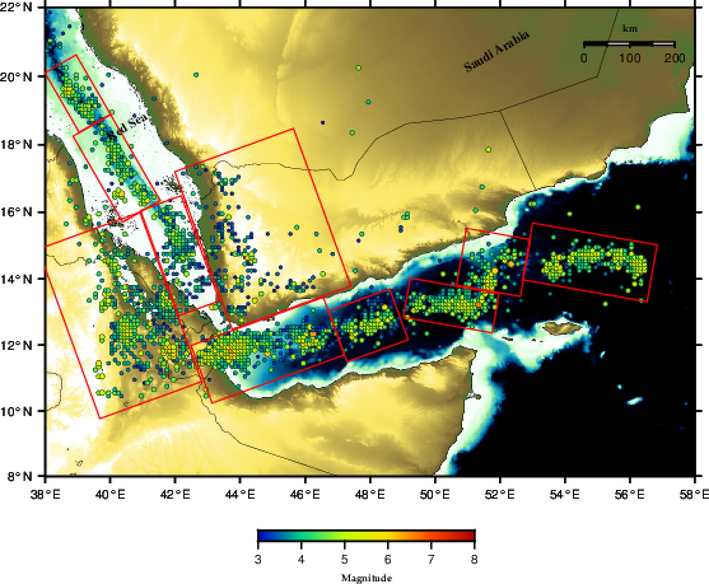
- A total number of ten active seismogenic zones delineated in the current study.
3 Tectonics and geological settings
The Jazan province is located in the southwestern portion of the Arabia shield, which is abundant in Basaltic volcanic layers. Some basaltic volcanic sheets are outcrops, namely Harrats, while others are buried behind a thick succession of late Oligocene to Holocene volcanic rocks deposited over early Tertiary and Mesozoic sedimentary rocks, which in turn overlie the Arabian Shield's Precambrian metamorphic bedrock (Grolier and Overstreet, 1978). These Basaltic volcanic layers are part of a discontinuous strip of lava fields that run beneath the Arabian lithosphere along the southwestern and northern margins from the Gulf of Aden to the north beyond the Sinai Peninsula (Coleman and McGuire, 1987).
Most of the Tertiary igneous rocks in the region were emplaced during a break up of continents that associated with the rifting development in the Red Sea and the Gulf of Aden. In the late Oligocene or early Miocene and supposed to be continued throughout the Miocene, this process is presumably preceded by slow plastic extension and thinning of the lithosphere along the Red Sea and the Gulf of Aden (Coleman and McGuire, 1987). Geophysical studies reveal that thinned continental crust is extended onshore to the Arabian Shield. In the western part of Saudi Arabia, refraction studies of Mooney et al. (1985) and Gettings et al. (1986) indicated that the thickness of continental crust beneath the Arabian Shield is about 40 km and composed of an upper layer of 20 km thick with an average velocity of 6.3 km/s. The thickness of the middle layer is about 10 km with an average velocity of 6.7 km/s. In the lower layer, the velocity ranges from 6.8 to 7.8 km/s. The crust abruptly thinned to approximately 18 km beneath the coastal plain west to the Arabian Shield and continued to about 50 km offshore in the Red Sea. The region has experienced intensive tectonic processes during the past decade with multiple volcanic eruptions, dike intrusions and earthquake swarms (Wright et al., 2012).
Fig. 2 shows the distribution of focal mechanism solutions of earthquakes in the study area, indicating that earthquakes occur along with normal and strike-slip faulting styles. According to Abdelfattah et al. (2017), the focal mechanism solutions of the 2014 earthquake sequence revealed strike-slip faulting with left-lateral slip. Abdelfattah et al. (2020, 2021a) recently published a series of articles that use a notion of shear stress transmission to trigger the conjugated faults inside the Arabian Shield due to the extensional stress regime associated with active rifting in the Red Sea that acts normal to the axial ridge. Seismic waves radiated from shallow earthquakes activated by strike-slip faults may cause a large seismic hazard impact than those from reverse or normal faulting mechanisms.
4 Determination of earthquake recurrence parameters
Owing to the complex geodynamic process in the region, the seismic activity that occurs in the Red Sea and inside the Arabian Shield emphasized the importance of identifying earthquake source zones that may export seismic hazards to the infrastructure in Jizan city. The spatial distribution of specific seismic sources, source size and type characteristics are of great necessity to accomplish seismic hazard analysis. However, there is no standard procedure that may be followed to determine earthquake source zones, since the process is inherently a matter of expert judgment. Earthquake source zones can be delineated by incorporating seismicity characteristics, focal mechanisms, active faults, major structures, and updated land-sat images. The zone described by a specific magnitude-frequency relationship, seismicity characteristics and similar focal mechanisms is defined as a unique seismic source of earthquakes. A total of ten active zones have been identified as possible major sources of earthquakes that may likely be major contributors to probable seismic hazards in the region (Fig. 3).
The maximum probable earthquake (Mmax) might have a potential impact on seismic hazard calculations. Different approaches are used to compute the maximum predicted magnitude, depending on the completeness of the seismological database employed and the characteristics of each identified earthquake source zone. Several empirical relationships can be used to identify maximum magnitude. The selection of which empirical relation can be used depends on the available information. No widely accepted method exists for estimating the maximum possible magnitude that can occur in each seismic source. The maximum probable magnitude is the most challenging characteristic to be calculated since many seismogenic zones have limited physical meaning and statistical analysis. Several techniques used in past to determine Mmax were based on the type of constraints. In this study, we used the method of Kijko (2004) to determine Mmax.
5 Ground-motion attenuation models
To improve the deterministic assessments of seismic hazards, the frequency-dependent attenuation of seismic waves is important to simulate ground motions released by large-sized earthquakes which in turn are used to depict the spatial variation of PGAs for earthquake hazard mitigation planning. The frequency-dependent characteristics of seismic waves attenuation help in calibrating the effect of physical properties of the medium along the travelling paths of the elastic seismic energies released from earthquakes. Strong-ground motions corresponding to maximum probable magnitude values at a desired site are computed using an empirical attenuation relationship dependent in magnitude and distance of distinct ranges. The maximum earthquake is usually expected to occur at the source closest to the respective site. Uncertainties in ground motions are commonly anticipated by the attenuation models used (e.g., Abrahamson, 2000; Bommer et al., 2005). As a consequence, errors in ground motion prediction models may be significant and should be accounted for the variability of ground motion. It is noteworthy that the choice of a reliable regional GMM is not only crucial but also causes significant uncertainty in quantifying seismic hazards. To account for this uncertainty five attenuation models were used, which are Fukushima and Tanaka (1990), Sadigh et al. (1997), Ambraseys et al. (2005), Kiuchi et al. (2019), and Abdelfattah et al. (2021b), giving an impetus to evaluate uncertainties using the epistemic logic tree.
Owing to the scarcity of response spectrum models in the region, the only plausible way to compute the response spectrum in Jizan is to utilize alternative response spectra produced for other places with comparable geological characteristics. To calculate the response spectrum, we selected three attenuation models that applied in regions with similar seismotectonic characteristics, which are Ambraseys et al. (1996), Abrahamson and Silva (1997), and Boore et al. (1997). The mean was calculated to account for uncertainties in calculations. The relationships used to predict the response spectrum at the impact site are tabulated in Table 1.
| ID | Zone | λ | β | b | Mmin |
|
|
|---|---|---|---|---|---|---|---|
| 1 | zone01 | 2.07±0.6 | 2.08±0.2 | 0.90±0.11 | 2.6 | 5.0 | 5.9±0.9 |
| 2 | zone02 | 3.02±0.8 | 3.27±0.3 | 1.42±0.12 | 4.4 | 5.9 | 6.1±0.3 |
| 3 | zone03 | 5.94±1.5 | 2.22±0.2 | 0.96±0.07 | 3.5 | 5.7 | 5.9±0.3 |
| 4 | zone04 | 8.16±2.9 | 2.32±0.1 | 1.01±0.06 | 4.2 | 6.2 | 6.3±0.3 |
| 5 | zone05 | 33.11±8.3 | 2.03±0.07 | 0.88±0.03 | 2.5 | 6 | 6.7±0.7 |
| 6 | zone06 | 30.66±7.7 | 1.69±0.04 | 0.74±0.02 | 3.5 | 7.3 | 7.5±0.3 |
| 7 | zone07 | 1.48±0.4 | 2.97±0.27 | 1.29±0.12 | 4.9 | 6.5 | 6.9±0.5 |
| 8 | zone08 | 2.43±0.6 | 2.11±0.14 | 0.92±0.06 | 4.4 | 7.2 | 8.3±1.1 |
| 9 | zone09 | 0.93±0.3 | 1.90±0.22 | 0.83±0.1 | 4.8 | 6.9 | 7.2±0.4 |
| 10 | zone10 | 1.35±0.4 | 2.01±0.29 | 0.88±0.13 | 4.9 | 5.9 | 5.9±0.3 |
6 Results and discussions
Prior parameters must be described in order to quantify seismic hazard assessment, which include (1) identifying earthquake source zones that may impact possible seismic hazard at the site underinvestigated, (2) estimating recurrence characteristics of earthquakes such as the b-value, the activity rate (λ), and the maximum probable earthquake (Mmax) for each zone, and (3) the relationship that can represent the characteristics of ground motion attenuation along the study region.
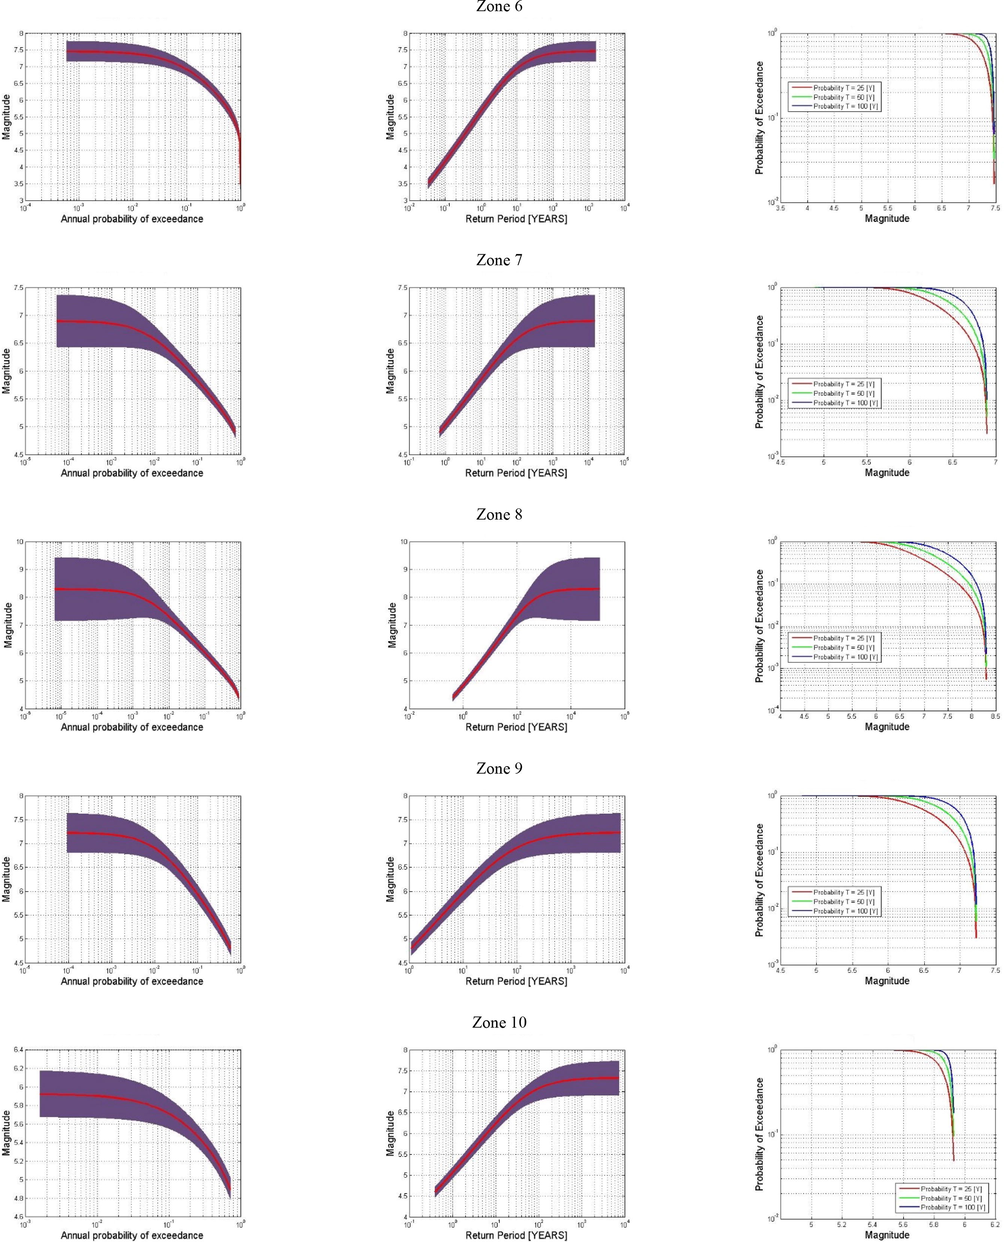
In this study, we used the earthquake catalogue compiled by Basem (2021) for the respective region. Furthermore, we have compiled a comprehensive catalogue of earthquakes that took place interior the continental shield and have been no longer included in the consideration of Basem (2021). For this purpose, we have accrued data from nearby seismological networks as well as from the International Seismological Center (ISC). We have identified a total number of ten seismogenic zones based on morphotectonic feature, seismicity pattern, seismic characteristics, and previous studies (e.g., Hofstetter and Beyth, 2003; Al-Malki and Al-Amri, 2013; Sokolov et al., 2017; Rehman et al., 2017; Ayele, 2017; El-Hussain et al., 2018). Thus, estimates of b-value, activity rate (λ) and maximum earthquake potential (Mmax) were calculated for each identified active source zone that might have a potential impact on the particular site. Table 2 presents the estimated earthquake recurrence parameters for each seismic source zones. The analysis showed that b-values vary from 0.5 ± 0.01 to 1.4 ± 0.1, with the smallest value relative to the Red Sea's southern extremity and the highest value corresponding to the westernmost part of the Gulf of Aden. This result reflects the potential of categorizing the southern end of the Red Sea as a zone with high deformation in the Earth's crust and exceedingly heterogeneous crustal structure. The b-value may be used as an indicator that describes the stress concentration, crack density, and inhomogeneity in the crustal structure. The b-value decreases with crustal deformation increases. The areas of high crustal deformation are characterized by small b-values (Wang, 1988). The b-values obtained by Ogubazghi and Goitom (2015) for the southern Red Sea range from 0.5 to 1.5, demonstrating coherence with the b-values measured in the current study. As traditional rifting processes manifest in normal faulting mechanisms, the ambient tectonic activity in the southern Red Sea is largely associated with an extensional stress regime. On the other hand, local tectonic complications are expressed in strike-slip faulting mechanisms. The difference in variability in b values distinguishes different tectonic processes in active regions. Mean return periods and exceedance probabilities are summarized in Fig. 4a, b, and c, respectively. Moreover, Table 1 listed the Mean return periods and exceedance probabilities for selected magnitudes. The values of the period are significantly low. For the active zones identified here, the maximum expected magnitudes are 5.9 ± 0.9, 6.1 ± 0.3, 5.9 ± 0.3, 6.3 ± 0.3, 6.7 ± 0.7, 7.5 ± 0.3, 6.9 ± 0.5, 8.3 ± 1.1, 7.2 ± 0.4, and 5.9 ± 0.3 for return periods of 929, 55,4, 105, 48, 317, 102, 432, 2090, 1360, and 821 years, respectively, indicating that the calculated return period for large earthquakes is reasonable. Table 2 shows a low likelihood of annual occurrence based on the predicted mean activity rate, return periods, and probability of exceedance for the highest potential magnitude in the identified zones. However, the probability of annual occurrence is relatively higher in zones 3, 4, 6, and 10 than in other zones.
| Zone | Mmax | λ | Rp | Probability | |||
|---|---|---|---|---|---|---|---|
| T=1 | T=25 | T=50 | T=100 | ||||
| 1 | 5.9±0.9 | 0.0011 | 929 | 0.1% | 2.7% | 5.2% | 10.2% |
| 2 | 6.1±0.3 | 0.0018 | 554 | 0.2% | 4.4% | 8.6% | 16.4% |
| 3 | 5.9±0.3 | 0.0095 | 105 | 0.9% | 21.0% | 37.4% | 60.2% |
| 4 | 6.3±0.3 | 0.0021 | 48 | 2.1% | 40.4% | 63.9% | 86.1% |
| 5 | 6.7±0.7 | 0.0032 | 317 | 0.3% | 7.6% | 14.5% | 26.8% |
| 6 | 7.5±0.3 | 0.0098 | 102 | 1.0% | 21.6% | 38.3% | 61.4% |
| 7 | 6.9±0.5 | 0.0023 | 432 | 0.2% | 5.6% | 10.9% | 20.5% |
| 8 | 8.3±1.1 | 0.0005 | 2090 | 0.1% | 1.2% | 2.4% | 4.7% |
| 9 | 7.2±0.4 | 0.0007 | 1360 | 0.1% | 1.8% | 3.6% | 7.1% |
| 10 | 5.9±0.3 | 0.0123 | 82 | 1.2% | 26.6% | 45.2% | 69.4% |
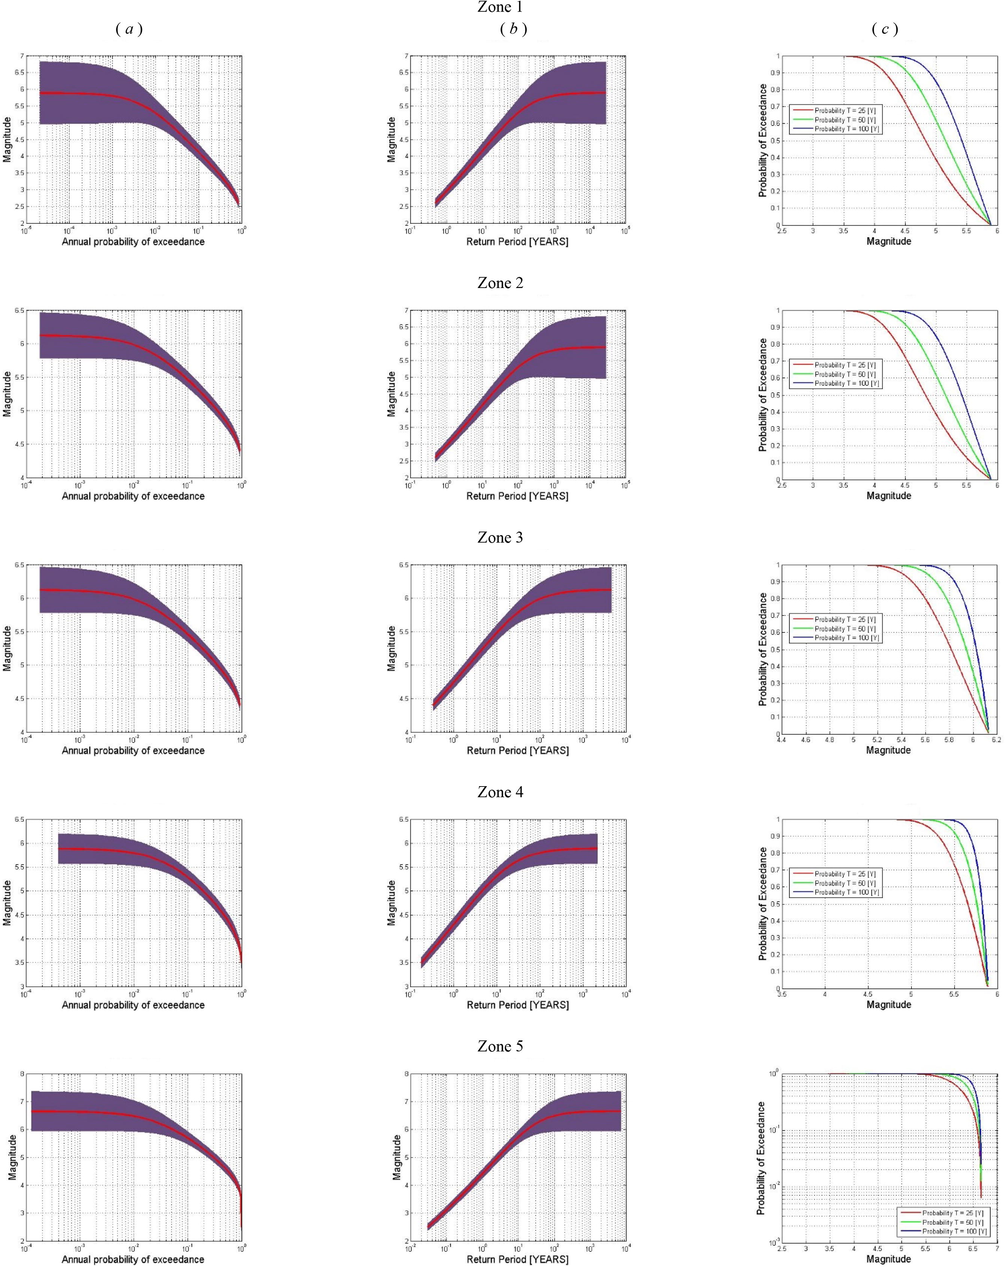
- Curves of earthquake recurrence parameters. (a) Seismic hazard curves that represented the annual probability of exceedance (b) return period, and (c) Probability of exceeding against magnitude that may occur at least once the time span of 25, 50, and 100 yrs.
- Curves of earthquake recurrence parameters. (a) Seismic hazard curves that represented the annual probability of exceedance (b) return period, and (c) Probability of exceeding against magnitude that may occur at least once the time span of 25, 50, and 100 yrs.
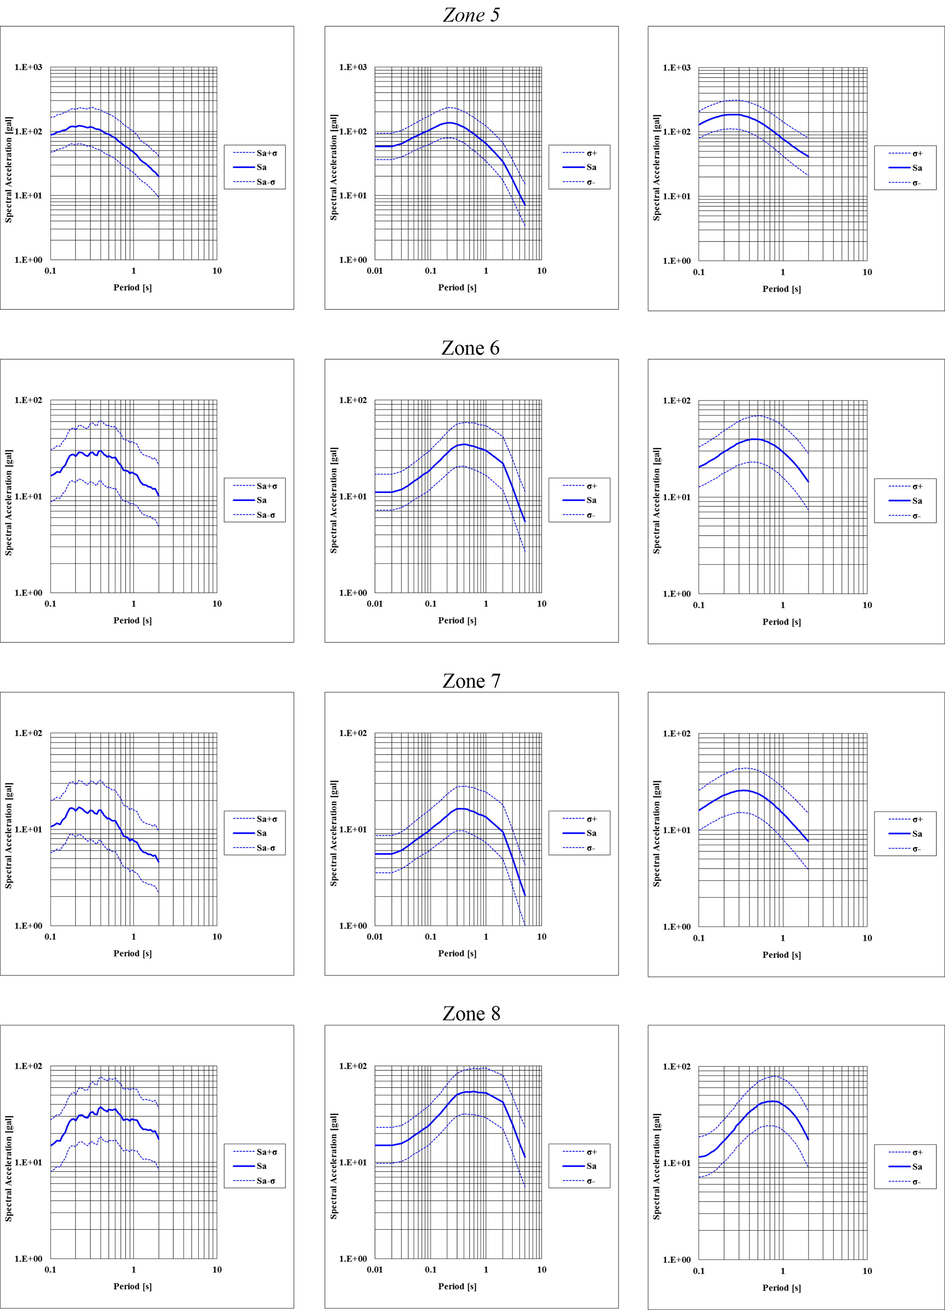
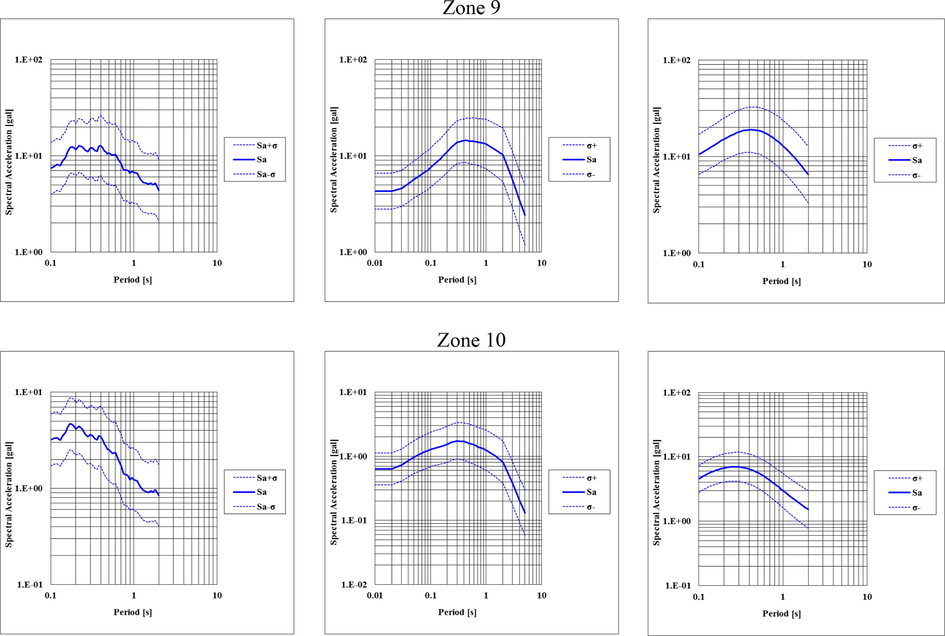
Seismic hazard maps, which provide information about the distribution of ground motion vibrations and potential seismic hazards, are the first step in addressing earthquake threats. The region located between latitudes 08° to 22oN and longitudes of 45° to 58oE was divided into grid cells with an interval of 1o × 1o along latitude and longitude. Fig. 5 shows the calculated PGA values using the attenuation relationships of Fukushima and Tanaka (1990), Sadigh et al. (1997), Ambraseys et al. (2005), Kiuchi et al. (2019), and Abdelfattah et al. (2021b). The maximum ground motion values are associated with the 84% for selected probability of exceeding the median value. In general, the effects exhibit low seismic hazard in Jizan metropolis, compared to the high seismic hazard found alongside the coastlines in the southernmost part of the Red Sea at the connection to the Gulf of Aden, and a decrease in seismic hazard in the direction to the Arabian Shield. The PGA values are about 0.04 and 0.17 g in Jizan City and the coastline of the southernmost part of the Red Sea, respectively. Based on the response spectra in Fig. 6, Zone 5 is likely to export the highest seismic hazard to Jizan city although the maximum potential magnitude in the respective zone is not the maximum for which distance plays a major role. Furthermore, the response spectra demonstrate that the largest PGA values correlate to spectral frequencies in the range of 2–5 Hz, suggesting higher-frequency features that should be addressed when evolving building standards in the region.
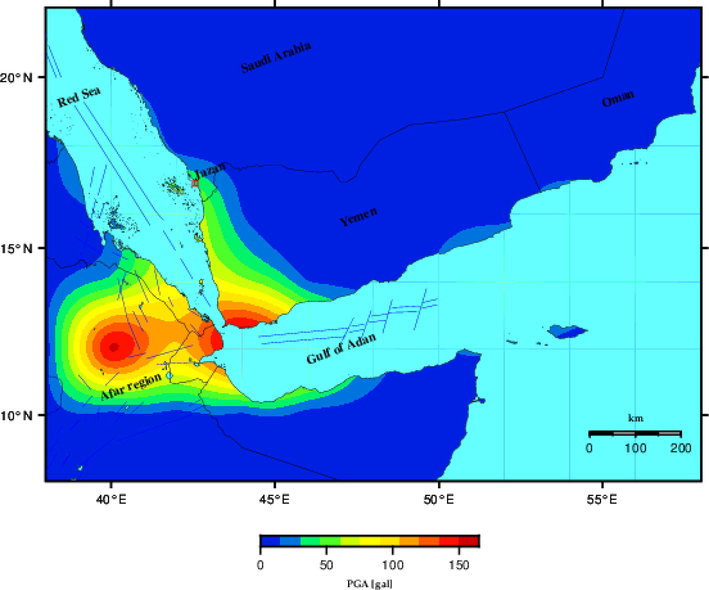
- Seismic hazard map as represented in terms of mean peak ground acceleration calculated from the contribution of a total number of ten active seismogenic zones and their corresponding maximum probable magnitudes.
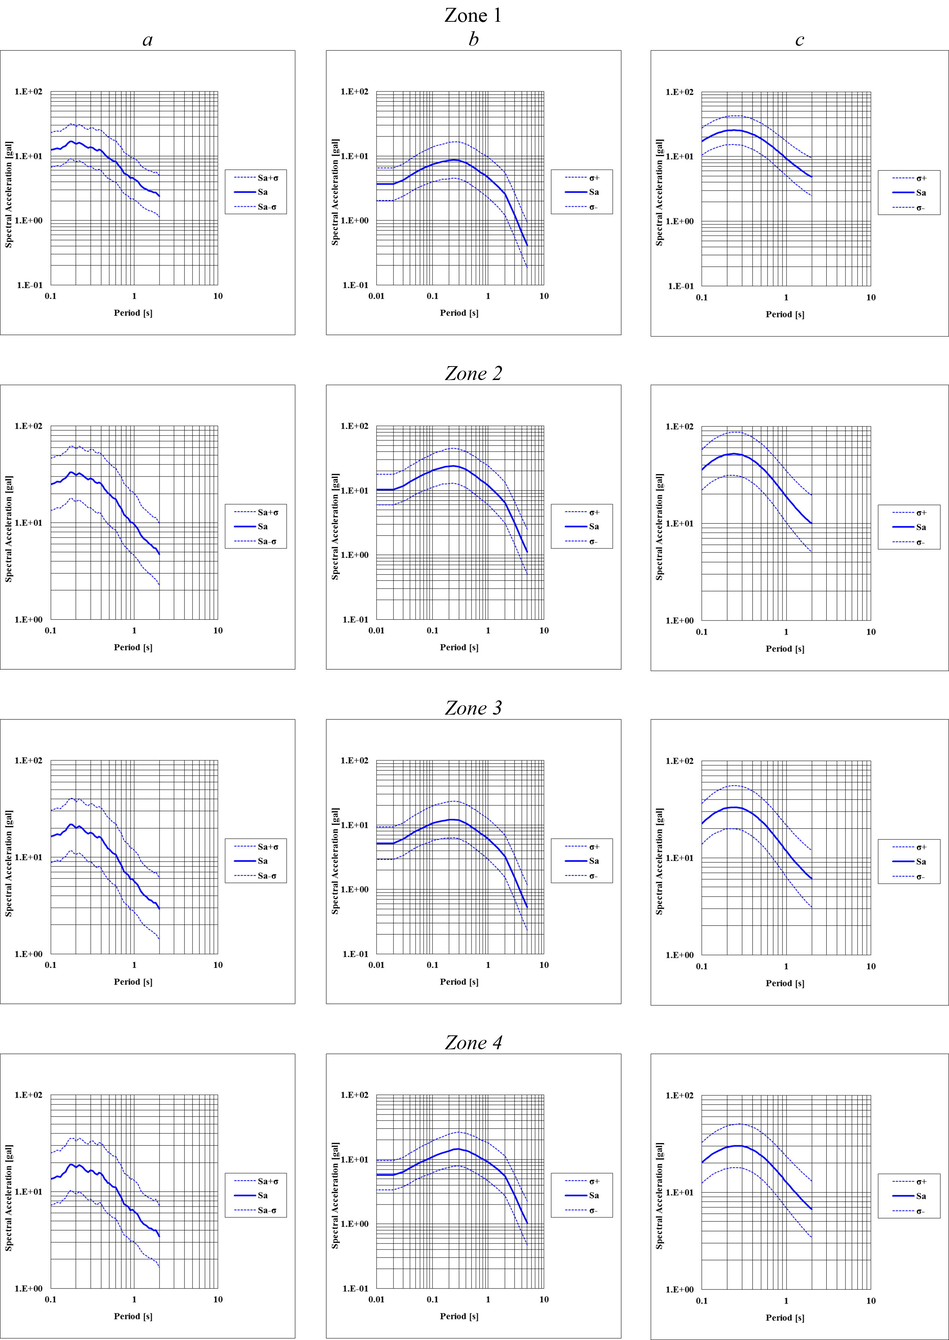
- The response spectrum curves that estimated at the hard rock of Jizan city using the models of (a) Ambraseys et al. (1996), (b) Abrahamson and Silva (1997), and (c) Boore et al. (1997).
- The response spectrum curves that estimated at the hard rock of Jizan city using the models of (a) Ambraseys et al. (1996), (b) Abrahamson and Silva (1997), and (c) Boore et al. (1997).
- The response spectrum curves that estimated at the hard rock of Jizan city using the models of (a) Ambraseys et al. (1996), (b) Abrahamson and Silva (1997), and (c) Boore et al. (1997).
For comparison, seismic hazard analyses using deterministic and probabilistic methodologies were carried out in Oman, Egypt, and Saudi Arabia (Al-Amri, 1995; Al-Arifi et al., 2013; El-Hussain et al., 2012; Abd el-aal et al., 2015; Ezzelarab et al., 2016; Sokolov et al., 2017; Mostafa et al., 2018; Mostafa and Abdelhafiez, 2019; Deif et al., 2020). In comparison to the Gulf of Aqaba region, the current results demonstrate lower estimates of seismic hazard. Previous results obtained in the northern region of Saudi Arabia revealed higher seismic hazards than those found in this study. The findings are comparable to those obtained for the Gulf of Suez, northern Egypt, and the Sultanate of Oman.
7 Conclusions
The analysis of seismic activity and seismic hazards associated with earthquakes in the southern Red Sea region is presented in this study. The b value, activity rate, and maximum earthquake potential were determined for ten earthquake source areas. Several attenuation relationships have been used to account for epistemological uncertainties in predicting ground motion. The computations have been performed for ten active seismic zones. The results obtained in this study bring forth the following conclusions:
-
The estimated b value ranged from 0.74–0.02 to 1.42–0.12, reflecting the complex tectonic processes in the region. The zones of b-values less than 1.0 are characterized by a high rate of crustal deformation, variability in rock characteristics, and large earthquakes are predicted to occur in the future. On the other hand, zones with higher b-values may be prone to small-size earthquakes which can be characterized as seismic swarm activities.
-
The earthquakes of maximum possible magnitudes ranged from 5.9 to 8.3. According to an analysis of seismicity in the ten seismic zones, the region is anticipated to be affected by maximum earthquakes with an annual exceedance likelihood of 0.1–1.2%. In the active seismic zone that is close to Jizan city, the probabilities of exceedance to have potential earthquakes with a magnitude of 6.7 ± 0.7 are 0.3, 8, 15, and 27% in 1, 25, 50, and 100 years’ lifetime.
-
Taking into account all of the source regions that may lead to hazards in the region, the PGA maps demonstrate that the consequences of seismic hazards on coastlines are relatively higher than the potential impacts inside the continental shield. It is worth emphasizing that spectral acceleration curves exhibited corresponding maximum PGA values of spectral periods ranging from 2 to 5 s in Jizan city, indicating high-frequency characteristics that should be properly addressed in developing building codes. Although the maximum potential magnitude in zone 5 is not the maximum but distance plays a major role, the zone is likely to export the highest seismic hazard to Jizan city.
Acknowledgements
This research was funded by the National Plan for Science, Technology and Innovation (MAARIFAH), King Abdulaziz City for Science and Technology, Kingdom of Saudi Arabia, Award Number (14-SPA576-02).
Declaration of Competing Interest
The authors declare that they have no known competing financial interests or personal relationships that could have appeared to influence the work reported in this paper.
References
- Abd el-aal, A.Kh., Kamal, H., Abdelhay, M., Elzahaby, Kh., 2015. Probablistic and stochastic seismic hazard assessment for wind turbine sites in Zafarana wind farm, Gulf of Suez, Egypt. Bull. Eng. Geol. Environ. 74, 1225-1241.
- Abdelfattah, A.K., Al-Amri, A., Abd el-aal, A.K., Zaidi, F.K., Fnais, M., Almadani, S., Al-Arifi, N., 2017. The 23 January 2014 Jizan earthquake and its tectonic implications in southwestern Saudi Arabia. Tectonophysics 712–713, 494–502.
- An analysis of a moderate earthquake, eastern flank of the Red Sea, Saudi Arabia. Earth Planets Space. 2020;72:1-17.
- [Google Scholar]
- Abdelfattah, A.k., Jallouli, Ch., Fnais, M., Qaysi, S., Alzahrani, H., Mogren, S., 2021a. The key role of conjugate fault system in importing earthquakes into the eastern flank of the Red Sea. EPS 73, Article no. 178.
- Abdelfattah, A.K., Al-amri, A., Abdelrahman, K., Fnais, M., Qaysi, S., 2021b. Attenuation relationships of peak ground motions in the Jazan Region. Arab. J. Geosci. 14, Article no. 139.
- Abrahamson, N.A., 2000. State of the practice of seismic hazard evaluation. Proc GeoEng 2000 1, 659–685, Melbourne, Australia.
- Empirical response spectra attenuation relations for shallow crustal earthquakes. Seismol. Res. Lett.. 1997;68:94-127.
- [Google Scholar]
- A new evaluation of seismic hazard for the northwestern part of Saudi Arabia. Nat. Hazards. 2013;69:1435-1457.
- [Google Scholar]
- Preliminary seismic hazard assessment of southern Red Sea region. J Eur Earthq Eng. 1995;3:33-38.
- [Google Scholar]
- A History of Persian Earthquakes. Cambridge: Cambridge University Press; 1983. p. :219.
- The prediction of horizontal reponse spectra in Europe. Earthquake Eng. Struct. Dyn.. 1996;25:371-400.
- [Google Scholar]
- Equations for the estimation of strong ground motions from shallow crustal earthquakes using data from Europe and the Middle East: Horizontal Peak Ground Acceleration and Spectral Acceleration. Bull. Earthq. Eng.. 2005;3:1-53.
- [Google Scholar]
- Probabilistic seismic hazard analysis (psha) for Ethiopia and the neighboring region. J. Afr. Earth Sci.. 2017;134:257-264.
- [Google Scholar]
- Basem, A., 2021. Constraints on the Rate of Crustal Deformation in the Southern Red Sea Region. A thesis presented for the Master degree of Science, Geology and Geophysics Department, King Saud University, pp 85.
- On the use of logic trees for ground-motion prediction equations in seismic hazard analysis. Bull. Seismol. Soc. Am.. 2005;95:377-389.
- [Google Scholar]
- Equations for estimating horizontal response spectra and peak acceleration from western North American earthquakes: a summary of recent work. Seismol. Res. Lett.. 1997;68:128-153.
- [Google Scholar]
- Magma systems related to the Red Sea opening. Tectonophysics. 1987;150(1–2):77-100.
- [Google Scholar]
- Deif, A., El-Hussain, I., Al-Shijbi, Y., Mohamed, A.M.E., 2020. Updating a probabilistic seismic hazard model of Sultanate of Oman. Arab. J. Geosci. 13, article no. 502, https://doi.org/10.1007/s12517-020-05394-8.
- Probabilistic seismic hazard maps for the sultanate of Oman. Nat. Hazards. 2012;64:173-210.
- [Google Scholar]
- Developing a seismic source model for the Arabian plate. Arab. J. Geosci.. 2018;11(15):435.
- [Google Scholar]
- Evaluation of seismic hazard at the northwestern part of Egypt. J. Afr. Earth Sci.. 2016;113:114-125.
- [Google Scholar]
- A new attenuation relation for peak horizontal acceleration of strong earthquake ground motion in Japan. Bull. Seismol. Soc. Am.. 1990;80:757-783.
- [Google Scholar]
- Crustal structure of southwestern Saudi Arabia. J. Geophys. Res.. 1986;91:6491-6512.
- [Google Scholar]
- Geologic Map of the Yemen Arab Republic (San'a): Miscellaneous Investigations Series Map I-1143-B, scale 1: 500,000. Reston, VA: U. S. Geological Survey; 1978.
- The afar depression: interpretation of the 1960{2000 earthquakes. Geophys. J. Int.. 2003;155(2):715-732.
- [Google Scholar]
- Estimation of the maximum earthquake magnitude, Mmax. Pure Appl. Geophys.. 2004;161:1655-1681.
- [Google Scholar]
- Ground-motion prediction equations for Western Saudi Arabia. Bull. Seismol. Soc. Am. 2019
- [CrossRef] [Google Scholar]
- Saudi Arabian seismic deep refraction profiles: a travel time interpretation of deep crustal structure. Tectonophysics. 1985;111:173-246.
- [Google Scholar]
- Mostafa, Sh. I., Abd el-aal, A. Kh., El-Eraki, M.A., 2018. Multi scenario seismic hazard assessment for Egypt. J Seismol 22, 669-696
- Mostafa, Sh.I., Abdelhafiez, H.E., Abd el-all, A. Kh., 2019. Determinstic scenarios for seismic hazard assessment in Egypt. J. Afr. Earth Sci. 160, article no. 103655, doi.org/10.1016/j.jafrearsci.2019.103655.
- Ogubazghi, Gh., Goitom, B., 2015. Seismicity of the western side of the southern Red Sea. N.M.A. Rasul and I.C.F. Stewart (eds.), The Red Sea, Springer Earth System Sciences, 161-173, doi10.1007/978-3-662-45201-1_9.
- Seismic hazard assessment and rheological implications: a case study selected for cities of Saudi Arabia along the eastern coast of Red Sea. Arabian J. Geosci.. 2017;10(24):540.
- [Google Scholar]
- Attenuation relationships for shallow crustal earthquakes based on California strong motion data. Seismol. Res. Lett.. 1997;68:180-189.
- [Google Scholar]
- Probabilistic seismic hazard assessment for Saudi Arabia using spatially smoothed seismicity and analysis of hazard uncertainty. Bull. Earthq. Eng.. 2017;15(7):2695-2735.
- [Google Scholar]
- Kinematics and deformation of the southern Red Sea from GPS observations. Geophys. J. Int.. 2020;221:2143-2154.
- [Google Scholar]
- b values of shallow earthquakes in Taiwan. Bull. Seismol. Soc. Am.. 1988;78(3):1243-1254.
- [Google Scholar]
- Geophysical constraints on the dynamics of spreading centres from rifting episodes on land. Nature Geosci.. 2012;5:242-250.
- [Google Scholar]


