

Translate this page into:
Dosimetric analysis of Rapid Arc (VMAT) treatment planning in head and neck cancer for quality assurance treatment
⁎Corresponding author. naimaamin@cuilahore.edu.pk (Naima Amin)
-
Received: ,
Accepted: ,
This article was originally published by Elsevier and was migrated to Scientific Scholar after the change of Publisher.
Peer review under responsibility of King Saud University.
Abstract
The current investigation aimed to compare the treatment plans of simultaneous integrated boost (SIB) fixed intensity modulated radiation therapy (IMRT) and SIB RapidArc (RA) using a number of dosimetric indices. In this study, 29 patients of nasopharyngeal carcinoma (NPC) were considered for treatment plan evaluation of SIB RA and SIB IMRT. The plans were evaluated using conformity index (CI), target coverage (TC), gradient index (GI), external volume Index (EI), homogeneity index (HI), dose heterogeneity index (DHI), standard deviation (SD), and unified dosimetric index (UDI). The dose of each planned target volume (PTV) and organs at risk (OARs) was determined using their respective mean and median doses. In accordance with the results, there is no noticeable difference in the values of CI, TC, GI, EI, and UDI for SIB RA and SIB IMRT. DHI of PTV 54 is better for SIB IMRT as compared to SIB RA and DHI of PTV 60, PTV 70 is same for both techniques. HI, SD and sparing of OARs results in better values for SIB RA as compared to SIB IMRT. However, PTV 54 and PTV 60′s doses indicate over dosage. The dose of PTV 70 is found to be within the limits of prescribed dose for both SIB RA and SIB IMRT. SIB RA homogeneity, sparing of OAR, and SD are observed to be superior to SIB IMRT. In the case of RA, less time and a monitor unit are used. In conclusion, SIB RA is thought to be better than SIB IMRT for the treatment of NPC.
Keywords
IMRT
Rapid arc
Dosimetric parameters

1 Introduction
Head and neck cancer (HNC) treatment highly depend on radiotherapy. The purpose of radiotherapy is to control cancer and reduce the side effects. Additionally, deliver the maximum dose to the target while reducing the exposure to organs at risk (OAR) (Silky T et al., 2020). Head and neck cancer radiotherapy is quite complicated due to its complex structures, and many OARs are very near to the irradiation part of the organ (Ouyang et al., 2019).
Intensity-modulated radiotherapy (IMRT) plays a crucial role in treating the HNC (Han et al., 2021). Intensity-modulated radiotherapy is useful in saving normal tissues and organs together and provides a high dose to the target. The major disadvantage of IMRT is that it consumes longer treatment time; also, it uses large number of fixed beam angles and monitor units (MU) (Cho, 2018; Mashhour et al., 2018).
Rapid Arc (RA) reduces the number of MU and shortens treatment time compared to IMRT. RA dosage rate, multileaf collimator location, and gantry speed are continually changing. Rapid Arc gives maximal dosage to target from all angles while preserving normal tissues. Rapid Arc distributes radiation by employing one or more arcs (Hyunsoo et al., 2021).
According to the previous study of HNC (Osborn, 2017), VMAT gives good homogeneity as well as sparing of OAR. Moreover, VMAT takes a shorter time and use less number of monitor units as compared to IMRT. However, the previous study found that IMRT is preferable to VMAT for treating HNC (Mashhour et al., 2018).
The goal of this study is to determine which treatment modality is the most successful and feasible option for HNC patients, by analyzing and comparing the plan quality of IMRT and VMAT procedures with the use of a variety of dosimetric indices.
2 Material and methods
In this study, those 29 patients that are register in Shaukat Khanum Memorial Cancer Hospital and Research Centre (SKMCH) for the treatment of Nasopharynx carcinoma (NPC) were taken for evaluation of the plan. The approval number of institutional review board is 8273 (25 June 2021). All patients were treated with SIB RA. For comparison, original plans of SIB RA optimized using SIB IMRT. CT scan of every NPC patient was performed in the supine position with 3 mm slice thickness. Immobilization devices face mask and headrest C used during the scan. The gross target volume (GTV), clinical target volume (CTV) and three planning target volumes (PTV54, PTV60, PTV70) contoured on CT scan image. The prescribed dose (PD) of PTV54, PTV60, and PTV 70 are 54 Gy, 60 Gy, and 70 Gy respectively. The total PD is 69.96 Gy delivers in 33 fractionations. The OAR that receives the PD is the spinal cord, brain stem, left and right parotids, left and right eyes, optic nerves, optic charisma, left and right cochlea, lens. All SIB RA plans and SIB IMRT plans were designed in Eclipse treatment planning system version 8.6 for 6 MV photon beam. SIB RA plan used two arcs. 181–179 were set in the clockwise direction, and 179–181 were set in the counterclockwise direction. In SIB IMRT plan, seven fixed angles (51,102,151, 202,251,302,351) were used. The plan was evaluated by using are target coverage (TC), conformity index (CI), homogenity index (HI), dose heterogeneity index (DHI), gradient index (GI), unified dosimetric index (UDI), external volume index (EI), and standard deviation (SD).
TC is the percentage of the volume of PTV that receives the prescribed isodose ( over the PTV (Akpati et al., 2008)
100 % TC shows that the plan accurately covers the PTV. Only 90 % to 95 % TC is acceptable. If TC is greater or equal to 80 % mean that there is a minor error in the plan to cover the PTV. TC less than 80 % shows that the plan has a major error in covering the PTV (Atiq et al., 2018).
CI evaluates dose plans. It assesses the shape and volume of neighboring tissue impacted by the reference dose (Salman et al., 2022). CI is designed to examine section-by-section dose distribution. CI readings outside the permissible range demand more appropriate treatment.
CI is the ratio of target volume receiving 95 % of the total PD ( and PTV
The value of CI is acceptable only within the range of 1 to 2. A small amount of dose goes outside the PTV if the value of CI is between 0.9 and 1 or 2 and 2.5. A significant volume is irradiated outside the PTV if the CI value is less than 0.9 or greater than 2.5 (Atiq et al., 2018).
The TC variation in the isodose surface (IDS) that is used to measure dose has a big effect on the CI value variation in a certain way. Different dose distribution plans indicates that specific TC can minimize the CI value inconsistency.
HI is the ratio of the maximum volume receives how much dose ( ) and PD.
The value of HI is only acceptable when HI is less than or equal to 2. There is a minor error if the value of HI is between 2 and 2.5 and a major error at greater than 2.5 (Mashhour et al., 2018).
DHI is the percentage of 20 % volume of target receives how much dose ( ) and 80 % target volume receives how much dose ( ) over the PD ( ).
Value of is always greater than the value of (Ding et al., 2010).
The GI is the ratio of the volume that receives the total PD of PTV ( ) and the volume that receives half of the total PD of the PTV (
The lowest ratio of and indicates that GI is good (Atiq et al., 2018).
The EI is the percentage of the volume of healthy tissues, which gets a higher dose ( ) than the PD over the PTV (Scorsetti et al., 2010)
SD shows that how much dose goes outside the target. and of each PTV is used to evaluate the PTV dose. The dose of PTV is overdosed if receiving dose is greater than PD and the dose is under dosed if receiving dose is less than PD.
UDI is defined as
The quality of the plan is ideal if the value of UDI is equal to 1. The value of UDI less than mean- SD shows that the plan is considered as excellent, value between mean – SD and mean then plan is considered as good, a value between mean and mean + SD then plan is regarded as average and value greater than mean + SD then plan is to find as worse (Akpati et al., 2008).
and are used to evaluate the dose of OAR. Comparison of two techniques is made by using Wilcoxon signed rank test. If p ≤ 0.05 then the results is statistically significant.
3 Results
This study evaluates 29 NPC patients' RA and IMRT plans using 8 dosimetric indices. Tables 1 and 2 demonstrate the mean values of 8 dosimetric indices, mean dosage, and median dose of PTV 54, 60, and 70 for RA and IMRT. All PTVs are homogeneous enough for RA and IMRT. PTV 54, 60, and 70 have better RA HI than IMRT. All are statistically significant, according to p value.
is the mean dose,
is the median dose, HI is the homogenity index, DHI is the dose heterogeneity index, TC is the target coverage, CI is the conformity index, GI is the gradient index, EI is the external volume index, SD is the standard deviation, and UDI is the unified dosimetric index. Statistical test was performed by using Wilcoxon signed rank test.
DI
PTV54
PTV60
RA
IMRT
p
RA
IMRT
p
62.50
1.5
61.55
2.1
0.01
63.49
1.6
62.68
2.1
0.01
62.36
2.1
60.59
2.1
0.01
62.83
1.4
61.31
1.4
0.01
HI
1.37
1.42
0.01
1.23
1.27
0.01
DHI
14 %
13 %
0.05
11 %
12 %
0.18
TC
98.2 %
98.3 %
0.78
94.8 %
94.7 %
0.97
CI
0.98
0.98
0.78
0.95
0.95
0.97
GI
0.98
0.98
0.78
0.95
0.95
0.97
EI
2.2 %
1.7 %
0.28
3 %
2 %
0.28
SD
6 %
7 %
0.03
6 %
7 %
0.01
UDI
1.31
1.35
0.09
1.06
1.09
0.17
DI
PTV70
RA
IMRT
p
69.86
1.6
69.94
0.1
0.82
69.47
4.2
70.07
0.2
0.45
HI
1.06
1.08
0.01
DHI
2.8 %
3.1 %
0.24
TC
97.6 %
97.5 %
0.65
CI
0.97
0.97
0.65
GI
0.97
0.97
0.65
EI
3.5 %
4.5 %
0.43
SD
2 %
2.3 %
0.11
UDI
0.98
1.01
0.07
Fig. 1a,b,c show DHI for RA and IMRT PTVs. Some RA and IMRT patients have higher dose heterogeneity. Patient disease and condition affect dose heterogeneity. If the patient's disease is progressed, a larger dose than PTV PD is better. Some OARs require fewer doses than PD. PTV 54 has a better DHI for IMRT than RA, whilst PTV 60 and PTV 70 have a better DHI for RA than IMRT. PTV 54′s DHI is statistically significant; however, PTV 60 and 70′s are not.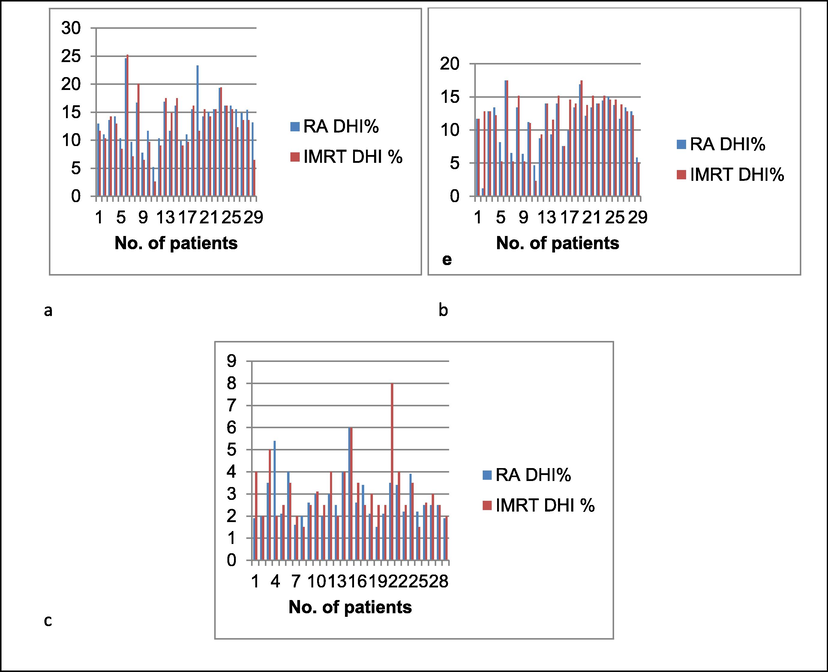
(a) shows the DHI of PTV 54, (b) shows the HI of PTV 60,(c) shows the DHI of PTV 70. Red color shows the DHI of IMRT and blue color shows the DHI of rapid arc.
The TC of PTV 54 is better for RA than IMRT. The TC of PTV60, and PTV 70, is better for IMRT than rapid arc. All are statistically not significant.
The CI of PTV 54 is better for RA than IMRT. The CI of PTV 60 and PTV 70, is better for IMRT than RA. All are statistically not significant.
The GI of PTV 54 and PTV 60 are better for RA than IMRT where for PTV 70, it is better for IMRT than RA. All are statistically not significant.
Fig. 2a, b, c shows EI results for RA and IMRT PTVs. Hotspots outside PTV70 are more relevant since PTV70 is near the goal and includes the dose of PTV54 and PTV60. PTV 54 and 60 have greater EI for IMRT than RA, but PTV 70 does. All are insignificant.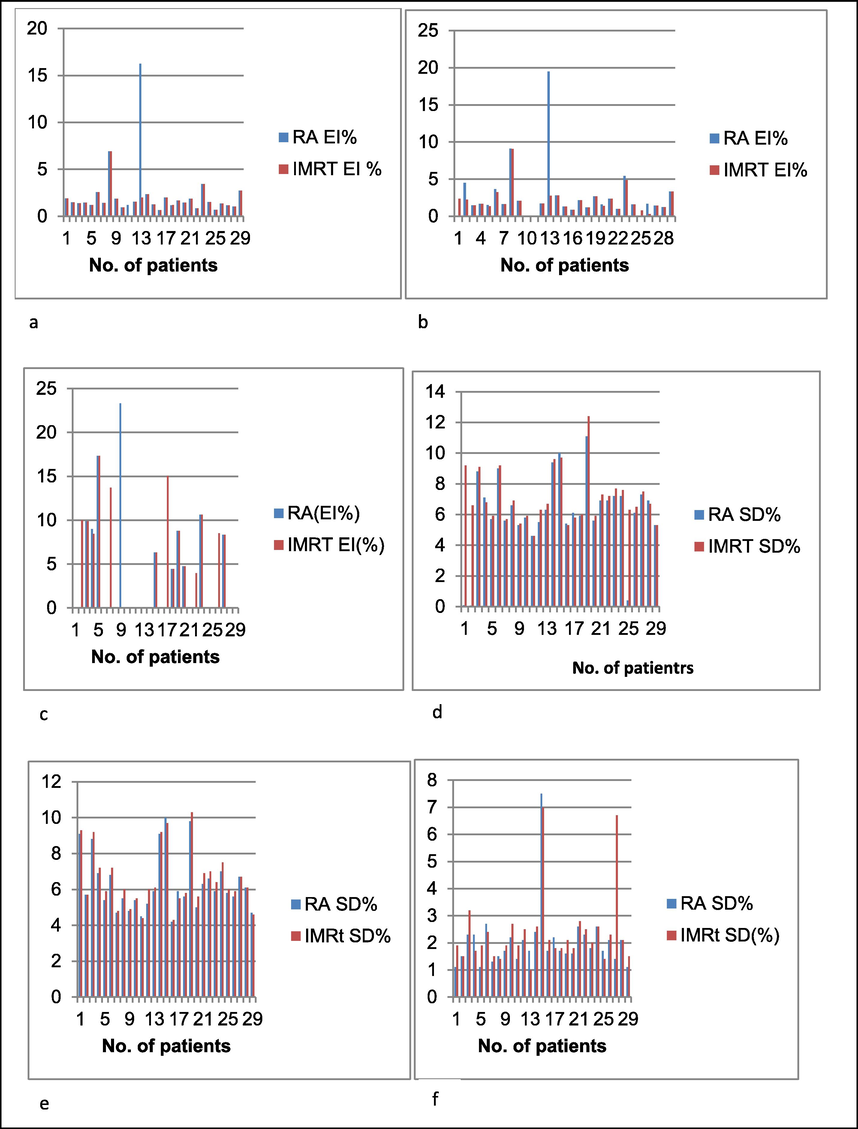
(a) shows the EI of PTV 54, (b) shows the EI of PTV 60,(c) shows the EI of PTV 70, (d) shows the SD of PTV 54, (e) shows the SD of PTV 60,(f) shows the SD of PTV 70. Red color shows the EI and SD of IMRT and blue color shows the EI and SD of rapid arc.
Fig. 2d, e,f shows SD of RA and IMRT PTVs. PTV 70 dosage is minimal.. PTV 54 and 60 have average dose spread. SD is better for RA than IMRT on PTV 54 and 60. It is significant statistically. PTV 70 SD is statistically better for RA than IMRT.
D mean and D median of PTV54 and PTV 60 are overdosed, but PTV 70 is within PD for RA and IMRT. D mean and D median of PTV 54 and PTV 60 are better for IMRT than RA. It's significant. The D mean and D median of PTV 70 is better for RA than IMRT, but not statistically significantly.
The data on UDI of all PTV’s for both RA and IMRT are shown in Fig. 3a,b,c. The plan quality of PTV 54, PTV 60 and PTV 70 is better for RA than IMRT. UDI is statistically not significant for PTV 54, PTV 60 and PTV 70.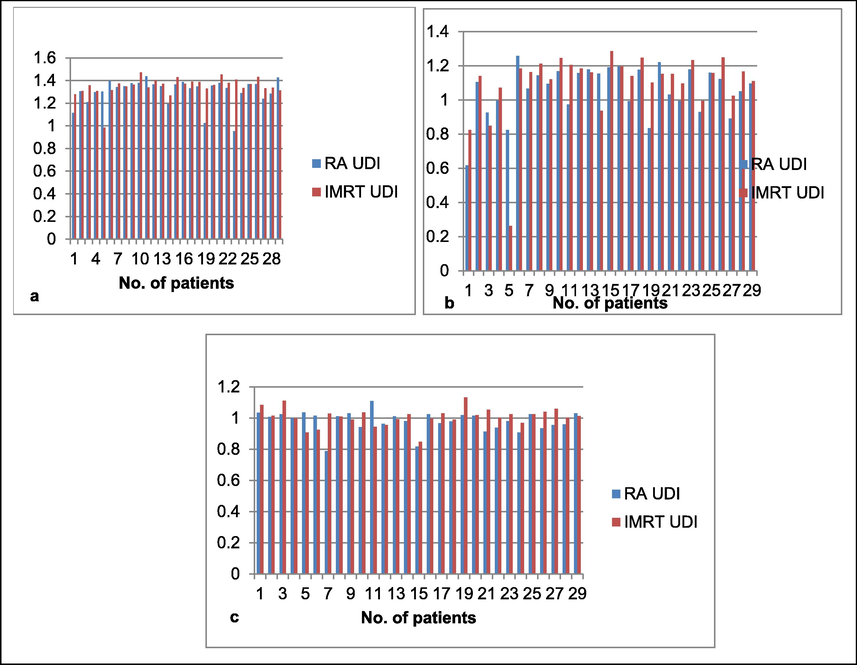
(a) shows the UDI of PTV 54, (b) shows the UDI of PTV 60, (c) shows the UDI of PTV 70. Red color shows the UDI of IMRT and blue color shows the UDI of rapid arc.
Table 3 demonstrates that IMRT reduces D max of left cochlea, right and left optic nerve, left eye and D mean of left and right parotid, left cochlea. RA reduces D max of optic charisma, brain stem, right eye, left and right lens, and right cochlea. All are insignificant. RA has a significantly lower D max of the spinal cord than IMRT. max is the maximum dose of oar, mean is the mean dose of OAR, LT is the left, RT is the right. Statistical test was performed by using Wilcoxon signed rank test.
Organ at Risk
Rapid Arc
IMRT
p
RT cochlea mean
9.39
18.92
9.53
19.24
0.91
Lt cochlea mean
8.14
18.05
7.76
17.38
0.15
RT optic Nerve max
39.14
22.55
38.86
22.04
0.54
LT optic Nerve max
38.42
22.65
36.44
22.26
0.83
Optic Chisma max
38.18
21.32
38.99
20.48
0.73
RT Parotid mean
36.15
13.15
31.70
12.26
0.09
Spinal Cord max
40.89
3.99
43.47
3.57
0.01
LT Parotid mean
32.38
11.54
29.39
11.31
0.23
Brain Stem max
48.48
13.82
49.79
11.03
0.23
LT Eye max
8.82
18.32
8.81
18.82
0.88
RT Eye max
9.11
18.27
10.39
18.78
0.42
Lens LT max
1.15
6.17
1.33
7.17
0.33
Lens RT max
1.15
6.17
1.37
7.39
0.33
4 Discussion
The previous study evaluates the plan of IMRT and RA by using maximum five dosimetric indices (Mashhour et al., 2018; Nguyen TL et al., 2022; Nikolett et al., 2021). In our study, the quality of the plan of both IMRT and the RA is precisely evaluated by using the eight dosimetric parameters. The results are compared to find out the effective treatment plan for the treatment of NPC patients. and of PTVs are used to evaluate the dose of PTVs. and of OAR is used to evaluate the dose of OAR.
Our study evaluates PTV dose homogeneity using HI. RA dose homogeneity is better than IMRT. Our study assesses PTV DHI. Specifically for high PTV, dosage heterogeneity is larger . PTV 54 and 60 have more dose variability than PTV 70. PTVs receive almost the PD due to high-dose homogeneity and low-dose heterogeneity. Low dosage homogeneity and high dose heterogeneity, on the other hand, suggest that the PTV receives more or less dose than the PD (Akpati et al., 2008). All previous studies have assessed the dosage homogeneity of PTVs using only the HI. They did not assess PTV dosage heterogeneity (Nguyen TL et al., 2022; Nikolett et al., 2021; Ning et al., 2013). Both dose homogeneity and heterogeneity of PTVs are investigated in this study. Our study determined that RA provides high dose homogeneity and minimal dose heterogeneity of the PTV, making RA homogeneity superior to that of IMRT.
Our study utilizes TC and CI to assess PTV coverage and conformity, respectively. When RA is compared to IMRT, there is no change in TC and CI (Vanetti et al., 2009). The earlier NPC study did not examine the dosage fall-off in the PTVs (Nguyen TL et al., 2022; Nikolett et al., 2021). GI is used in this study to assess dosage fall-off in PTVs. GI is found to be identical for both RA and IMRT. CI simply indicates that the PD is within PTV limits. CI permits determining the depth to which PD penetrates the PTV (Akpati et al., 2008). Consequently, GI must be identified during plan evaluation.
The CI and GI only give information about the dose inside the PTV. In order to check the percentage of dose goes outside the PTV, SD is used. This study found SD to be better for RA than IMRT. Small percentage of SD indicates that PTV receives almost the PD. On the other hand, large value of SD indicates that minor amount of dose go inside the PTV.
The results of our investigation also evaluate the hotspots outside the PTV with the help of EI. Our study observed that RA and IMRT has same amount of hotspots outside the PTV. The absence of hotspots outside PTV indicates that OAR outside the PTV receives no dose.
Our analysis found that the dose of PTV 54 and PTV 60 exceeds the specified limits, however the dose of PTV 70 is below the prescribed limits for both RA and IMRT. PTV 54 has a greater number of overdoses per dosage than PTV 60. The dose of PTV 70 is about equivalent in PD. This is because the PTV closest to the high PD PTV receives more radiation than the PD PTV (Ding et al., 2010).
Our study demonstrates that sparing of OAR is better for RA as compared to IMRT (Liu et al., 2012). If any OAR receives more dose than the tolerance dose of OAR, then there is a chance that some side effect may occur (Lee et al., 2012).
Using UDI, our investigation evaluates the plan's overall quality. Our investigation revealed that the plan quality for IMRT and RA is identical. The good plan has a high CI and GI value and a low HI value. Some situations indicate ideal conformity and coverage, but the quality of the plans is inferior. In this situation, the sparing of OAR is inappropriate, resulting in a decline in the quality of the plan (Akpati et al., 2008). A Low UDI score reveals the plan's slight flaw. A high UDI score indicates the plan's most significant flaw (Atiq et al., 2018).
Consequently, IMRT distributes the dose at different fixed angles; it takes longer and increases the MU (Cho, 2018). RA rotates continuously around the patient, hence it requires less time than IMRT. Due to less time consumption, the MU decreases, which decreases the risk of a second cancer. RA requires less time and minimizes MU in comparison to IMRT (Hyunsoo et al., 2021).
The SIB technique is a good way to treat a patient with NPC because it spares the OAR very well. The problem with using the SIB technique to treat patients is that PTV 54 and PTV 60 get a higher dose than PD. This means that dose homogeneity and SD are bigger for these two PTVs.
5 Conclusion:
To treat NPC patients, RA is preferable to IMRT because of its better homogeneity and its excellence in OAR sparing. In radiology, verifying the treatment plan with dosimetric indices is crucial for the treatment of cancer. In cancer patients, it helps lessen the severity of side effects. This method ensures the protection of cancer patients undergoing treatment.
Acknowledgments
None.
Informed Consent: This study was approved by the institutional board.
Declaration of Competing Interest
The authors declare that they have no known competing financial interests or personal relationships that could have appeared to influence the work reported in this paper.
References
- Unified dosimetry index (UDI): a figure of merit for ranking treatment plans. J. Appl. Clin. Med. Phys.. 2008;9(3):99-108.
- [CrossRef] [Google Scholar]
- A comparative study of rapid arc and intensity-modulated radiotherapy plan quality for cervical cancer treatment. Indian J. Cancer. 2018;55(1):74.
- [Google Scholar]
- Correction: Intensity-modulated radiation therapy: a review with a physics Perspective. Radiat. Oncol. J.. 2018;36(2):171.
- [CrossRef] [Google Scholar]
- A dosimetric comparison of stereotactic body radiation therapy techniques for lung cancer: robotic versus conventional linac-based systems. J. Appl. Clin. Med. Phys.. 2010;11(3):212-224.
- [Google Scholar]
- Early clinical outcomes of intensity modulated radiation therapy/intensity modulated proton therapy combination in comparison with intensity modulated radiation therapy alone in oropharynx cancer patients. Cancers. 2021;13(7):1549.
- [CrossRef] [Google Scholar]
- Effective organs-at-risk dose sparing in volumetric modulated arc therapy using a half-beam technique in whole pelvic irradiation. Front. Oncol.. 2021;11:611469.
- [CrossRef] [Google Scholar]
- Dual arc volumetric-modulated arc radiotherapy (VMAT) of nasopharyngeal carcinomas: a simultaneous integrated boost treatment plan comparison with intensity-modulated radiotherapies and single arc VMAT. Clin. Oncol.. 2012;24(3):196-207.
- [Google Scholar]
- Radiation therapy for nasopharyngeal carcinoma using simultaneously integrated boost (sib) protocol: a comparison planning study between intensity modulated arc radiotherapy vs. intensity modulated radiotherapy. Technol. Cancer Res. Treat.. 2012;11(5):415-420.
- [Google Scholar]
- Rapidarc vs conventional imrt for head and neck cancer irradiation: is faster necessary better? Asian Pac. J. Cancer Prev.. 2018;19(1):207-211.
- [CrossRef] [Google Scholar]
- Dosimetric comparison of intensity-modulated radiation therapy (IMRT) and field-in-field (FIF) technique for head-and-neck cancer. J. Radiother. Pract.. 2022;21(2):153-158.
- [CrossRef] [Google Scholar]
- Dosimetric Justification for the Use 0f Volumetric Modulated Arc Therapy In Head and Neck Cancer—A Systematic Review of the Literature. Laryngoscope Investigative Otolaryngol.. 2021;6:999-1007.
- [CrossRef] [Google Scholar]
- Is VMAT beneficial for patients undergoing radiotherapy to the head and neck? Radiography. 2017.Is;23(1):73-76.
- [CrossRef] [Google Scholar]
- Evaluation of auto-planning in imrt and vmat for head and neck cancer. J. Appl. Clin. Med. Phys.. 2019;20(7):39-47.
- [Google Scholar]
- Evaluation of conformity and homogeneity indices consistency throughout the course of head and neck cancer treatment with and without using adaptive volumetric modulated arc radiation therapy. Adv. Radiat. Oncol.. 2022;7(5)
- [CrossRef] [Google Scholar]
- Early clinical experience with volumetric modulated arc therapy in head and neck cancer patients. Radiat. Oncol.. 2010;5(1)
- [CrossRef] [Google Scholar]
- Parotid sparing and quality of life in long-term survivors of locally advanced head and neck cancer after intensity-modulated radiation therapy. Strahlenther Onkol.. 2021;197:219-230.
- [CrossRef] [Google Scholar]
- Volumetric modulated arc radiotherapy for carcinomas of the oro-pharynx, hypo-pharynx and larynx: A treatment planning comparison with fixed field IMRT. Radiother. Oncol.. 2009;92(1):111-117.
- [Google Scholar]


