

Translate this page into:
Diagnostic, prognostic and treatment response of perilipin1 gene in breast cancer
⁎Corresponding author at: Center of Excellence in Genomic Medicine Research, King Abdulaziz University, Jeddah, Saudi Arabia. skarim1@kau.edu.sa (Sajjad Karim)
-
Received: ,
Accepted: ,
This article was originally published by Elsevier and was migrated to Scientific Scholar after the change of Publisher.
Abstract
Background
Genetic alterations in the perilipin (PLIN) family genes (PLIN1 to PLIN5) were infrequent in breast cancer (BC) where enhanced levels of PLIN1, PLIN3-5 were observed in the luminal A and luminal B subgroups, whereas increased PLIN2 expression was observed in the HER2-enriched and basal-like subgroups. However, the predictive value of PLIN1 for BC patient outcomes remains uncertain. In the present study, we aim to investigate the diagnostic, prognostic and treatment response roles of the PLIN1 gene expression in BC.
Methods
We obtained microarray BC trancriptomic data of 320 tumor (T) and 62 normal (N) breast samples from five GEO data-series; GSE7904 (38 T:7N), GSE42568 (101 T: 15 N), GSE26910 (6 T:6N), GSE45827 (144 T:7N), and GSE10810 (31 T:27 N). The Welch t test was used to analyze the significant differences in gene expression including PLIN1 with fold change > ±2 and p-value < 0.05. The expression of PLIN1 was confirmed by RTqPCR using clinical specimen samples from BC patients. The Kaplan-Meier Plotter was used to assess survival on large independent dataset (31 dataset for relapse-free survival and 14 datasets for overall survival) and significance was determined by calculating hazard ratios (>1) and log-rank p-values < 0.05. We also assessed the treatment outcomes of endocrine therapy (tamoxifen and aromatase-inhibitors), anti-HER2 therapy (trastuzumab and lapatinib), and chemotherapy (taxane, anthracycline, and ixabepilone) using robust statistical methods and correlated with PLIN1 gene expression.
Results
We identified significantly reduced expression of PLIN1 (FC = −30.76, p value = 2.183e−24) in BC samples compared with normal controls. Our qPCR result confirmed the microarray expression pattern of PLIN1 in BC. Survival analysis revealed PLIN1 to be a moderately important prognostic biomarker. Our findings highlight the effectiveness of trastuzumab and anthracycline in classifying treatment responses, supported by Mann-Whitney tests indicating statistical significance in gene expression differences between responders and non-responders.
Conclusion
In conclusion, our findings indicate that PLIN1 is one of the most down-regulated genes and a moderately important biomarker in BC for prognostic purposes. PLIN1 was a good indicator of trastuzumab and anthracycline treatment responses in BC.
Keywords
Breast cancer
PLIN1 gene
Gene expression
Welch test
Kaplan-Meier survival plot
Lancaster
Weighted Z and wFisher’s method

- PLIN1
-
Perilipin 1
- BC
-
Breast cancer
- DEGs
-
Differentially expressed genes
- RTqPCR
-
Real-time quantitative Polymerase chain reaction
- GEO
-
Gene Expression Omnibus
- KM
-
Kaplan and Meier
Abbreviations
1 Introduction
Breast cancer (BC) is most common among women, and its global burden is on the rise (Ramaswamy et al., 2001; Karim et al., 2022), and predicted to cross 3 million new cases with >1 million fatalities by the year 2040 (Arnold et al., 2022; Sung et al., 2021). While the majority of early-detected breast tumors are benign and treatable with surgery, approximately 25% of BC tumors exhibit aggressive nature and rapid spread (Cowin et al., 2005). So, it is essential to understand the underlying molecular mechanisms and discover new biomarkers and targets for cancer diagnosis, prognosis and therapeutics (Iqbal et al., 2023).
Hundreds of differentially expressed key genes such as BRCA1, BRCA2, PTEN, P53, KRAS, and BRAF have been reported for BC, but there are also few less explored genes detected in whole gene expression analysis that play a significant role in BC. However, the prognostic value of perilipin (PLIN) family members in BC patients remains uncertain. The PLIN family genes (PLIN1-PLIN5) primarily involved in the formation and degradation of lipid droplets (LDs) but also play significant roles in the development and progression of BC (Zhang et al., 2021). This study aims to evaluate and validate the diagnostic, prognostic, and therapeutic response importance of the PLIN1 gene in BC.
Statistical analysis using popular student t-test faces limitation. It is notably beneficial when comparing two samples with disparate variances and potentially varying sample sizes (Ruxton, 2006; Derrick & White, 2016). It might yield biased results for groups having different variances, because of its underlying assumptions of normality and homoscedasticity (homogeneity of variance), which can lead to unsound and unreliable mathematical inferences (Erceg-Hurn and Mirosevich, 2008). Assumptions of the student’s t-test require attention, checking and correction when violated. We applied Welch's t-test, due to its robust capability (Baguley, 2012; Delacre et al., 2017). Additionally, a Mann-Whitney U test was employed as an additional measure to cross-validate the significant expression of the PLIN1 gene in breast cancer. This non-parametric statistical test was chosen due to the data's lack of conformity to the assumptions of normality or homoscedasticity.
Survival analysis and prediction of prognosis is a key utility of confirmed differentially expressed PLIN1gene in BC. The survival function (probability ranging from one to zero) represents the likelihood that the patients will survive for a minimum specified duration, and it progressively decreases over time. Kaplan-Meier estimator (Kaplan-Meier Plotter) is the most common survival technique for gene expression among semi-parametric (Cox-proportional hazards method), parametric (Weibull and exponential models method), and nonparametric (Kaplan Meier product limit approach) (Emmert-Streib & Dehmer, 2019; Lánczky & Győrffy, 2021). In meta-analysis, data from various studies were combined by robust statistical methods/algorithms (“wFisher,” “Lancaster,” and “weighted z-method”) to derive a single p value by combining p values of independent cohorts. Weights were assigned to each individual p-value according to the sample size (wFisher method), as per degrees of freedom (Lancaster method) and Z transformation (Weighted Z-method) (Yoon et al., 2021).
Determining the predictive role of PNIL1 by anticipating the response to specific anticancer treatments in BC holds significant importance in tailoring systemic therapy or personalized medicine. It is possible to make therapeutic decisions of selecting hormonal, targeted or chemotherapy by the presence/absence of PLIN1, predictive biomarkers (Fekete & Győrffy, 2019). The selection of therapy depends on the tumor's molecular/pathological characteristics and patient's expected survival outcome (prognosis). We utilized the ROC Plotter online tool (https://www.rocplot.com/) to comprehensively investigate the correlation between the expression of the PLIN1 gene and assess the response to different therapies including endocrine therapy (tamoxifen and aromatase inhibitor), anti-HER2 therapy (trastuzumab and lapatinib), and chemotherapy (taxane, anthracycline, and ixabepilone) in BC (Fekete & Győrffy, 2019).
2 Materials and methods
2.1 Gene expression microarray data
We retrieved raw gene expression data in dot CEL files format from GEO (Gene Expression Omnibus) database at NCBI, a public repository for microarray and next-generation sequencing data (https://www.ncbi.nlm.nih.gov/geo/). A total of 320 BCE tumor samples and 62 control samples were obtained from GSE7904, GSE42568, GSE26910, GSE45827 and GSE10810 data series.
2.2 Identification of differentially expressed genes
2.2.1 Welch Satterthwaite t-test
We applied Welch Satterthwaite t-test using the formula below to compare the mean and detect the significant difference between BC and control
= sample means.
= standard error, for a particular example size and standard deviation
The Welch degrees of freedom
was calculated by using the Welch-Satterthwaite equation below:
2.2.2 Mann–Whitney U test
It is a nonparametric test and was applied as an additional measure for cross-validation: It has a null hypothesis: for randomly selected values x and y from tumor and control samples respectively, the probability of x being greater than y is equal to the probability of y being greater than x. p value of statistical significance was 0.05.
2.3 Real-time quantitative PCR
We used RTqPCR assay with Applied Biosystems StepOnePlus Real-Time PCR instrument (ThermoFisher Scientific, USA) to validate the expression of PLIN1 gene. PowerUp™ SYBR™ Green Master Mix with reference (GAPDH1 was used for Quantification. Comparative Ct (ΔΔCt) method was used for quantitative gene expression based on initial Ct values calculated by DataAssist™ Software. Additionally, RNA-seq results at UALCAN portal (https://ualcan.path.uab.edu/index.html) were used to confirm the expression pattern of PLIN1 at an independent bigger cohort of TCGA dataset.
2.4 Survival study
It was used to assess time-to-event data, such as the time until death or the amount of time needed for a particular event to occur. Survival analysis was conducted by determining the association between gene expression data and patient survival or the development of a disease. It provides insightful information behind the advancement of BC patients and their outcomes (prognosis), and statistical model for diagnostic and therapeutic strategies.
2.4.1 Hazard function and hazard ratio
The hazard function, which represents the instantaneous death rate, was defined as the likelihood that a person will pass away at a specific moment, presuming that person has survived up to that point. The survival function can be shown as
HR=1 (no risk difference between the groups); and HR>1 indicating some risk.
2.4.2 Kaplan-Meier method
This method determines the probability of passing away at a specified moment, assuming the person has so far survived using following mathematical formulation of the KM estimator (Kaplan and Meier, 1958):
recursive formula
2.5 Response to therapy
To rigorously assess the connection between gene expression and therapy response, we employed robust statistical methods: receiver operating characteristics (ROC) analysis and Mann-Whitney tests. The online platform ROC plotter (https://www.rocplot.com/) was used to validate the relationship between PLIN1 gene expression and the response to various therapies typically used in breast cancer including endocrine therapy drugs (tamoxifen and aromatase-inhibitors), anti-HER2 therapy drugs (trastuzumab and lapatinib), and chemotherapy drugs (taxane, anthracycline, and ixabepilone).
2.5.1 Receiver operating characteristics (ROC), area under curve (AUC) analysis
The ROC curve was the plot of the true positive rate against the false positive rate at each threshold setting, while AUC showed how well the test separated the two groups. A large area under the ROC curve predicted better treatment response. AUC values above 0.6 was acceptable, AUC values between 0.6 and 0.7 indicated clinically potential cancer biomarker, AUC values between 0.7 and 0.8 indicated high quality cancer biomarker, and AUC values above 0.8 referred to blockbuster biomarker.
2.5.2 Mann-Whitney U Test for response to therapy
The Mann-Whitney U test was a rank-based non-parametric test used here to determine if there are differences between two groups. Characteristics of the groups are usually presented by employing a box-and-whisker plot and p-value < 0.05 was considered significant (Fekete & Győrffy, 2019).
3 Results
3.1 Microarray data and samples
We retrieved expression data from five datasets: GSE7904, GSE42568, GSE26910, GSE45827, and GSE10810, to analyze the expression of PLIN1 in breast cancer. A total of 320 tumor samples and 62 control samples were obtained from GSE7904 (38 tumor samples and 7 control samples), GSE42568 (101 tumor samples and 15 control samples), GSE26910 (6 tumor samples and 6 control samples), GSE45827 (144 tumor samples and 7 control samples), and GSE10810 (31 tumor samples and 27 control samples).
3.2 Expression profiling and statistical tests
We found notably down expression of PLIN1 gene in individual data series with fold change (FC) of −6.91, −53.93, −2.17, −35.46 and −24.63 for GSE7904, GSE42568, GSE26910, GSE45827, GSE10810 respectively, and FC = −30.76 for combined data of 320 tumors and 62 control samples. The Tukey Fence method used for outlier detection, suggested that the tumor dataset contains 11 (3.44%) potential outliers, while the control dataset contains 10 (16.13%) potential outliers. The Shapiro-Wilk test yielded W= 0.89 with p-value of 8.611e-14 for the tumor dataset, and W= 0.74 with p-value of 5.958e-09 for the control dataset, indicating significant deviation from a normal distribution. The Kolmogorov-Smirnov test resulted in D =1 with p-values of 2.2e-16 for the tumor dataset and D =1 with p-values of 7.772e-16 for the control dataset, demonstrating significant deviations from the theoretical distribution under test, such as a normal distribution. Histograms and QQ plots validated the normality in our tumor and control datasets (Fig. 1A). These visualizations indicated that the tumor sample was somewhat close to a normal distribution. Due to the non-normality observed, we applied the Mann-Whitney U test (a non-parametric test) along with the Welch t-test (a parametric test) using WRS2 library in R. Here, Welch t-test, t-value = −15.63 with p-value of 2.183e-24, felled outside the region of acceptance (±1.99) at a 95% confidence level, and the null hypothesis (
) was rejected.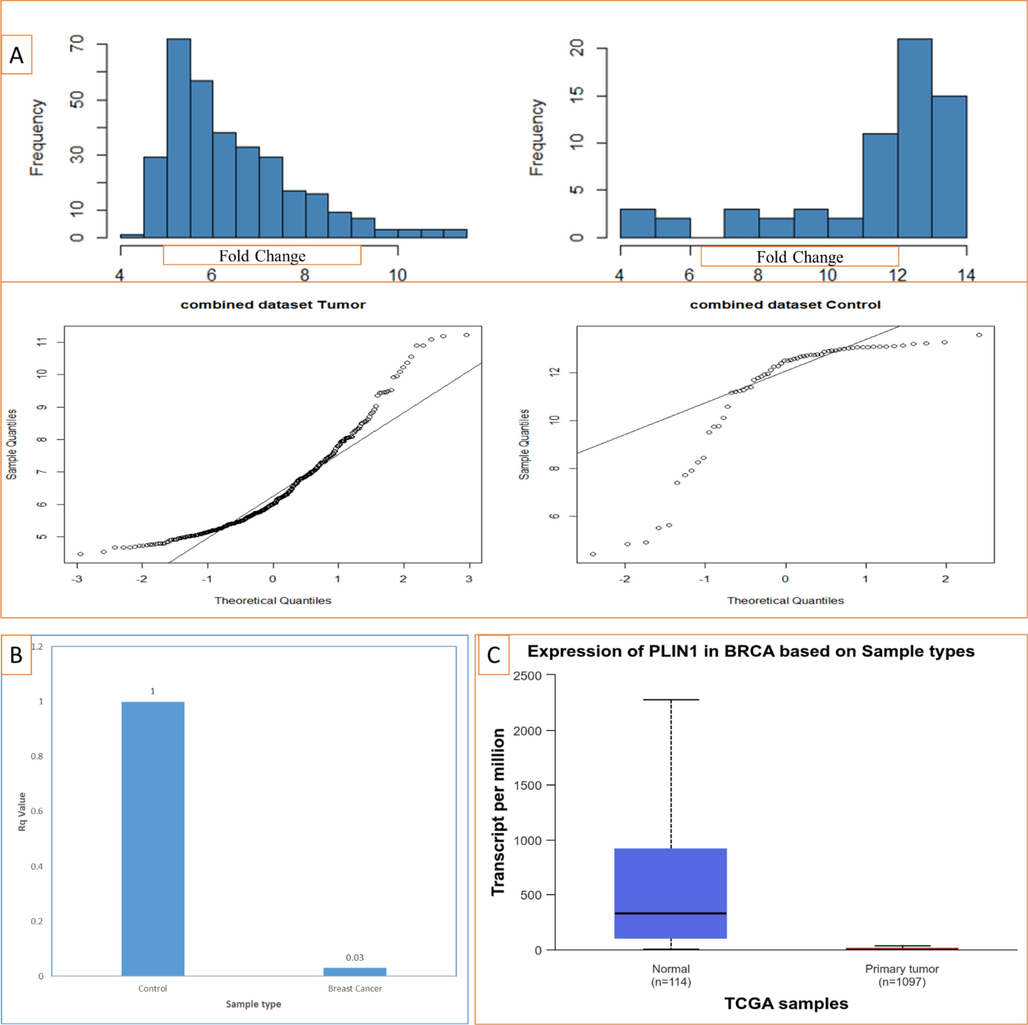
A. Normality check fr the assumption of Welch t-test for the tumor and control dataset using Histogram and QQ (Quantile-Quantile) plots, B. RTqPCR result showing down-expression of PLIN1 in breast cancer, C. RNA-Seq results from TCGA database at UALCAN portal also showing under-expression of PLIN1 in breast cancer.
3.3 Validation by RTqPCR
Validation of differentially expressed gene was performed by qPCR. PLIN1 was significantly under-expressed (Rq = 0.03, FC= − 29.22, p-value 1.55667E-10) and qPCR confirmed the microarray expression data in BC. Additionally, RNA-seq results also confirmed the significant under-expression of PLIN1 (transcript per million 2.267 and p value 1.1102E-16) on a bigger cohort (Fig. 1B and 1C).
3.4 Prognostic importance of PLIN1 gene in breast cancer
We conducted a Kaplan-Meier analysis for prognostic purposes to assess the impact of PLIN1 expression on the survival outcomes of BC patients, including relapse-free survival (RFS), overall survival (OS), distant metastasis-free survival (DMFS), and progression-free survival (PFS). The study unveiled PLIN1 as a potential and significant biomarker with therapeutic and prognostic using Benjamini-Hochberg technique and the log-rank p-value with 75% relevance (Table 1 and Fig. 2A). Survival types: relapse free survival (RFS), overall survival (OS), distant metastasis free survival (DMFS) and progression free survival (PPS).
mRNA (gene chip): PLIN1 Probes ID:205913 without restriction to subtype
Survival Type*
HR
CI
Log rank p value
Rank
Adjusted significance level (rank/m)*α(0.05)
Log rank p value less than adjusted significance level
Decision
RFS
0.78
0.7–––0.86
0.000001
1
0.013
TRUE
Significant
OS
0.76
0.63–0.92
0.0042
2
0.025
TRUE
Significant
DMFS
0.73
0.63–0.86
0.000076
3
0.038
TRUE
Significant
PPS
0.83
0.66–1.05
0.1243
4
0.05
FALSE
Insignificant
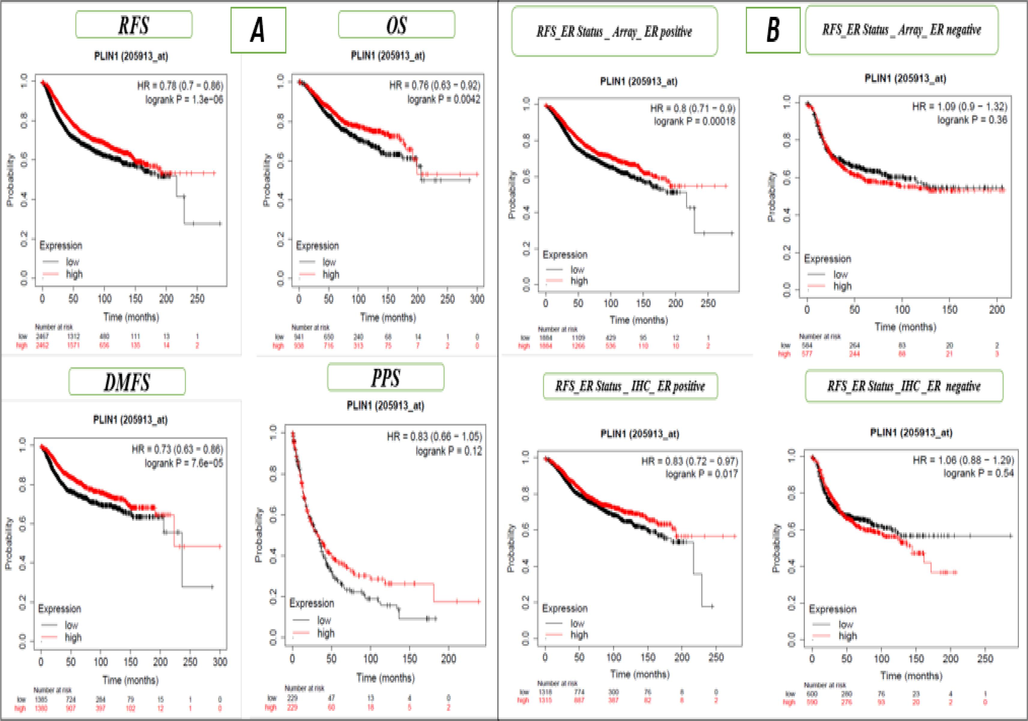
A. Kaplan–Meier (mRNA-gene chip) RFS, OS, DMFS and PPS for the PLIN1 gene without any restriction to subtypes, B. Kaplan–Meier (mRNA-gene chip) relapse-free survival for ER array and IHC ER status for the PLIN1 gene.
We evaluated the impact of PLIN1 gene expression RFS within various BC subtypes including ER array, ER IHC, PR, Lymph node status, HER2 status, luminal androgen receptor, Pietenpol subtypes (basal-like 1 & 2), immunomodulatory, StGallen subtypes (basal-like, HER2+, luminal A, and luminal B) mesenchymal, and mesenchymal stem-like, and observed four out of twenty cases exhibited significant associations, indicating moderate importance of the PLIN1 gene in BC (Supple Table 1 and Fig. 2B). In Fig. 2B, we have shown only the RFS ER status, indicating Array ER positivity and negativity, as well as RFS ER status determined through IHC positive and negative cases. We conducted prognostic survival analysis for OS under various BC subtypes and observed five out of the twenty samples exhibited significant results, indicating moderate importance of the PLIN1 gene in BC (Supple Table 1 and Fig. 3A). In Fig. 3A, we have shown only the OS ER status, indicating Array ER positivity and negativity, as well as OS ER status determined through IHC positive and negative cases. Moreover, we conducted additional assessments of the PLIN1 gene's impact on RFS using 31 independent GEO series and OS using 14 independent GEO series in BC, and observed 2 out of 31 GEO series exhibited significant associations with RFS (Supple Table 2 and Fig. 3B) and 1 out of 14 GEO series exhibited significant associations with OS (Supple Table 2 and Fig. 4A), confirming the significant and moderately predictive relevance of the PLIN1 gene in BC. In Fig. 3B, only RFS for the independent data series GSE1456, GSE2034, GSE2603, and GSE2990 are presented. In Fig. 4A, only OS for the independent data series GSE1456, GSE3494, GSE7390, and GSE16446 are shown. We utilized p-value integration techniques (wFisher, Lancaster, and Weighted Z-Methods) within the R library (metapro) to combine the individual p-values from 31 independent cohorts of RFS. The combined p-values were 0.0045 for Weighted Z-method, 0.0011 for Lancaster method and 0.00049 for wFisher method, strongly indicated a significant influence of PLIN1 gene expression on the survival of BC patients. Similarly, the meta-analysis conducted OS data from 14 independent cohorts, showed combined p- value of 0.0024 for the Weighted Z-method, 0.00209 for Lancaster method, and 0.0015 for the wFisher method, strongly indicated a significant influence of PLIN1 gene expression on the OS of BC patients. mRNA expression of the PLIN1 gene (RNA-seq) was used to conduct an evaluation of OS for BC subtypes and observed four out of thirteen cases exhibited significant associations, indicated moderate prognostic importance of the PLIN1 gene in BC (Supple Table 3 and Fig. 4B). In Fig. 4B, OS for only lymph node status for mRNA (RNA Seq) were shown, with positive and negative cases, as well as HER2 status for mRNA (RNA Seq), highlighting both positive and negative instances.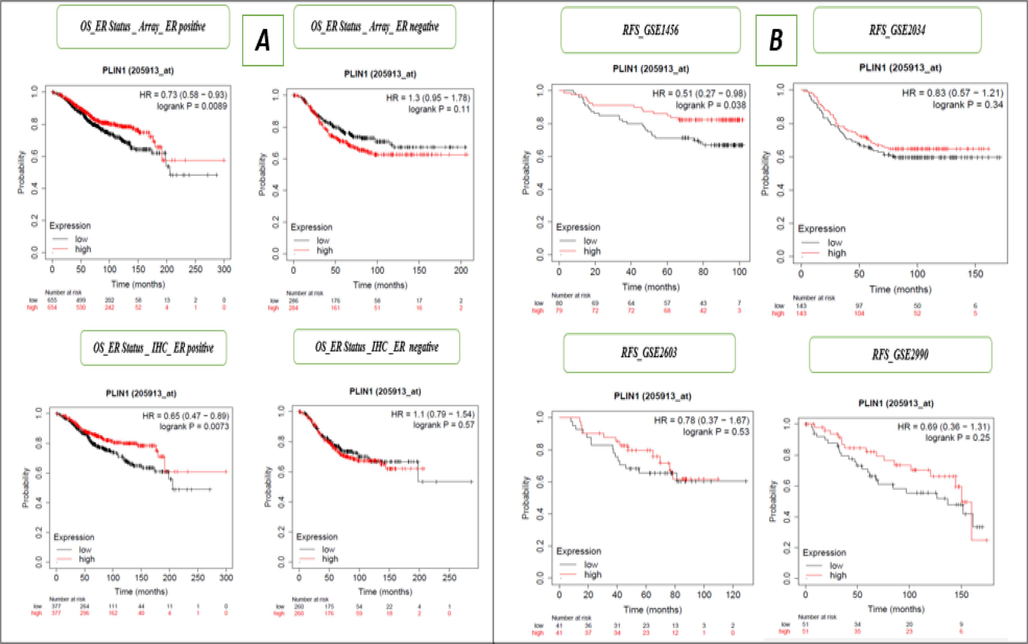
A. Kaplan–Meier overall survival (mRNA-gene chip) array and IHC ER status for the PLIN1 gene, B. Kaplan–Meier relapse-free survival (mRNA-gene chip) for individual datasets (GSE1456, GSE2034, GSE2603 and GSE2990) for the PLIN1 gene.
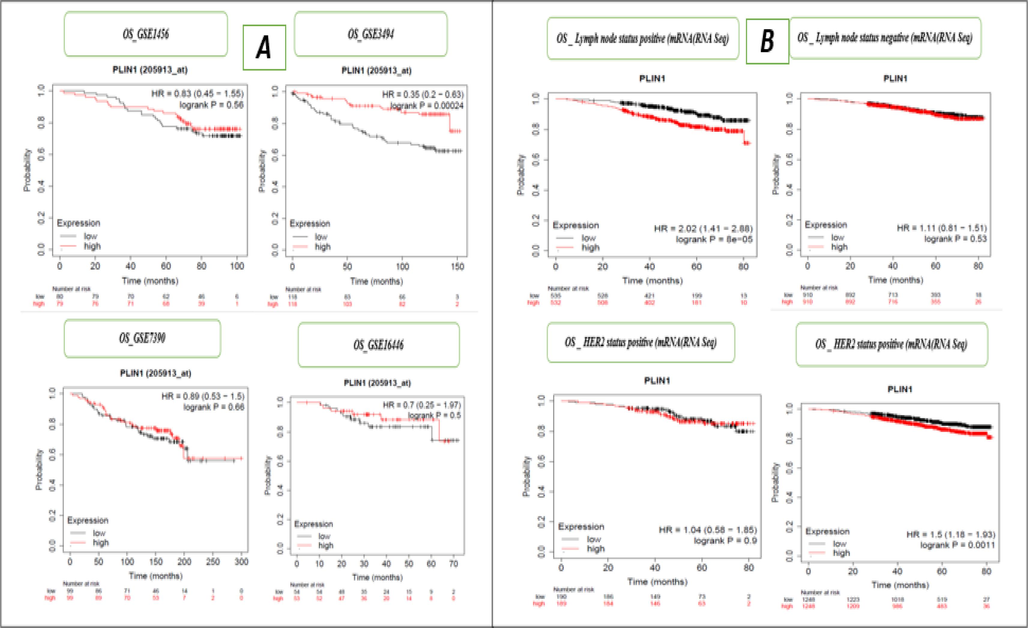
A. Kaplan–Meier overall survival (mRNA-gene chip) or individual datasets (GSE1456, GSE3494, GSE7390 and GSE16446) for the PLIN1 gene, B. Kaplan–Meier overall survival (mRNA-RNA Seq) for lymph node and HER2 status for the PLIN1 gene.
3.5 Treatment response to various therapies
We examined the relationship between PLIN1 gene expression and the response to various therapies in BC. Our investigation encompasses a wide spectrum of systematic therapies typically used in BC treatment such as tamoxifen and aromatase-inhibitors under endocrine therapy, trastuzumab and lapatinib under targeted anti-HER2 therapy, and taxane, anthracycline, and ixabepilone as chemotherapy. We employed two robust statistical methods: ROC analysis and Mann-Whitney tests and constructed box plots to illustrate the distinction between responders and non-responders across all the therapy types under investigation (Fig. 5). The key quantitative results of AUC, ROC, and Mann-Whitney test for PLIN1 gene had been recorded as treatment response outcomes (Tables 2). Here, anti-HER2 therapy with trastuzumab and chemotherapy with anthracycline exhibited exceptional efficacy in terms of the gene's ability to classify treatment responses, suggesting potential clinical utility for BC. Mann-Whitney U test had also revealed that the differences in PLIN1 gene expression between responders and non-responders in these two treatment groups were statistically significant (p-values <0.05), established significant association between PLIN1 gene expression and the effectiveness of these specific treatments.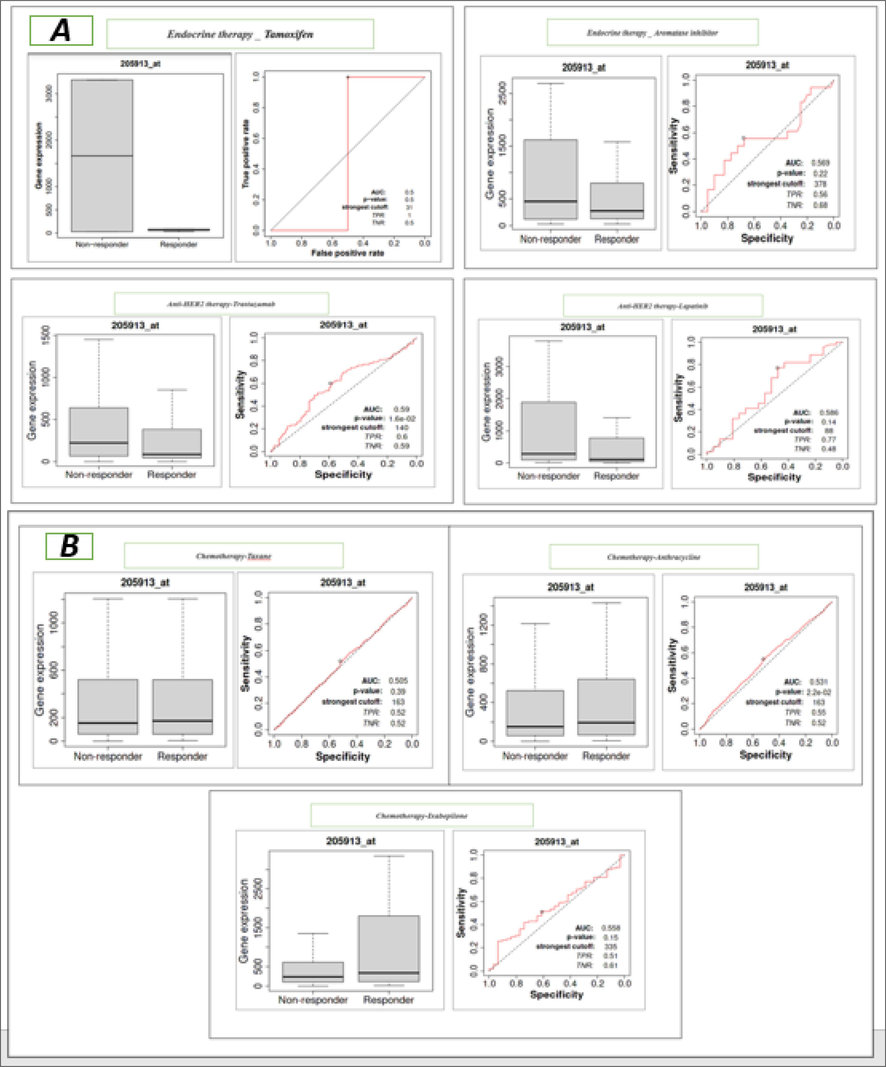
A. Visual representation of response to therapies (endocrine therapy by tamoxifen, aromatase inhibitor, and anti-HER2 therapy by trastuzumab and lapatinib) for number of responders, number of non-responders, AUC value, ROC p-value and Mann-Whitney test p-value, B. Visual representation of response to chemotherapies (Taxane, Anthracycline and Ixabepilone) for number of responders, number of non-responders, AUC value, ROC p-value and Mann-Whitney test p-value.
Inputs parameters
Endocrine therapy
Anti-HER2 therapy
Chemotherapy
Tamoxifen
Aromatase inhibitor
Trastuzumab
Lapatinib
Taxane
Ixabepilone
Anthracycline
Number of responders
5
40
87
21
371
105
528
Number of non-responders
2
18
99
44
842
31
1098
AUC pathological response
0.5
0.569
0.59
0.586
0.505
0.558
0.531
ROC p-value
0.5
0.22
0.016
0.14
0.39
0.15
0.022
Mann-Whitney test p-value
1
0.41
0.034
0.27
0.79
0.33
0.044
4 Discussion
The PLIN1 gene, primarily expressed in white adipose tissues, plays a role in hormone-induced lipolysis and large lipid droplets formation (Sztalryd & Kimmel, 2014). Studies have highlighted elevated PLIN1 expression in liposarcoma (a cancerous tumor of lipoblast) and its absence in lipoma (benign soft tissue lump) (Straub et al., 2019). The role of PLIN1 expression in BC is variable and under-investigation. The present study extensively examined the expression patterns and prognostic implications of the PLIN1 gene in BC.
Applying a trustworthy and accurate statistical approach for identifying substantially expressed genes is a crucial component of high-throughput microarray data processing. The variances of two sets of data cannot be expected to be homogenous with standard deviation ratio of 1:1 in statistical testing under actual conditions (Erceg-Hurn and Mirosevich, 2008). Variance ratios might range between 1.1 and 1.2 in the majority of studies, and their reasons are still not fully understood. We, therefore, used Welch's t-test to measure the expression of the PLIN1 gene in BC because it does not require to meet homoscedasticity requirement. Our results revealed significantly lower expression of PLIN1 (FC −30.76 and p value 2.15848E-10) in BC tissues compared to normal. Earlier studies have also reported low expression of PLIN1 in BC on sample size supporting out result (Karim et al., 2023; Zhou et al., 2016; Kim et al., 2015). Survival analysis indicated that PLIN1 expression was associated with relapse free survival (RFS) and overall survival (OS) in BC patients. Lower expression of PLIN1 indicated poor prognosis while high expression was associated with longer survival of BC patients (Zhang et al., 2021; Zhou et al., 2016). Conversely, Jung et al. linked high PLIN1 expression to shorter overall survival in metastatic breast cancer (Jung et al., 2015). Notably, Zhou et al. observed low PLIN1 expression predicting poorer metastatic relapse-free survival in ER-enriched and luminal-A subtypes (Zhou et al., 2016). Nevertheless, further studies are necessary to validate existing results (Zhou et al., 2016; Jung et al., 2015).
Survival analysis and predicting prognosis with PLIN1 expression was another dimension of this study. Unfortunately, censoring where patients either die from a disease other than the disease of interest or are lost to follow-up, can affect the survival curves if many people are censored at one time point (Leung et al., 1997). Usually, the average or median times (follow-up) approach was applied to address censoring issue (Machin et al. 2007). For survival analysis either a non-parametric approach where no assumptions are required on the hazard/survival rate or a parametric techniques for determining the variables effect on hazard/survival rate, such as demographic parameters, illness type, and therapy received are used such as Kaplan-Meier (KM) plotter and the Cox-proportional hazards model (CPHM) (Tseng et al., 2012; Evangelou & Ioannidis, 2013). CPHM is preferred to handle variable effects while KM plotter is preferred while analyzing time-to-event data in the field of cancer to estimate curves, and other crucial tables like overall comparisons (Etikan, 2017). We employed the KM plot as a confirmatory test, considering the positive or negative status of patient’s ER, PR, and LN to give the investigation a novel perspective.
Meta-analysis on several independent cohorts is done by statistical methods using “metapro” package of R to boost statistical power (Yoon et al., 2021; Whitlock, 2005). The weighted version of the Fisher's approach (wFisher) has stronger power as it assign specific weight to specific experimental circumstances or genetic differences used frequently in analyzing high-throughput microarray and RNA-seq data (Yoon et al., 2021).
Here wFisher, Lancaster, and Weighted Z-method were used for meta-analysis, and our findings clearly suggest the PLIN1 expression considerably impacted on BC patient’s survival.
The primary challenge in BC management is selection of drug(s), initiation of treatment and predicting therapeutic outcome, and this clinical decision is a crucial turning point that heavily depends on accurate and timely diagnosis. Presently, a fusion approach using conventional clinicopathological factors and molecular biomarkers, encompassing single-gene tests (ER, PR, HER2) and/or specialized gene signatures are used to improve diagnosis accuracy (Iqbal et al., 2023; Mirza et al., 2023; Karim et al, 2016; Merdad et al, 2015; Merdad et al, 2014).
Receiver operating characteristics (ROC) plotter and Mann-Whitney tests was used to extensively explore the response of various therapies in BC in relation to PLIN1 expression (Fekete & Győrffy, 2019). We found two drugs i.e trastuzumab and anthracycline exhibiting exceptional efficacy in terms of the PLIN1 gene's ability to classify treatment responses when investigated a wide spectrum of BC therapies including endocrine therapy with tamoxifen and aromatase inhibitors, anti-HER2 therapy with trastuzumab and lapatinib, and chemotherapy with taxane, anthracycline, and ixabepilone. Additionally, Mann-Whitney U test has revealed statistically significant differences in gene expression between responders and non-responders in trastuzumab and anthracycline treatment groups. Consequently, it can be inferred that the PLIN1 gene holds potential biomarker of intermediate significance in terms of BC.
Further, a breast cancer diagnosis, treatments and symptom management exerts a profound and enduring psychological impact on individuals. A follow-up of elevated rates of depression and anxiety persisting up to five years post-diagnosis is recommended to manage the emotional strain in BC patients (Blaes et al., 2023). The psychological effects on cancer patients vary throughout the diagnostic and treatment phases. Following a breast cancer diagnosis, individuals typically undergo elevated negative emotions, psychological distress, anxiety, depression, shock, denial, and subsequent stress and worry (Fortin et al., 2021; Compas & Luecken, 2002; Martino et al., 2021; Yang et al., 2017). Ignoring this aspect risks crucial elements influencing both the mental and physical well-being of BC patients.
5 Conclusion
The PLIN1 gene had significantly lower expression in BC tissues compared to normal. Survival analysis revealed the moderate importance of PLIN1 in predicting prognosis. Response to trastuzumab and anthracycline treatment showed an intermediate significance of PLIN1 in BC.
6 Disclosure of Funding
Institutional Fund Projects under grant no (IFPRC-125-141-2020) from Ministry of Education.
7 Data Availability
All the data is available in public domain (https://www.ncbi.nlm.nih.gov/geo/). Authors will provide additional information upon reasonable request.
CRediT authorship contribution statement
Sajjad Karim: Conceptualization, Funding acquisition, Data curation, Formal analysis, Investigation, Methodology, Software, Visualization, Supervision, Validation, Project administration, Resources, Writing – original draft. Md Shahid Iqbal: Data curation, Formal analysis, Investigation, Methodology, Software, Visualization, Writing – original draft. Fadwa Aljoud: Data curation, Formal analysis, Investigation, Methodology, Software, Visualization, Writing – review & editing. Najla Ali Alburae: Data curation, Formal analysis, Investigation, Methodology, Software, Visualization, Supervision, Validation, Writing – review & editing. Zoya Nisar: Data curation, Formal analysis, Investigation, Methodology, Software, Visualization, Writing – review & editing. Nofe Alganmi: Conceptualization, Funding acquisition, Project administration, Resources, Writing – review & editing. Haneen Banjar: Conceptualization, Funding acquisition, Project administration, Resources, Writing – review & editing. Zeenat Mirza: Conceptualization, Funding acquisition, Data curation, Formal analysis, Investigation, Methodology, Supervision, Validation, Project administration, Resources, Writing – original draft.
Acknowledgments
This research work was funded by Institutional Fund Projects under grant no (IFPRC-125-141-2020). Therefore, authors gratefully acknowledge technical and financial support from the Ministry of Education and King Abdulaziz University, Jeddah, Saudi Arabia.
Declaration of competing interest
The authors declare that they have no known competing financial interests or personal relationships that could have appeared to influence the work reported in this paper.
References
- Current and future burden of breast cancer: global statistics for 2020 and 2040. Breast. 2022;66:15-23.
- [Google Scholar]
- Baguley, T., 2012. Serious stats: A guide to advanced statistics for the behavioral sciences. Palgrave Macmillan 2012. [Online]. Available: https://books.google.fr/books?hl=fr&lr=&id=ObUcBQAAQBAJ&oi=fnd&pg=PP1&dq=baguley+2012&ots=-eiUlHiCYs&sig=YUUKZ7jiGF33wdo3WVO-8l-OUu8.
- Psychological measures of stress and biomarkers of inflammation, aging, and endothelial dysfunction in breast cancer survivors on aromatase inhibitors. Sci. Rep.. 2023;13(1)
- [CrossRef] [Google Scholar]
- Psychological adjustment to breast cancer. Curr. Dir. Psychol. Sci.. 2002;11(3):111-114.
- [CrossRef] [Google Scholar]
- Cadherins and Catenins in breast cancer. Curr. Opin. Cell Biol.. 2005;17(5):499-508.
- [CrossRef] [Google Scholar]
- Why psychologists should by default use Welch’s T-test instead of student’s T-test. Int. Rev. Soc. Psychol.. 2017;30(1):92-101.
- [CrossRef] [Google Scholar]
- Why Welch’s test is type I error robust. Quantit. Methods Psychol.. 2016;12(1):30-38.
- [CrossRef] [Google Scholar]
- Introduction to survival analysis in practice. Mach. Learn. Knowledge Extraction. 2019;1(3):1013-1038.
- [CrossRef] [Google Scholar]
- Modern robust statistical methods: an easy way to maximize the accuracy and power of your research. Am. Psychol.. 2008;63(7):591-601.
- [CrossRef] [Google Scholar]
- The Kaplan Meier estimate in survival analysis. Biometr. Biostatist. Int. J.. 2017;5(2)
- [CrossRef] [Google Scholar]
- Meta-analysis methods for genome-wide association studies and beyond. Nat. Rev. Genet.. 2013;14(6):379-389.
- [CrossRef] [Google Scholar]
- ROCplot.org: validating predictive biomarkers of chemotherapy/hormonal therapy/anti-her2 therapy using transcriptomic data of 3,104 breast cancer patients. Int. J. Cancer. 2019;145(11):3140-3151.
- [CrossRef] [Google Scholar]
- The mental health impacts of receiving a breast cancer diagnosis: a meta-analysis. Br. J. Cancer. 2021;125(11):1582-1592.
- [CrossRef] [Google Scholar]
- Gene expression and survival analysis study of KIAA0101 gene revealed its prognostic and diagnostic importance in breast cancer. Vegetos. 2023;36(1):249-258.
- [CrossRef] [Google Scholar]
- Expression of lipid metabolism-related proteins in metastatic breast cancer. PLoS One. 2015;10(9)
- [CrossRef] [Google Scholar]
- Development of “Biosearch System” for biobank management and storage of disease associated genetic information. J. King Saud Univ.—Sci.. 2022;34:101760
- [Google Scholar]
- Karim S*, Merdad A, Schulten HJ, Jaypal M, Dallol A, Buhmeida A, Al-Thubaity F, Mirza Z, Gari MA, Chaudhary AGA, Abuzenadah AM, Al-Qahtani MH. Low expression of leptin and its associated with breast cancer: A transcriptomics study. Oncology Reports, May 2016, 36(1): 43-48.
- Gene expression study of breast cancer using Welch Satterthwaite T-test, Kaplan-Meier estimator plot and Huber loss robust regression model. J. King Saud Univ. – Sci.. 2023;35(1):102447
- [CrossRef] [Google Scholar]
- Differential expression of lipid metabolism-related proteins in different breast cancer subtypes. PLoS One. 2015;10(3)
- [CrossRef] [Google Scholar]
- Web-based survival analysis tool tailored for medical research (kmplot): development and implementation. J. Med. Internet Res.. 2021;23(7)
- [CrossRef] [Google Scholar]
- Censoring issues in survival analysis. Annu. Rev. Public Health. 1997;18(1):83-104.
- [CrossRef] [Google Scholar]
- Machin, D., Cheung, Y. B., Parmar, M.K., 2007. Survival analysis: A practical approach, 2nd edition. Biometrics, 63(1), 306–307 10.1111/j.1541-0420.2007.00743_9.x.
- A review of psychological impact of breast cancer in women below 50 years old. Health Care Women Int.. 2021;42(7–9):1066-1085.
- [CrossRef] [Google Scholar]
- Merdad A, Karim S*, Schulten H, Dallol A, Buhmeida A, Al-Thubaity F, Gari MA, Chaudhary AGA, Abuzenadah A, Al-Qahtani MH. Expression of Matrix Metalloproteinases (MMPs) in Primary Human Breast Cancer: MMP-9 as a Potential Biomarker for Cancer Invasion and Metastasis. Anticancer Res. Mar 2014, 34(3): 1355-1366.
- Merdad A, Karim S*, Schulten H, Jaypal M, Dallol A, Buhmeida A, Al-Thubaity F, Gari MA, Chaudhary AGA, Abuzenadah A, Al-Qahtani MH. Transcriptomics profiling study of breast cancer from kingdom of Saudi Arabia revealed altered expression of adiponectin and fatty acid binding protein 4: Is lipid metabolism associated with breast cancer? BMC Genomics, Jan 2015, 16 (suppl 1): S11.
- Identification of novel diagnostic and prognostic gene signature biomarkers for breast cancer using artificial intelligence and machine learning assisted transcriptomics analysis. Cancers. 2023;15(12):3237.
- [CrossRef] [Google Scholar]
- Multiclass cancer diagnosis using tumor gene expression signatures. Proc. Natl. Acad. Sci. USA. 2001;98:15149-15154.
- [Google Scholar]
- The unequal variance T-test is an underused alternative to student’s t-test and the Mann–whitney U test. Behavioral Ecology. 2006;17(4):688-690.
- [CrossRef] [Google Scholar]
- Perilipin 1 expression differentiates liposarcoma from other types of soft tissue sarcoma. Am. J. Pathol.. 2019;189(8):1547-1558.
- [CrossRef] [Google Scholar]
- Global cancer statistics 2020: GLOBOCAN estimates of incidence and mortality worldwide for 36 cancers in 185 countries. CA Cancer J. Clin.. 2021;71:209-249.
- [Google Scholar]
- Perilipins: lipid droplet coat proteins adapted for tissue-specific energy storage and utilization, and lipid cytoprotection. Biochimie. 2014;96:96-101.
- [CrossRef] [Google Scholar]
- Comprehensive literature review and statistical considerations for microarray meta-analysis. Nucleic Acids Res.. 2012;40(9):3785-3799.
- [CrossRef] [Google Scholar]
- Combining probability from independent tests: the weighted Z-method is superior to Fisher’s approach. J. Evol. Biol.. 2005;18(5):1368-1373.
- [CrossRef] [Google Scholar]
- Time-dependent risk of depression, anxiety, and stress-related disorders in patients with invasive and in situ breast cancer. Int. J. Cancer. 2017;140:841-852.
- [CrossRef] [Google Scholar]
- Powerful P-value combination methods to detect incomplete association. Sci Rep 2021
- [CrossRef] [Google Scholar]
- Expression status and prognostic value of the perilipin family of genes in breast cancer. Am. J. Transl. Res. 2021
- [Google Scholar]
- Prognostic significance of PLIN1 expression in human breast cancer. Oncotarget. 2016;7(34):54488-54502.
- [CrossRef] [Google Scholar]
Appendix A
Supplementary material
Supplementary data to this article can be found online at https://doi.org/10.1016/j.jksus.2024.103161.
Appendix A
Supplementary material
The following are the Supplementary data to this article:


