

Translate this page into:
DFT investigation on the linear and nonlinear optical properties of the tautomers and derivatives of 2-aminobenzothiazole (ABT) in the gas phase and different solvents
⁎Corresponding author. nwazzan@kau.edu.sa (Nuha Wazzan)
-
Received: ,
Accepted: ,
This article was originally published by Elsevier and was migrated to Scientific Scholar after the change of Publisher.
Peer review under responsibility of King Saud University.
Abstract
This effort was performed to investigate the nonlinear optical (NLO) properties of 2-aminobenzothiazole (ABT) molecule at a sophisticated level of theory (DFT/CAM-B3LYP/6-311++G(d,p)). The study included the investigation of NLO properties of the three tautomeric forms of ABT in the gas and solvents of different polarities. The study extended to study the NLO properties of the most stable tautomeric form of ABT (T1ABT) substituted at position C3 with electron-donor/electron-acceptor groups. Additionally, the quantum chemical parameters of the three tautomeric forms in the gas and six solvents were calculated and analyzed.
Keywords
2-aminobenzothiazole
Nonlinear optical properties
Effect of solvent
Effect of substituents
Electron-donor groups
Electron-acceptor groups

1 Introduction
Heterocyclic compounds included Benzothiazole (BT) and its derivatives are essential constituents in several natural products and pharmaceutical agents (Keri, Patil, Patil, & Budagumpi, 2015). The skeleton of BT consists of a benzene ring fused with 4 and 5 positions of thiazole (Gill, Rawal, & Bariwal, 2015; Yadav, Devprakash, & Senthilkumar, 2011). The applications of BT derivatives are recorded as anti-tubercular agent, antimicrobial agent, antimalarial agent, anticonvulsant agent, anthelmintic agent, anti-inflammatory agent, antidiabetic agent, anticancer agent, amoebic, anthelmintic, antihypertensive, antiulcer, chemo-protective, antiparkinsonian and anti-diabetic activity (Azam & Suresh, 2012; Gill et al., 2015; Yadav et al., 2011).
In this work, one of the BT derivatives, i.e., 2-aminobenzothiazole (ABT) molecule, has been selected to undergo appropriate quantum chemical calculations. The structure of 2-aminobenzothiazole (ABT) molecule possesses two nitrogen atoms and one sulfur atom, which makes it chemically active. Fig. 1(a) shows the three tautomeric forms of ABT compound. In our previous work, DFT at B3LYP/6–311++G(d,p) level of theory was performed to investigate the geometrically, thermodynamically and kinetically, the tautomerism in 2-aminobenzothiazole (ABT) in the gas phase and six solvents with different polarities (Wazzan, Safi, Al-Barakati, Al-Qurashi, & Al-Khateeb, 2019). Three various tautomeric forms can be envisaged for ABT molecule, namely: ABT (amino form) (T1), trans-IBT (imino form) (T2), and cis-IBT (imino form) (T3), see Fig. 1 (a) and (b). A proton transfer occurs: first from N13 to N16 atoms leading to cis-IBT form and trans-IBT tautomers. The geometries of the envisioned tautomers of benzothiazole were optimized in the gas phase and solution with the polarized continuum model (PCM). In the present study, the effect of solvent polarity on the quantum chemical parameters (QCPs) that demonstrating the chemical reactivity of ABT tautomers and on their nonlinear optical (NLO) properties will be investigated. Besides, the most stable tautomeric form of ABT will be substituted at the C3 position with groups with different electron-donating/accepting abilities, Fig. 1 (b), and the NLO properties of these derivatives in the gas phase and the same six solvents will be investigated too.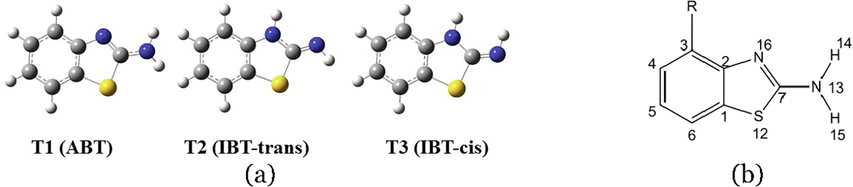
(a) Optimized geometrical structures of the ABT three tautomeric forms, and (b) Substituted T1 (ABT) at the C3 position.
2 Computational details
The three tautomeric forms of ABT molecule were fully optimized using the defaults options and without any contains at the DFT/B3LYP/6–311++G(d,p) level of theory (Becke, 1993; Lee, Yang, & Parr, 1988). The frequency calculations verified that the obtained geometries were minima points in the potential energy surface with zero imaginary frequencies. To mimic the effect of solvent, the SCRF keyword with Tomasi’s polarized continuum (PCM) model (Miertuš, Scrocco, & Tomasi, 1981; Miertus & Tomasi, 1982) in six solvents (carbon tetrachloride (CCl4), tetrahydrofuran (THF), ethanol, methanol, DMSO, and water) has been used. The quantum chemical parameters (QCPs) were calculated using the HOMO and LUMO energies (, ). The QCPs included the electronegativity , chemical harness chemical softness (, and electrophilicity index () are calculated using the equations detailed in (Geerlings, De Proft, & Langenaeker, 2003).
The conversion factor for HOMO and LUMO energies from the atomic unit (au) into electron volt (eV) units is . DFT calculations evaluate the NLO parameters at one of the long range-separated functionals, i.e., CAM-B3LYP with the same basis set. In the presence of an external electric field (), the energy of the system can be expressed by (Buckingham, 1967; Felscia, Rajkumar, & Mary, 2018):
Where is the energy of the unperturbed free molecule and is the energy of the molecule, and is the electric field. The average linear polarizability is calculated according to the equation:
The anisotropy of linear polarizability is calculated according to the equation:
The average second order hyperpolarizabilities is calculated according to the equation:
The total hyperpolarizability is calculated according to the equation:
The values are reported in atomic units (au), the conversion factors to the electrostatic units (esu) are: for, , for , , and for , . The Gaussian 09 W Program package was employed (Frisch et al., 2009). Chemcraft program (Adrienko, 2015) and gauss view 5 (Dennington, Keith, & Millam, 2009) were used to visualize the results. The Hirshfeld surfaces and 2D fingerprint plots were generated using Crystal Explorer 3.1 (M. J. Turner et al., 2017).
3 Results and discussion
3.1 Crystal structure and Hirshfeld surface analysis
The crystal structure of ABT is only available for the ABT in its most stable form, i.e., T1 (ABT) tautomeric form, the geometrical parameters included the bond lengths and bond angles and dihedrals are presented in the Supplementary Data Table SD 1. The Hirshfeld surface plot was calculated to quantify the intermolecular contacts present within the crystal structure of T1 (ABT) (Al-Wahaibi, Joubert, Blacque, Al-Shaalan, & El-Emam, 2019). The acceptor and donor atoms showing strong C-H…N intermolecular hydrogen bonds, this included the cyclic and acyclic nitrogen atoms and are indicated as bright red spots on the Hirshfeld surface Fig. 2. Also, a bright white spot on the Sulphur atom indicates medium C-H…S intermolecular hydrogen bond. Significant intermolecular interactions are mapped in Fig. 2. On the fingerprint plot, the H…H interactions appear as the largest region (39.7%) of the fingerprint plot, followed by the C–C interaction (3.7%), then the S-S interaction (0.3%) and the N-N interaction (0.1%).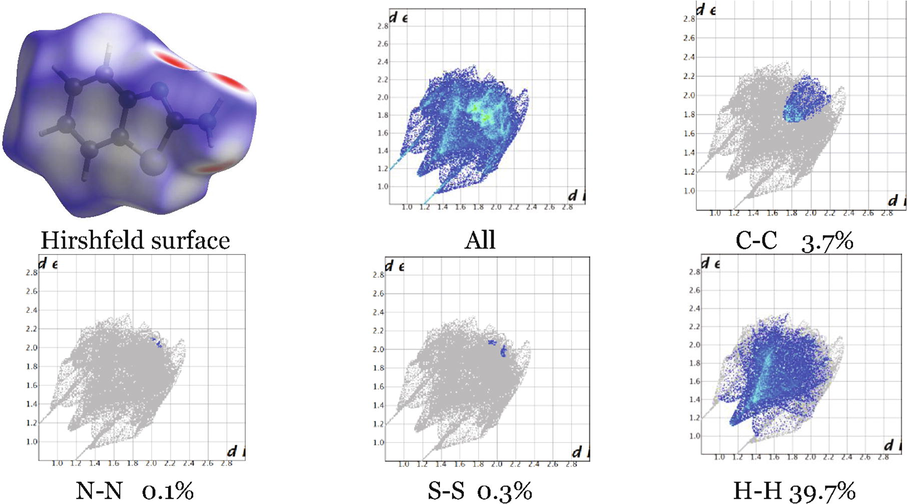
Hirshfeld surface showing the 2D interactions and Fingerprint plots showing the contributions of atoms within specific interacting pairs of T1 ABT crystal (blue areas). Note: for Hirshfeld surface, red colour indicates close proximity, white colour medium proximity and blue colour shows little proximity of outside atoms, for each fingerprint map, the grey area is a representation of the whole plot.
3.2 ABT tautomers
3.2.1 Quantum chemical parameters
Table SD1 listed the quantum chemical parameters (QCPs) of ABT in its three tautomeric forms in the gas phase and in six solvents of various polarities as calculated at the B3LYP/6–311++G(d,p) and PCM/B3LYP/6–311++G(d,p) levels of theory, respectively. The relationships between the dielectric constant () of the solvent and different QCPs are represented graphically in Fig. 2.
From Table SD1 and Fig. 2, the effect of solvation is apparent, since the electronegativity and hardness values of the three tautomers are much higher in different solvents compared to those values in the gas phase. The softness values-as the reciprocal of the hardness values- are higher in the gas phase than those in the solvent. The , , and values in the gas phase for the three tautomers are very comparable; the maximum differences are only equal to 0.04, 0.004, 0.001 eV, respectively. The solvent polarity showed a significant effect on the three calculated parameters. Since, T1 tautomer show much higher , and values, and much lower values compared to the values of the other two tautomers T2 and T3, and the QCPs of T2 and T3 in the six solvents are very comparable. For T2 and T3, as the solvent becomes more polar (with higher dielectric constant), the and values are becoming higher while values are becoming lower. For instance, for the tautomeric form T2, the maximum differences between the higher and lower values of , , and are equal to 0.016, 0.028, and 0.005 eV. The values of the QCPs for T1 are slightly affected due to the difference in the solvent polarity, since the maximum differences between the higher and lower values of , , and are equal 0.019, 0.032, and 0.005 eV, respectively. As well-known that acids and basis are associated with larger and smaller values, respectively. The flow of electrons between any two interacting species will be from the species with lower value to the species with higher value, in other words, the electron will be expected to transfer from a region of higher chemical potential to an area of lower chemical potential (Avcı, 2010). Accordingly, the acidity of three tautomers can be arranged as T1 > T2 T3.
3.2.2 Linear and nonlinear parameters
Because of the importance of nonlinear optic in many applications, it becomes a significant interest to a wide number of studies, both experimental and theoretical. Its application included using it in developing technologies such as telecommunications, optical interconnections, and signal processing (Altürk et al., 2017). One of the critical factors to strengthen the intramolecular charge transfer in a molecular system is the push–pull system, i.e., the molecular system with an electron-donor center in one side and electron-withdrawing center on the other side. In ABT in its three tautomeric forms (T1, T2, and T3), the amine group, the atom of nitrogen participates through its free electron pair in resonance, and the amine group plays the role of a donating group by conjugation. When it cannot join in conjugation through resonance, the amine group plays the role of the inductive electron-withdrawing group, because of the larger electronegativity of nitrogen atom compared to the carbon atom. When the amine group plays the role of the electron-donating group through conjugation, its inductive withdrawing effect (still present) is weaker and overcome by the first effect. In this section of this paper, an examination of linear, first- and second-order nonlinear optical (NLO) parameters of the three tautomeric forms of ABT compound was carried out to determine the role which is played by (1) different tautomeric forms, and (2) solvents with different polarities in strengthening the intramolecular charge transfer within the molecular system. Theoretical methods used to assist the experimental endeavors in designing excellent NLO compounds have been widely reported. We investigated the modification of nonlinear polarizability parameters of ABT compound in its three tautomeric forms (T1, T2, and T3) in the gas phase and in five solvents with various polarity (CCl4, THF, ethanol, methanol, DMSO, and water) for comparative purpose and for shedding light on their NLO parameters. It is a matter of the fact that the higher values of NLO parameters are qualifying the material for being used as a proper candidate as an active NLO one (Altürk et al., 2017).
The average linear polarizability (), the anisotropy of linear polarizability (), the average second-order hyperpolarizability , and total hyperpolarizability () for T1, T2, and T3 in the gas phase and in different solvents as calculated at the B3LYP/6–311++G(d,p) and PCM/CAM-B3LYP/6–311++G(d,p) levels of theory are collected in Table SD2 and represented graphically in Fig. 3. To evaluate these parameters, the same parameters were calculated in this study at the same level of theory for p-nitroaniline (pNA), it is an established example of a charge transfer compound with high hyperpolarizability. Therefore, pNA has been subjected to numerous amounts of high quality theoretical and experimental studies (Garza, Scuseria, Khan, & Asiri, 2013; Sim, Chin, Dupuis, & Rice, 1993). It will be used in an analytical study of the NLO parameters of the three investigated molecular systems.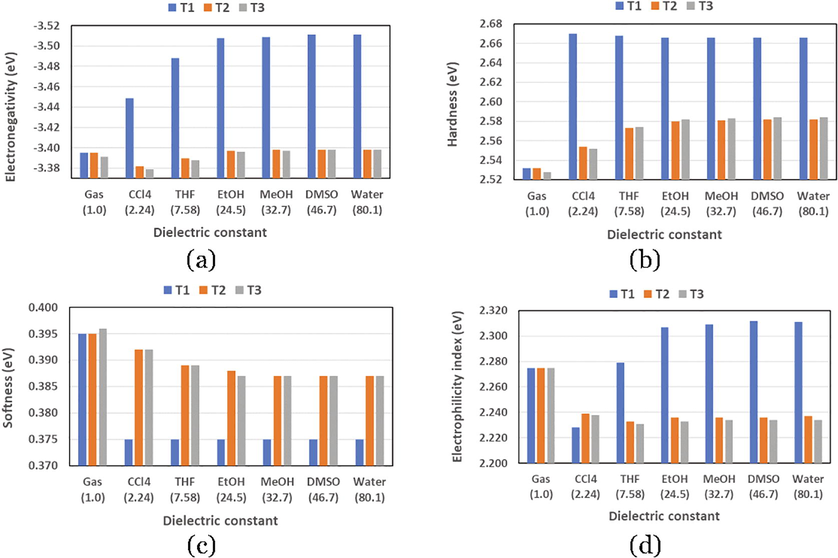
Graphical representations of the relationships between the solvent’s dielectric constant and (a) electronegativity, (b) hardness, (c) softness, and (d) electrophilicity index of the three tautomeric forms of ABT molecule.
The obtained values of the linear and nonlinear parameters of the three tautomeric forms of ABT are comparable with those of similar organic molecules, in which enhanced NLO properties were expected (Felscia et al., 2018; Lanke & Sekar, 2015). Comparing the linear and nonlinear parameters of the three tautomeric forms of ABT with those of the pNA reveals that in the gas phase and the six solvents, and values for the three tautomers are higher and lower, respectively. While and values are higher and lower in the gas phase and the different solvents, respectively. On the other hand, the linear and nonlinear parameters of three tautomeric forms and for each tautomeric form in different media are generally showing significant changes due to structural effect and medium polarity. The values for each tautomeric form in the six solvents are very similar; the maximum difference between the highest and lowest value is small and 0.03 esu, the difference is not significantly affected by medium polarity. The order of increasing the values is: T3 < T2 T1. On the other hand, the values for the three tautomers show a significant increase due to the medium polarity. In comparison with the values for the three tautomeric form, the values show significant change due to geometrical change. In each medium, the values increase in the order: T1 < T3 < T2. The values for each tautomeric form show similar trend, i.e., as the medium polarity increases as the value increases. However, the difference in these values is becoming insignificant in ethanol, methanol, DMSO, and water, since the difference not exceeding 0.01 esu, compared to significant difference upon changing the medium from gas to CCl4 to THF, since the difference reaches 0.45 esu between these values in the gas phase and THF. It is a matter of the fact that the second-order nonlinear optical properties initiated from the non-centrosymmetric configuration of NLO materials (Lanke & Sekar, 2015). The values upon changing the medium from gas to water are increasing in the following order: T3 < T2 < T1. On the other hand, the values show an inconsistent trend depending on the medium polarity, i.e., in the gas phase ( and CCL4 (), they are increasing in the order: T2 < T3 < T1, while in other solvents (), the order is: T3 < T2 < T1. We can conclude here that the change in ,, and values depends mainly on solvent polarity, during change in the values are more structural dependent. Generally, theand values for each tautomer are increasing as the solvent polarity increases, this could be rationalized by referring to the higher electron-donating group by conjugation of the amine group, which supports the creation of higher dipole and enhance the values ofand (More & Sekar, 2017).
The values of pNA are higher than those of three tautomeric forms, and they are 4 to 6 times greater than those of the tautomeric forms in different media. However, the obtained values of the three tautomeric forms are still large compared to other reported active NLO materials (Felscia et al., 2018; Lanke & Sekar, 2015), which confirms that there should be electronic charge transfer properties of the first excited state. This could be attributed to the planarity and rigidity of investigated tautomeric forms due to the fused aromatic phenyl and thiazole rings results in higher hyperpolarizability. We can say that the three tautomeric forms have considerable NLO properties.
In addition, Fig. 3 shows the difference in total electronic density between the ground and first excited states of T1, T2, and T3 tautomeric forms of ABT compound in water as calculated at the PCM/TDB3LYP/6–311++G(d,p) level of theory, similar density plots were obtained in the gas phase and other solvents. The three tautomeric forms exhibit considerable charge transfer in their excited states. Fig. 4 reveals that the electron density delocalization for T1 and T3 tautomers are quite similar, and the two plots show a significant difference compared to that of T2 tautomer.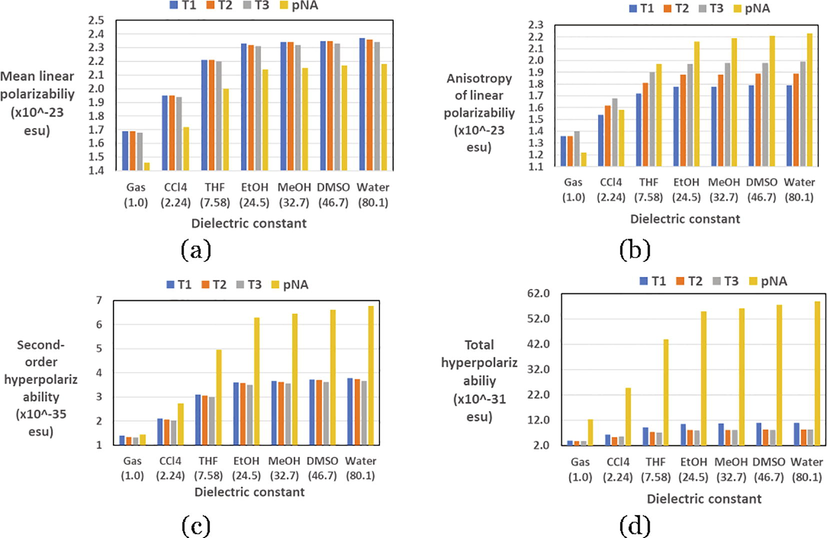
Graphical representations of the relationships between the solvent dielectric constant and linear and nonlinear polarizabilities included (a) average linear polarizability, (b) anisotropy of linear polarizability, (c) second-order hyperpolarizability, and (d) total hyperpolarizability of the three tautomeric forms of ABT molecule.
There is a considerable delocalization of the loss (green colored) and gained (yellow colored) charge across the phenyl and thiazole rings. A right amount of charge is transferred (loos) from the attached amine group and imine group (in the thiazole ring), these two regions appeared in green color. Besides, in T2 tautomer with the amine’s H atom in the trans position concerning thiazole ring, there is a large delocalization of charge transferred near the sulphur atom of the thiazole ring. The charge transfer pattern as evident from the electron density difference between the ground and first excited state can be used to explain the calculated larger values, however, it seems unable to justify the observed trend of increasing the values of the three tautomeric forms of ABT.
To justify the values and trends observed for the three tautomeric forms, the charge transfer (CT) indices between the ground and first excited state have been calculated in the gas phase (least polar medium) and water (largest polar medium) as representative examples of the surrounding media, the corresponding data are coll cted in Table 1. The CT indices of each tautomeric form show a significant change in different media (gas and water). Hence, the charge transfer pattern from the ground to the first excited state is greatly affected by the medium polarity.
Gas
Water
T1
0.335
0.023
0.312
0.994
0.333
0.789
0.044
0.745
0.614
0.484
T2
1.003
0.084
0.919
0.862
0.864
0.431
0.195
0.237
0.891
0.384
T3
0.879
0.212
0.667
0.898
0.789
0.461
0.004
0.458
0.989
0.456
The calculated values of CT distance () are listed in Table 1, is the difference between the centre of the negative charge distribution and the positive charge distribution, and plots of the two centroids is shown in Fig. 5. The order of increasing the values in the gas phase is: T1 < T3 < T2, and in water solvent it is: T2 < T3 < T1. A larger value of means that the two centroids are separated with a specific distance, while a smaller value of means that the two centroids are almost at the same place (Ali & Allam, 2018). The charge density is almost distributed over the whole molecular frame of three tautomers. However, a notice on the charge density distribution on T1 in water medium is worth to be mentioned, since the negative charge (purple color) show larger distribution on most parts of T1 molecule than the positive region (cyan color), this can justify the larger value of this tautomer in water Fig. 6.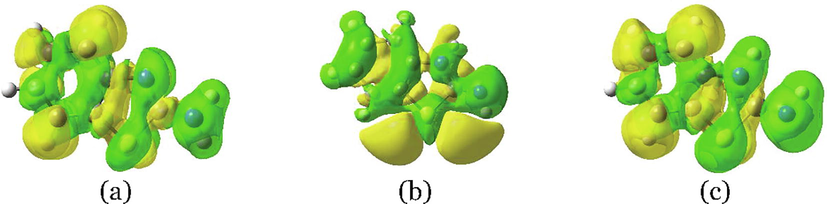
Difference in total electronic density (isocontour value of 0.0004 au) between the ground and first excited states of ABT in its three tautomeric forms (a) T1, (b) T2, and (c) T3 in water solvent. Note: yellow (green) regions indicate a gain (loss) of density in the excited state.
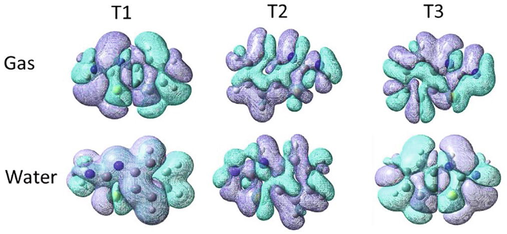
Demonstration of centroids of charge (, isovalue 0.0004 au) of the three tautomeric forms in the gas phase and water solvent. Note: cyan color for , and purple colour for .
The amount of charge transfer () values are greater than 0.8 e (except the value for T1 in water), indicting an efficient charge transfer process (Ali & Allam, 2018; Andijani & Wazzan, 2018). The order of increasing the values in the gas phase is: T2 < T3 < T1, while in the gas phase it is: T1 < T2 < T3. Note that the index indicates the charge transfer only along the -axis, For the three tautomeric forms, , thus no overlap between the centroids along this axis and a through-space charge transfer are expected (Le Bahers et al., 2011). The difference between the and indices is representing by the index. The obtained values for the three tautomeric forms in the gas phase and water are smaller than 1.6 Å, which indicates the accuracy of the calculation of the charge transfer descriptors. The obtained dipole moment difference between the ground state and the excited state is , which is the product of multiplying by . The order of increasing the values are: T1 < T3 < T2, and T2 < T3 < T1 in the gas phase and water, respectively.
3.3 T1ABT derivatives
To study the effect of substitution with electron donor/acceptor character on the NLO properties of the most stable tautomeric form of ABT molecule (T1), position C3 of T1ABT is substituted with six groups, denoted by − R symbol in Fig. 1 (b). The six different substituent groups introduced at this position are − CF3, −NO2, −CN as electron-donor groups, and − C2H5, −OH, −NH2 as electron-acceptor groups.
3.3.1 Linear and nonlinear parameters
In this section of this paper, an examination of linear, first- and second order NLO parameters of the derivatives of the most stable T1ABT tautomer was carried out to determine the role which is played by different substituent groups in strengthening the intramolecular charge transfer within the molecular system. The , , , and for the six derivatives of T1ABT in the gas phase and different solvents as calculated at the CAM-B3LYP/6–311++G(d,p) and PCM/CAM-B3LYP/6–311++G(d,p) levels of theory are collected in Table 2 and illustration graphically in Figure SD1.
Parameter
Substituent
Gas(1.0)
CCl4(2.24)
THF(7.58)
EtOH (24.5)
MeOH (32.7)
DMSO(46.7)
H2O(80.1)
−C2H5
2.06
2.37
2.68
2.81
2.52
2.84
2.86
−CF3
1.88
2.16
2.44
2.56
2.32
2.59
2.60
−CN
1.96
2.27
2.57
2.71
2.50
2.74
2.75
−NH2
1.85
2.14
2.43
2.56
2.32
2.59
2.60
−NO2
1.97
2.29
2.63
2.78
2.68
2.82
2.83
−OH
1.77
2.03
2.30
2.41
2.18
2.44
2.45
−C2H5
1.36
1.62
1.79
1.84
1.87
1.85
1.85
−CF3
1.31
1.58
1.78
1.85
1.88
1.86
1.86
−CN
1.45
1.75
1.99
2.07
2.11
2.09
2.09
−NH2
1.31
1.56
1.75
1.80
1.83
1.81
1.82
−NO2
1.45
1.78
2.08
2.19
2.45
2.22
2.23
−OH
1.32
1.56
1.74
1.80
1.81
1.81
1.81
−C2H5
1.69
2.53
3.68
4.30
4.38
4.45
4.53
−CF3
1.30
2.01
3.00
3.52
3.59
3.65
3.71
−CN
1.52
2.40
3.64
4.30
4.38
4.46
4.54
−NH2
1.62
2.45
3.61
4.22
4.30
4.37
4.44
−NO2
1.61
2.75
4.59
5.64
5.77
5.90
6.03
−OH
1.28
2.13
3.10
3.61
3.67
3.73
3.79
−C2H5
3.94
6.38
9.37
10.78
10.94
11.11
11.27
−CF3
4.77
7.72
11.40
13.07
13.27
13.47
13.65
−CN
5.01
8.54
13.00
15.21
15.46
15.71
15.94
−NH2
4.23
6.79
9.97
11.47
11.65
11.82
12.00
−NO2
5.73
11.25
19.80
24.55
25.13
25.72
25.98
−OH
4.57
6.98
9.72
10.92
11.05
11.18
11.31
From Table 2 and Figure SD1, the of six derivatives are increasing along with the increasing polarity of media except in methanol is less than those of ethanol and DMSO about 0.10–0.29 and 0.14–0.32 esu, respectively. The order of increasing the is: −OH < − NH2 ≤ − CF3 < − CN < − NO2 ≤ − C2H5, except for − NO2 in methanol solvent, is slightly higher than that of − C2H5 about 0.16 esu. As the , the shows similar trend of increasing values as the media become more polar with significant change in methanol solvent in comparison with other media, see Figure SD1. in all media are increasing as following order: −OH ≤ − NH2 ≤ − CF3 ≤ − C2H5 < − CN ≤ − NO2. On the other side, the of the six derivatives have much lower values in the gas phase and non-polar solvent (CCl4) compere with those in media with polar solvents (THF, ethanol, methanol, DMSO, water). In the gas phase the order of increasing is − OH < − CF3 < − CN < − NO2 < − NH2 < − C2H5, while in CCl4 solvent is: −CF3 < − OH < − CN < − NH2 < − C2H5 < − NO2. However, a media in polar solvents has a near trend in which the order is increasing as − CF3 < − OH < − NH2 < − CN − C2H5 ≤ − NO2. It is worth being mentioned the − NO2 has higher in all solvents in the range of 2.75–6.03 esu. The similar trend is observed for , i.e. shows a significant increase with increase medium polarity (gas and CCl4) and increasing medium polarity (THF, ethanol, methanol, DMSO, water) as can be noted from Figure SD1. In the gas phase and CCl4 solvent, the order of increasing the values of the six derivatives is: −C2H5 < − NH2 < − OH < − CF3 < − CN < − NO2. On the other hand, the order in media with higher polarity shows a near which increasing as: −C2H5 < − OH < − NH2 < − CF3 < − CN < − NO2. Generally speaking, the electron-donor and electron-acceptor groups have no regular effect on the NLO properties of the most stable tautomer of ABT (T1ABT tautomer).
4 Conclusions
The , , and values in the gas phase for the three tautomers are very comparable. In the six solvents, T1 tautomer show much higher , and values, and much lower values compared to the values of the other two tautomers.
According to the calculated values, the acidity of three tautomers can be arranged as T1 > T2 T3.
The change in ,, and values depends mainly on solvent polarity, while the change in the values are more structural dependent.
The values of pNA are 4-to-6 times greater than those of the tautomeric forms in different media.
The values of the three tautomeric forms are still large compared to other reported active NLO materials.
The substitution at the C3 position with the electron-donor or electron-acceptor groups has no regular effect on the NLO properties of the most stable tautomer of ABT (T1ABT tautomer).
Acknowledgments
This project was funded by the Deanship of Scientific Research (DSR), King Abdulaziz University, Jeddah, under grant No. (130 - 243 - D1441), the authors, therefore, gratefully acknowledge DSR technical and financial support. The authors acknowledge King Abdulaziz University’s High-Performance Computing Centre (Aziz Supercomputer) (http://hpc.kau.edu.sa) for supporting the computation for the work described in this paper.
Declaration of Competing Interest
The authors declare that they have no known competing financial interests or personal relationships that could have appeared to influence the work reported in this paper.
References
- Adrienko, GA. (2015). Chemcraft, 1.8 (build 445).
- Crystal structure, hirshfeld surface analysis and dft studies of 5-(adamantan-1-yl)-3-[(4-chlorobenzyl)sulfanyl]-4-methyl-4h-1,2,4-triazole, a potential 11β-hsd1 inhibitor. Sci. Rep.. 2019;9(1):19745.
- [CrossRef] [Google Scholar]
- Propping the optical and electronic properties of potential photo-sensitizers with different π-spacers: Td-dft insights. Spectrochim. Acta Part A Mol. Biomol. Spectrosc.. 2018;188:237-243.
- [CrossRef] [Google Scholar]
- Conformational, spectroscopic and nonlinear optical investigations on 1-(4-chlorophenyl)-3-(4-chlorophenyl)-2-propen-1-one: A dft study. [journal article] Indian J. Phys.. 2017;91(5):501-511.
- [CrossRef] [Google Scholar]
- The effect of electron-donating substituents on tuning the nonlinear optical properties of pyrene-core arylamine derivatives: Dft calculations. Results Phys.. 2018;11:605-616.
- [CrossRef] [Google Scholar]
- The consistency analysis of different semiempirical calculations on second- and third-order nonlinear optical properties of donor–acceptor chromophores containing α-cyan. Spectrochim. Acta Part A Mol. Biomol. Spectrosc.. 2010;77(3):665-672.
- [CrossRef] [Google Scholar]
- Biological activities of 2-mercaptobenzothiazole derivatives: A review. Sci. Pharm.. 2012;80(4):789-823.
- [CrossRef] [Google Scholar]
- Becke, AD. (1993). Ad becke, j. Chem. Phys. 98, 5648 (1993). J. Chem. Phys., 98, 5648.
- Permanent and induced molecular moments and long-range intermolecular forces. Adv. Chem. Phys.. 1967;12:107-142.
- [Google Scholar]
- Gaussview, version 5. Shawnee Mission, KS: Semichem Inc.; 2009.
- Theoretical investigations on nonlinear fused 4-ring systems: Application to oled and nlo devices. Synth. Met.. 2018;246:31-38.
- [CrossRef] [Google Scholar]
- Gaussian 09, g09w®. Wallingford, USA: Gaussian Inc.; 2009.
- Assessment of long-range corrected functionals for the prediction of non-linear optical properties of organic materials. Chem. Phys. Lett.. 2013;575:122-125.
- [CrossRef] [Google Scholar]
- Conceptual density functional theory. Chem. Rev.. 2003;103(5):1793-1874.
- [CrossRef] [Google Scholar]
- Recent advances in the chemistry and biology of benzothiazoles. Arch. Pharm.. 2015;348(3):155-178.
- [CrossRef] [Google Scholar]
- A comprehensive review in current developments of benzothiazole-based molecules in medicinal chemistry. European Journal of Medicinal Chemistry, 89(Supplement. 2015;C):207-251.
- [CrossRef] [Google Scholar]
- Rigid coumarins: A complete dft, td-dft and non linear optical property study. [journal article] Journal of Fluorescence. 2015;25(5):1469-1480.
- [CrossRef] [Google Scholar]
- Le Bahers, Tangui, Adamo, Carlo, & Ciofini, Ilaria. (2011). A qualitative index of spatial extent in charge-transfer excitations. Journal of Chemical Theory and Computation, 7(8), 2498-2506. doi: 10.1021/ct200308m.
- Development of the colle-salvetti correlation-energy formula into a functional of the electron density. Physical review B. 1988;37(2):785.
- [Google Scholar]
- M. J. Turner, J. J. McKinnon, S. K. Wolff, D. J. Grimwood, P. R. Spackman, D. Jayatilaka and M. A. Spackman. (2017). Crystalexplorer17 University of Western Australia.
- Electrostatic interaction of a solute with a continuum. A direct utilizaion of ab initio molecular potentials for the prevision of solvent effects. Chem. Phys.. 1981;55(1):117-129.
- [Google Scholar]
- Approximate evaluations of the electrostatic free energy and internal energy changes in solution processes. Chem. Phys.. 1982;65(2):239-245.
- [Google Scholar]
- Nonlinear optical properties of pyrene based fluorescent hemicurcuminoid and their bf2 complexes –spectroscopic and dft studies. [journal article] Journal of Fluorescence. 2017;27(5):1777-1792.
- [CrossRef] [Google Scholar]
- Electron correlation effects in hyperpolarizabilities of p-nitroaniline. The Journal of Physical Chemistry. 1993;97(6):1158-1163.
- [CrossRef] [Google Scholar]
- Dft investigation on the intramolecular and intermolecular proton transfer processes in 2-aminobenzothiazole (abt) in the gas phase and in different solvents. [journal article] Struct. Chem. 2019
- [CrossRef] [Google Scholar]
- Benzothiazole: Different methods of synthesis and diverse biological activities. ChemInform. 2011;42(40):no.
- [Google Scholar]
Appendix A
Supplementary data
Supplementary data to this article can be found online at https://doi.org/10.1016/j.jksus.2020.06.005.
Appendix A
Supplementary data
The following are the Supplementary data to this article:


