

Translate this page into:
Development of prediction model for body weight and energy balance indicators from milk traits in lactating dairy cows based on deep neural networks
⁎Corresponding author. nagjin@jbnu.ac.kr (Nag-Jin Choi)
-
Received: ,
Accepted: ,
This article was originally published by Elsevier and was migrated to Scientific Scholar after the change of Publisher.
Abstract
To develop a body weight (BW) prediction model using milk production traits and present a useful indicator for energy balance (EB) evaluation in dairy cows. Data were collected from 30 Holstein cows using an automatic milking system. BW prediction models were developed using multiple linear regression (MLR), local regression (LOESS), and deep neural networks (DNN). Milk production traits readily available on commercial dairy farms, such as energy-corrected milk (ECM), fat-to-protein ratio, days in milk (DIM), and parity, were used as input variables for BW prediction. The EB was evaluated as the difference between energy intake and energy demand. The DNN model showed the greatest predictive accuracy for BW compared with the LOESS and MLR models. The BW predicted using the DNN model was used to calculate the energy demand. Our results revealed that the day on which the EB status transitioned from negative to positive differed among cows. The cows were assigned to one of the three EB index groups. EB index 1 indicated that the day of EB transition was within DIM ≤ 70. The EB indexes 2 and 3 were 70 < DIM ≤ 140 and 140 < DIM ≤ 305, respectively. EB index 3 had the lowest EB, which is the slowest to transition from a negative to a positive energy balance compared with EB indexes 1 and 2. The highest ECM and feed efficiency were observed for EB index 3. The calving interval was the shortest for EB index 1. EB of individual cows during lactation can be estimated and monitored with moderately high accuracy using EB indexes.
Keywords
Body weight
Deep neural networks
Energy balance
Energy corrected milk

1 Introduction
The monitoring of the energy balance (EB) of high-yielding dairy cows during the lactation period is important (Nigussie, 2018) because it is directly related to milk production and reproductive performance (Heuer et al., 2001) and, ultimately, the profitability of dairy enterprises. Several methods have been proposed to estimate EB using body weight (BW) changes, body condition scores (Friggens et al., 2007), and analysis of metabolites in blood and milk (Moore et al., 2005). However, these methods are difficult to apply to large herds (Alvarez et al., 2018), making monitoring of the individual EB of cows in the field challenging. EB can also be evaluated as the difference between the measured energy intake (feed intake) and demand (milk production and maintenance); however, this requires measurements of milk yield and composition, BW, dry matter intake (DMI), and energy density of feedstuff (Mäntysaari and Mäntysaari, 2015), which are not broadly available on commercial farms (Yan et al., 2009).
Recording the daily BW, milk yield, and milk composition is possible through modern automatic milking systems (Mäntysaari and Mäntysaari, 2015). Although data from these automatic milking systems is used in modeling studies to predict and evaluate BW, DMI, EB, and milk yield (Caixeta et al., 2015), to date, these models require very detailed information, which has limited their adoption in commercial dairy farms (Vanrobays et al., 2015). Additionally, a range of other factors, such as the stage of lactation, parity, and a cow’s individual characteristics, which also need to be considered by the prediction model, affect BW and EB.
Multiple linear regression (MLR) is one of the most widely used modeling approaches for agricultural applications (Basak et al., 2020a). Although it is a powerful modeling technique, it assumes that the relationship between independent and dependent variables is linear. This assumption of linearity may not always be correct, and can lead to biased results that fail to provide satisfactory prediction accuracy (Chen et al., 2022). Alternatively, local regression (LOESS), which is a nonparametric local regression model for performing nonlinear predictions, is used to address this limitation (Shamim et al., 2016).
Recently, machine learning algorithms, such as artificial neural networks or deep neural networks (DNN), have become popular as powerful learning methods that are particularly beneficial for modeling nonlinear and complex relationships between variables (Chen et al., 2022). A DNN, which is an extension of an artificial neural network, tends to outperform the latter in direct comparisons using the same dataset (e.g., Guo et al., 2021). Further, DNN models also have better predictive performance than traditional methods (Ruchay et al., 2021). DNN models have been used in studies of dairy cows, including the estimation of body condition scores and BW through image processing, animal identification, breeding classification, and heat detection (Chowdhury et al., 2016; Shen et al., 2020).
In this study, we compared the prediction accuracy of BW using three different models based on MLR, LOESS, and DNN and presented a decision-making support system to evaluate daily EB for individual cows. Automatic milking systems were used to record the daily BW and milk yield during the lactation period. Additional information readily available on commercial dairy farms, such as milk traits, days in milk (DIM), and parity was also included in the models.
2 Material and methods
2.1 Data collection and preprocessing
Data from 30 Holstein cows (61 ± 16.4 months old; 726 ± 53.6 kg BW) were collected from a commercial dairy farm located in Gimcheon, Korea, between February and November 2022. All the cows were housed in free-stall facilities and milked using an automatic milking system (Lely, Astronaut). The cows were fed a total mixed ration (TMR) of flaked corn, corn silage, cottonseed meal, timothy, tall fescue, and alfalfa, which comprised 61.8 % dry matter (% as-fed), 16.7 % crude protein, 59.8 % total digestible nutrients, 50.4 % neutral detergent fiber, and 5.61 MJ of net energy/kg of dry matter. The TMR was fed ad libitum daily at 09:00 and 16:00 h. Individual TMR intake was recorded using an automatic feeding system equipped with a radiofrequency identification system (Dawoon Co., Incheon, Korea). Each feed bunk had a real-time electronic system that recognized cows using their tags. The feed consumption per visit was measured before and after weighing. The TMR intake was the sum of the per-visit consumed feed amounts in 24 h. The following data were obtained from the automatic milking system: individual identification number, parity, test date (representing daily data), daily BW, milk yield, milk components (protein, fat, lactose, and somatic cell count), and milking frequency. DIM records were collected between days 10 and 305. After excluding outliers, 1,745 records were used for the analysis. The descriptive statistics of the entire dataset are provided in Table 1. The numerical variables in the training and test data were scaled, that is, normalized (Walls et al., 2020). For normalization, the min–max normalization technique (Chen et al., 2022) was used for a period of DIM 10–305 for every cow using the following equation:
Milk fat-to-protein ratio = milk fat (%)/milk protein (%). Feed efficiency = energy corrected milk (kg/d)/dry matter intake (kg/d).
Variables
Mean
SD
Median
Min
Max
Days in milk (d)
170.79
81.38
180.00
10.00
305.00
Parity
2.81
1.13
3.00
1.00
6.00
Energy corrected milk (kg/d)
37.36
6.05
37.07
21.75
59.67
Fat protein corrected milk (kg/d)
34.56
5.58
34.30
20.01
55.02
Milk fat-to-protein ratio
1.23
0.27
1.23
0.50
1.97
Milk yield (kg/d)
36.26
6.26
35.80
18.30
54.70
Milk fat (%)
3.75
0.66
3.81
1.85
5.23
Milk protein (%)
3.10
0.29
3.08
2.41
4.10
Body weight (kg/d)
730.30
58.63
731.00
587.00
861.00
Energy balance (MJ of NEL)
25.64
38.75
25.30
−104.76
136.83
Energy intake (MJ of NEL)
177.00
43.04
175.03
64.80
301.26
Energy demand (MJ of NEL)
151.36
19.70
150.32
97.44
228.01
Dry matter intake (kg/d)
31.55
7.67
31.20
11.55
53.70
Feed efficiency
1.24
0.34
1.17
0.66
3.66
2.2 Input variable selection
In each modeling method, the selection of input variables plays a crucial role in determining a suitable model structure (Basak et al., 2020b). In the present study, principal component analysis was conducted to identify the main variables in the automatic milking system data (Fig. 1).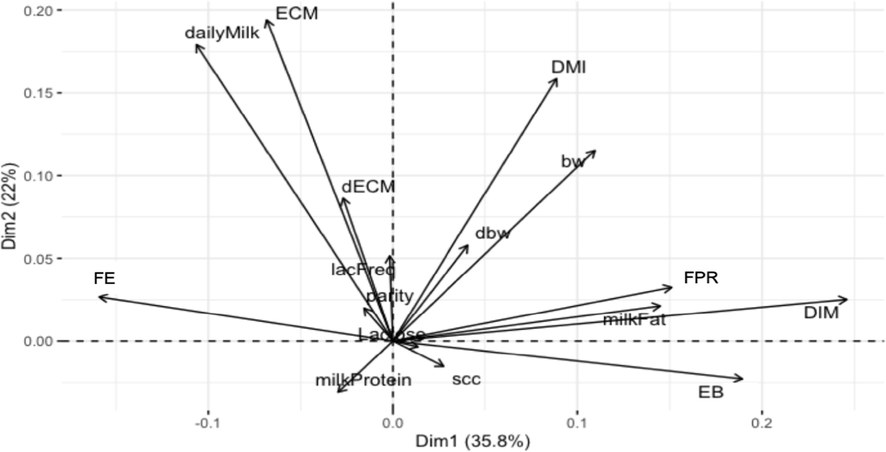
Milk production variables in the first and second principal components. DIM, days in milk; DMI, dry matter intake; EB, energy balance; ECM, energy corrected milk; FE, feed efficiency; FPR, milk fat-to-protein ratio; SCC, somatic cell counts.
From these, energy-corrected milk (ECM), DIM, fat-to-protein ratio, and parity, which are readily available on commercial dairy farms, were selected as input variables for all models. ECM provides a more precise representation of cows' energy output compared to milk yield alone, as it accounts for milk yield adjusted to the ratio of milk solids (Knob et al., 2021). The lactation phase, parity, milk production, and fat-to-protein ratio exhibit significant predictability for EB (Heuer et al., 2000). The ECM (Shirley, 2006) and fat-to-protein ratios (Lee et al., 2017) were calculated as follows:
2.3 Model evaluation
We used three models (MLR, LOESS, and DNN) to predict the BW of cows. MLR is a widely utilized modeling technique in diverse animal science applications (Chen et al., 2022). The MLR equation is as follows:
LOESS is a nonparametric local regression model that fits curves and surfaces to data by smoothing (Bruhns et al., 2005) and is often used as an alternative technique for performing nonlinear prediction (Shamim et al., 2016). Moreover, LOESS exhibits flexibility by effectively capturing intricate local data trends that might pose challenges for linear methods because it does not assume a specific parametric model (Eguasa et al., 2022). For LOESS, we used the “loess” function in R and the default span parameter (James et al., 2013).
A DNN stands as an artificial neural network featuring numerous layers positioned between the input and output layers. In this study, we constructed a DNN using a sequential Keras model within R (Chollet and Allaire, 2017). We applied two hidden layers to the model and constructed the output layer with a single unit (BW), given that our model involves a regression problem with a solitary response variable. Additionally, we employed the rectified linear activation function (relu) as the default activation function for regression issues in Keras. The option of dropping out between the layers was used because a dropout in the hidden layer helps prevent the DNN from memorizing the input data (overfitting). The model was compiled using the RMSprop optimizer. We carried out hyperparameter tuning employing a grid search strategy across the provided parameter range, and subsequently, we chose the optimal parameter combination (with the lowest mean absolute error [MAE]). For model training, the epoch number was 100, batch size was 5, learning rate was 0.00001, and validation split was 0.2.
The dataset was split into two parts: 80 % for training and 20 % for test data, achieved through random sampling. The training data were utilized to build BW prediction models, while the test data were employed to assess and compare the predictive performance of the different modeling approaches (Chen et al., 2022).
The model performance was appraised utilizing a ten-fold cross validation approach in order to gauge the test error associated with each model. We used MAE and root mean square error (RMSE) to assess precision and accuracy, as described by Walls et al. (2020):
2.4 Calculation of energy balance and development of energy balance index
Daily EB was determined by subtracting the energy intake from the demand (GfE, 2001). Daily energy intake was computed based on the DMI and net energy of the TMR (Eq. (9)).
Daily energy demand was derived as the sum of energy demands for lactation and maintenance (Smit et al., 2005) (Eq. (10)). The predicted BW values were utilized to calculate the energy demand for maintenance.
To develop an EB index, cows were classified into three groups based on the time point at which a negative energy balance (NEB) was converted to a positive energy balance (PEB): EB index 1 (DIM ≤ 70), EB index 2 (70 < DIM ≤ 140), and EB index 3 (140 < DIM ≤ 305). Each group comprised 9 cows (55 ± 16.1 months old; 721 ± 45.7 kg BW), 10 cows (60 ± 14.0 months old; 735 ± 56.3 kg BW), and 11 cows (71 ± 22.0 months old; 717 ± 63.7 kg BW), respectively. The EB was scaled with an average value of zero and a standard deviation (SD) of 1.
3 Results
3.1 Prediction of BW
To obtain an optimal prediction model for BW, predictive performance was tested and compared using three different methods. As shown in Table 2, the DNN model had the lowest RMSE (32.92) and MAE (25.65) when compared to the MLR and LOESS models in the tenfold cross-validation. As the DNN model had a higher accuracy in this study than the other models, we used the BW predicted by this model to calculate the energy demand. The ECM and DMI patterns during lactation are shown in Fig. 2. The ECM increased sharply during the first 8–9 weeks (DIM 61) of lactation, after which it decreased. In contrast, the DMI increased slowly until approximately 14 weeks (DIM 100). The features were days in milk (DIM), energy corrected milk (ECM), fat-to-protein ratio, and parity. MAE, mean absolute error (obtained using ten-fold cross validation); RMSE, root mean square error (obtained using ten-fold cross validation).
Models
RMSE
MAE
Multiple Linear Regression (MLR)
50.94
38.15
Local Regression (LOESS)
40.93
32.73
Deep Neural Network (DNN)
32.92
25.65
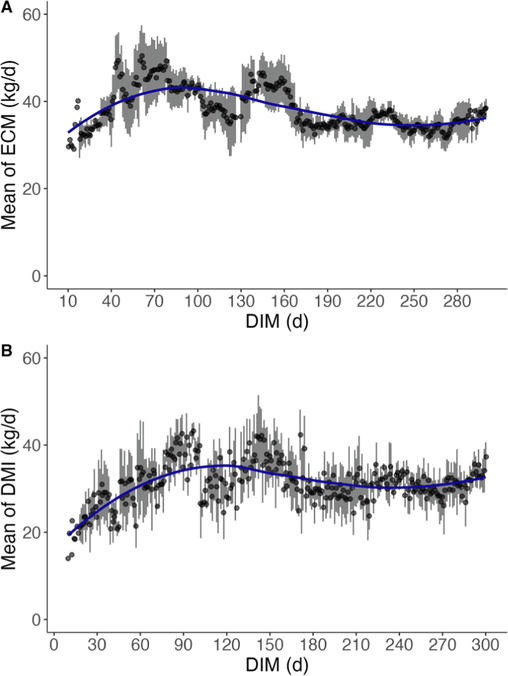
Relationship between days in milk (DIM) and (A) the mean of energy corrected milk (ECM) and (B) dry matter intake (DMI) in Holstein cows (mean ± SD).
3.2 Calculation of energy balance
The estimated energy demand, energy intake, and EB during lactation are shown in Fig. 3. The mean daily energy demand was high after parturition up to DIM 61, after which it began to decline (Fig. 3A). The mean daily energy intake was low after parturition and peaked at a DIM of 100. These patterns of changes in energy intake and demand during lactation were similar to those of the DMI and ECM results (Fig. 2). This was expected, as daily energy intake was computed from DMI, and the net energy of the total mixed ration and daily energy demand were determined as the sum of energy demand for milk production and maintenance. As shown in Fig. 3C, the daily mean EB was negative after parturition and then increased to a positive value.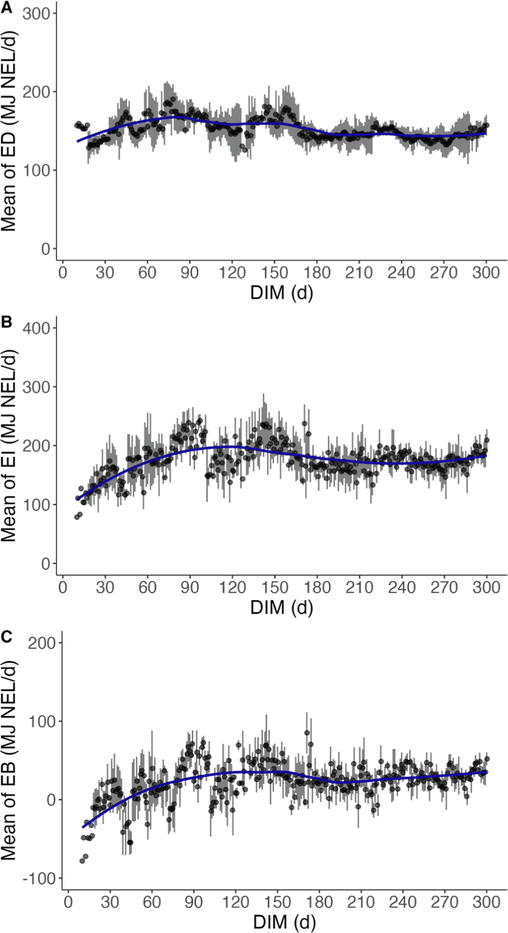
Relationship between days in milk (DIM) and (A) the mean of energy demand (ED), (B) energy intake (EI), and (C) energy balance (EB) in Holstein cows (mean ± SD).
3.3 Development of energy balance index
We found that the day on which the EB status transitioned from negative (N) to positive (P) differed among the cows (Fig. 3C). Therefore, the cows were assigned to three EB index groups. EB index 1 indicates the day of EB transition was within DIM ≤ 70. The EB indexes 2 and 3 were 70 < DIM ≤ 140 and 140 < DIM ≤ 305, respectively. The EB index 1 group rapidly converted from NEB to PEB in the early lactation period, and EB index 2 remained NEB during early lactation and then transitioned to PEB in the mid-lactation period. In addition, EB index 3 maintained NEB in the early and mid-lactation periods and was only converted to PEB during late lactation.
The average EB, ECM, feed efficiency, and calving interval are shown in Table 3. The EB values differed significantly based on the EB index. The means of EB (±SD) were 45.22 ± 48.31, 37.68 ± 32.14, and 4.93 ± 50.47 MJ/d in the EB indexes 1, 2, and 3 during the period of DIM 10–305, respectively. EB index 3 had the lowest EB, which is the latest transition from NEB to PEB, compared with EB indexes 1 and 2. Estimates of EB became zero at approximately DIM 66, 105, and 200 for EB indexes 1, 2, and 3, respectively. The highest ECM (38.89 ± 4.33) and feed efficiency (1.49 ± 0.48) were found in EB index 3, which is the latest to transition from NEB to PEB. The ECM yields were 33.08 ± 7.96 and 37.74 ± 5.66 kg/d for EB indexes 1 and 2, respectively. The feed efficiencies were 1.09 ± 0.42 and 1.14 ± 0.24 in EB indexes 1 and 2, respectively. The calving interval was the shortest at 379.32 ± 45.25 in EB index 1, which was the earliest to transition from NEB to PEB. Calving interval means were 488.00 ± 74.65 d and 561.07 ± 99.92 d for EB indexes 2 and 3, respectively. Feed efficiency = energy corrected milk (kg/d)/dry matter intake (kg/d).
Items
Groups
p-value
EB index1
EB index2
EB index3
Energy balance (MJ/d)
45.22a ± 48.31
37.68b ± 32.14
4.93c ± 50.47
<0.0001
Energy corrected milk (kg/d)
33.08c ± 7.96
37.74b ± 5.66
38.89a ± 4.33
<0.0001
Feed efficiency
1.09b ± 0.42
1.14b ± 0.24
1.49a ± 0.48
<0.0001
Calving interval (d)
379.32c ± 45.25
488.00b ± 74.65
561.07a ± 99.92
<0.0001
4 Discussion
Monitoring the EB of individual cows is essential for their proper management and breeding (Mäntysaari et al., 2019). It assists farmers in recognizing cows that might be prone to metabolic stress and production diseases, while also verifying the adequacy of existing management and nutritional approaches. Changes in the EB throughout a cow's lifespan might serve as a valuable prospective selection objective due to the genetic differences in EB profiles observed among bull daughter groups in their initial lactation (Coffey et al., 2001). Although several methods have been proposed to estimate EB using BW changes, body condition scores (Friggens et al., 2007), and analysis of metabolites in blood and milk (Moore et al., 2005), these are difficult to apply to large herds (Coffey et al., 2001; Alvarez et al., 2018), making it challenging to monitor the individual EB of cows in the field. Therefore, an easy and effective method for monitoring EB in cows is required. The daily EB can be determined by subtracting the measured energy intake from the demand (GfE, 2001). However, this calculation requires BW and milk yield and composition measurements, which can be challenging to acquire at the farm level (Mäntysaari et al., 2019).
This study predicted BW in lactating cows based on milk trait (ECM, DIM, and fat-to-protein ratio) data using automatic milking systems and parity information, which are more broadly available on commercial farms. In our study, we utilized daily measurements of milk yield and composition instead of relying on monthly evaluations. Frequent measurements enabled us to smooth the milk production data prior to the modelling analysis. The predicted BW was used to calculate the energy required for maintenance (GfE, 2001). Using predicted BW has the advantage of being simple to integrate with automatic milking systems and sensor-based monitoring systems, allowing for almost continuous BW monitoring. The BW of cows decreases sharply during the first 3–5 weeks of lactation and then increases at the end of lactation (Vanrobays et al., 2015; Mäntysaari et al., 2019). During early lactation, insufficient feed intake triggers the mobilization of energy from body reserves, ultimately causing a decline in BW (Mäntysaari et al., 2012). In contrast, lost body reserves are restored later in lactation with elevated feed intake and reduced milk yield, leading to an increase in BW.
During the initial stages of lactation, the energy demands of high-producing cows are rarely met by their feed intake (Mäntysaari et al., 2012), which results in energy mobilization from their body reserves to make up for the energy deficit, causing NEB during the early lactation period. Notably, at least 80 % of dairy cows undergo NEB during early lactation (Nigussie, 2018). In general, when NEB occurs in the early lactation of dairy cows, EB reaches zero during mid-lactation and becomes positive in late lactation. Cows experiencing body tissue and energy loss in the early lactation typically reach PEB around DIM 40–80 (Coffey et al., 2001). However, several cases of negative EB during the mid- and late lactation periods in high-yielding dairy cows with relatively high milk yields were observed. In this study, cows on average achieved PEB at DIM 66, 105, and 200 for EB indexes 1 (early lactation period), 2 (mid-lactation period), and 3 (late lactation period), respectively. Coffey et al. (2001) reported that the cumulative body energy loss in the first lactation period was fully regained at approximately DIM 200. Further, the more delayed the transition from NEB to PEB, the higher the ECM and feed efficiency. This was due to the dairy cows mobilizing the necessary energy requirements from body fat to produce large amounts of milk, leading to the cows remaining in the NEB state until the mid-lactation period (Table 3). In addition, for EB index 3, the daily EB remained negative until mid-lactation, which suggests that milk productivity increases but reproductive efficiency may decrease. NEB leads to decreased fertility and metabolic disorders, such as ketosis and mastitis. (Puangdee et al., 2016), and severe NEB postpones early ovulation and recuperation of postpartum reproductive function and exerts carryover effects that diminish fertility during the breeding period (Nigussie, 2018). Moreover, postpartum reproductive activity may resume only once the nadir of NEB is reached (Coffey et al., 2002), indicating that the transformation from NEB to PEB could serve as a valuable sign of the restoration of reproductive activity.
These results suggest that the present model is an appropriate method for evaluating EB on a commercial farm without measuring BW daily. Monitoring the EB of individual cows has clear benefits from the perspective of using EB as a diagnostic tool for nutrition and reproduction. In addition, EB indexes can be used as indicators for farm management decision-making. These advanced modeling techniques offer concrete benefits to dairy farmers in real practice. The precise anticipation of BW and EB has a pivotal role in guiding decisions related to feed management, allowing for meticulous adjustments in the dietary plans of individual cows. By integrating readily accessible information, such as milk traits, parity, and DIM, the devised models can provide tailor-made recommendations for the specific nutritional requirements of each EB index group. This customized approach enhances feed utilization efficiency and enables economically efficient milk production, considering the reproductive efficiency of the next parity. Further, it facilitates the early identification and prompt intervention of metabolic disorders. The outcomes highlighted in this study underscore the potential significance of advancing dairy farming practices, thereby contributing to progress in sustainable livestock management.
Our research had some limitations that should be taken into account when interpreting the findings. The data used for model training and testing were derived from only one farm, which could have contributed to an unbalanced distribution of BW values for model training, and farm-specific BW and EB patterns may exist. Therefore, models must be trained on data from a larger number of farms to ensure the robustness of the predictions.
5 Conclusion
We developed a BW prediction model for individual cows using milk production traits and parity information and estimated their daily EB based on the predicted BW. In this study, milk production traits readily available on commercial dairy farms were used as input variables for BW prediction. The DNN model demonstrated the highest predictive accuracy during the lactation period, outperforming the LOESS and MLR models in the ten-fold cross-validation. This investigation highlighted variations in the transition of EB status from negative to positive among cows, leading to the classification of cows into three EB index groups based on DIM, which captured different EB transition patterns. Notably, EB index 3 exhibited the slowest transition from negative to positive EB, accompanied by the highest FE and ECM values. The EB of individual cows during lactation can be estimated and monitored with moderately high accuracy using EB indexes. In conclusion, EB indexes could be used as indicators for individual and herd management. Future work will aim to validate these models on multiple dairy farms.
Ethics approval
This study was approved by the Institutional Animal Care and Use Committee of Jeonbuk National University, Korea (No. 2020–1958).
CRediT authorship contribution statement
Eunjeong Jeon: Conceptualization, Data curation, Formal analysis, Investigation, Methodology, Visualization, Writing – original draft, Writing – review & editing. Sangbuem Cho: Conceptualization, Data curation, Formal analysis, Software, Investigation, Methodology, Visualization, Writing – review & editing. Seongsoo Hwang: Investigation, Methodology, Software, Validation, Writing – review & editing. Kwanghyun Cho: Investigation, Methodology, Resources, Software, Writing – review & editing. Cedric Gondro: Investigation, Methodology, Software, Validation, Writing – review & editing. Nag-Jin Choi: Conceptualization, Data curation, Investigation, Methodology, Project administration, Funding acquisition, Writing – review & editing.
Acknowledgements
This research was supported by the Basic Science Research Program through the National Research Foundation of Korea (NRF), funded by the Ministry of Education (NRF-2022R1I1A3068293).
Declaration of competing interest
The authors declare that they have no known competing financial interests or personal relationships that could have appeared to influence the work reported in this paper.
References
- Body condition estimation on cows from depth images using convolutional neural networks. Comput. Electron. Agric.. 2018;155:12-22.
- [CrossRef] [Google Scholar]
- Assessment of the influence of environmental variables on pig's body temperature using ANN and MLR models. Indian. J Anim. Res.. 2020;54(9):1165-1170.
- [CrossRef] [Google Scholar]
- Artificial neural networks and multiple linear regression as potential methods for modeling body surface temperature of pig. J. Appl. Anim. Res.. 2020;48(1):207-219.
- [CrossRef] [Google Scholar]
- Bruhns, A., Deurveilher, G., Roy, J.S., 2005. A non-linear regression model for midterm load forecasting and improvements in seasonality. In: Proceedings of the 15th Power System Competition Conference (PSCC), Liege, pp. 22-26.
- The association of subclinical hypocalcemia, negative energy balance and disease with bodyweight change during the first 30 days post-partum in dairy cows milked with automatic milking systems. Vet. J.. 2015;204(2):150-156.
- [CrossRef] [Google Scholar]
- Can machine learning algorithms perform better than multiple linear regression in predicting nitrogen excretion from lactating dairy cows. Sci. Rep.. 2022;12(1):1-13.
- [CrossRef] [Google Scholar]
- Deep Learning with R. Manning Publications, Manning Early Access Program (first ed.). New Delhi, India: MEA; 2017.
- Chowdhury, S., Verma, B., Roberts, J., Corbet, N., Swain, D., 2016. Deep Learning Based Computer Vision Techniquefor Automatic Heat Detection in Cows. In: Development International Conference on Digital Image Computing: Techniques and Applications, pp. 1-6.
- Genetic evaluation of dairy bulls for energy balance traits using random regression. Anim. Sci.. 2001;73(1):29-40.
- [CrossRef] [Google Scholar]
- Energy balance profiles for the first three lactations of dairy cows estimated using random regression. J. Dairy Sci.. 2002;85(10):2669-2678.
- [CrossRef] [Google Scholar]
- Local Linear Regression and the problem of dimensionality: a remedial strategy via a new locally adaptive bandwidths selector. J. Appl. Statistics. 2022;50(6):1-27.
- [CrossRef] [Google Scholar]
- On the use of milk composition measures to predict the energy balance of dairy cows. J. Dairy Sci.. 2007;90(12):5453-5467.
- [CrossRef] [Google Scholar]
- GfE (Gesellschaft für Ernährungsphysiologie), 2001. Ausschuss für Bedarfsnormen der Gesellschaft für Ernährungsphysiologie:Empfehlung zur Energie-und Nährstoffversorgung der Milchkühe und Aufzuchtrinder.
- Deep neural network and whale optimization algorithm to assess flyrock induced by blasting. Eng. Comput.. 2021;37:173-186.
- [CrossRef] [Google Scholar]
- Prediction of energy balance in a high-yielding dairy herd in early lactation: model development and precision. Livest. Prod. Sci.. 2000;65(1–2):91-105.
- [CrossRef] [Google Scholar]
- Prediction of energy balance in high yielding dairy cows with test-day information. J. Dairy Sci.. 2001;84:471-481.
- [CrossRef] [Google Scholar]
- An introduction to statistical learning. Springer; 2013.
- Energy balance indicators during the transition period and early lactation of purebred Holstein and Simmental cows and their crosses. Animals. 2021;11(2):309-329.
- [CrossRef] [Google Scholar]
- Genetic parameters of milk β-hydroxybutyrate acid, milk acetone, milk yield, and energy-corrected milk for Holstein dairy cattle in Korea. J Korean Data Inf Sci Soc.. 2017;28:1349-1360.
- [Google Scholar]
- Modeling of daily body weights and body weight changes of Nordic Red cows. J. Dairy Sci.. 2015;98(10):6992-7002.
- [CrossRef] [Google Scholar]
- Energy efficiency and its relationship with milk, body, and intake traits and energy status among primiparous Nordic Red dairy cattle. J. Dairy Sci.. 2012;95(6):3200-3211.
- [CrossRef] [Google Scholar]
- Body and milk traits as indicators of dairy cow energy status in early lactation. J. Dairy Sci.. 2019;102(9):7904-7916.
- [CrossRef] [Google Scholar]
- Calculating and improving energy balance during times of nutrient limitation. Proc. Southwest Nutr. Conf. 2005:173-185.
- [Google Scholar]
- A review on the role of energy balance on reproduction of dairy cow. J. Dairy Res. Technol.. 2018;1:1-8.
- [CrossRef] [Google Scholar]
- Effect of milk fat to protein ratio on genetic variance for milk yield in Thai tropical Holstein cattle. Can. J. Anim. Sci.. 2016;96(3):410-415.
- [CrossRef] [Google Scholar]
- R Core Team, 2020. R: a language and environment for statistical computing. Vienna, Austria. Available online: https://www.R-project.org/.
- Predicting the body weight of Hereford cows using machine learning. IOP Conf. Ser.: Earth Environ. Sci.. 2021;624:012056
- [CrossRef] [Google Scholar]
- A comparison of artificial neural networks (ANN) and local linear regression (LLR) techniques for predicting monthly reservoir levels. KSCE J. Civ. Eng.. 2016;20:971-977.
- [CrossRef] [Google Scholar]
- Individual identification of dairy cows based on convolutional neural networks. Multimed. Tools Appl.. 2020;79:14711-14724.
- [CrossRef] [Google Scholar]
- Shirley, J. 2006. Feed efficiency is an important management tool for dairy producers. In: Proc. High Plains Dairy Conf. Amarillo TX. Texas A & M University, College Station, pp. 63–67.
- Comparison of techniques for estimating herbage intake of grazing dairy cows. J. Dairy Sci.. 2005;88(5):1827-1836.
- [CrossRef] [Google Scholar]
- Short communication: Novel method to predict body weight of primiparous dairy cows throughout the lactation. J. Dairy Sci.. 2015;98(1):692-697.
- [CrossRef] [Google Scholar]
- Prediction of actual evapotranspiration by artificial neural network models using data from a Bowen ratio energy balance station. Neural. Comput. Appl.. 2020;32:14001-14018.
- [CrossRef] [Google Scholar]
- Prediction of body weight and empty body composition using body size measurements in lactating dairy cows. Livest. Sci.. 2009;124(1–3):233-241.
- [CrossRef] [Google Scholar]
Appendix A
Supplementary material
Supplementary data to this article can be found online at https://doi.org/10.1016/j.jksus.2023.103008.
Appendix A
Supplementary material
The following are the Supplementary data to this article:


