

Translate this page into:
Development and validation of spectrophotometric method for determination of imipramine hydrochloride in tablets (solid materials)
⁎Corresponding author. syed-azmi@hct.edu.om (Syed Najmul Hejaz Azmi),
-
Received: ,
Accepted: ,
This article was originally published by Elsevier and was migrated to Scientific Scholar after the change of Publisher.
Peer review under responsibility of King Saud University.
Abstract
In the presented work, potassium dichromate in the presence of sulfuric acid was used as a reagent for spectrophotometric determination of imipramine HCl concentration in tablet formulations. The variables of the proposed method such as volume of potassium dichromate (0.01%), volume of sulfuric acid (10 M) and concentration of imipramine HCl (µg mL−1) were optimized by response surface methodology via Box-Behnken design. The optimum conditions were 14 µg mL−1 of imipramine HCl, 0.6 mL of 0.01% potassium dichromate and 5.0 mL of 10 M sulfuric acid. The green coloured product (dimeric compound of imipramine HCl) absorbed maximally at 620 nm. The stoichiometric ratio between imipramine HCl and potassium dichromate was studied by mole ratio method and found to be 2:1. The formation constant (Kf) and apparent Gibb’s free energy (ΔG°) were calculated and found to be 1.858 × 10¹⁴ and −81.182 kJ mol−1, respectively. Beer’s law was obeyed in the imipramine HCl concentration range of 1–14 μg mL−1 with molar absorptivity of 2.25 × 10⁴ Lmol−1 cm−1. The proposed method was successfully applied for the determination of imipramine HCl concentration in tablet formulations (solid materials) and statistically found to be in good agreement with the reference method. The % recovery of proposed and reference methods was in the range of 99.94–100.08% and showed the compliance (100 ± 2%) with regulatory guidelines.
Keywords
Potassium dichromate
Imipramine HCl
Spectrophotometry
Tablet formulations
Response surface methodology

1 Introduction
Imipramine HCl is chemically known as 3-(10, 11-Dihydro-5H-dibenzo[b,f]azepin-5-yl)-N,N-dimethylpropan-1-amine HCl. It is a tricyclic antidepressant drug which inhibits the reuptake of serotonin and norepinephrine. The drug enhances the noradrenergic activity by blocking the reuptake of norepinephrine in peripheral and central noradrenergic neurons (Goodman and Gilman, 2010). The drug is effective against moderate to severe depression associated with psychomotor and physiological changes like loss of appetite and sleep disturbance. The drug is administered orally and for adult, the initial dose is up to 75 mg daily in divided doses (BNF, 2021). Imipramine is also used for the treatment of nocturnal enuresis in children (Seyfhashemi et al., 2015; Tai et al., 2019). Hence, the preparation of tablets with active imipramine is very essential part of pharmaceutical industry. Therefore, it is important to control the amount of drug in pharmaceutical formulations to ensure safety and efficacy. In this regard, accurate and validated analytical methods are required to quantify the active pharmaceutical ingredients in commercial dosage forms.
In the literature, some research papers have highlighted the importance of drugs and its impurity profiling (Azmi et al., 2013; Husain et al., 2021; Siddiqui et al., 2017; Al-Othman et al., 2013; Rahman et al., 2006). Imipramine HCl with inactive ingredients in tablet formulations could be provided orally to patients with ease. The important inactive ingredients of imipramine are corn starch, sucrose, hydroxypropyl cellulose, hypromellose, anhydrous lactose, magnesium stearate, polyethylene glycol, stearic acid, talc, titanium dioxide, colloidal anhydrous silica, sunset yellow, aluminum hydroxide gel, sodium benzoate and indigo carmine.
The official monograph of British Pharmacopoeia (BP, 2018) described a non-aqueous potentiometric titrimetric method for the determination of imipramine HCl in tablets. Various other analytical methods have been reported for the determination of imipramine HCl in pharmaceutical formulations/biological samples. They are based on high performance thin layer chromatography (Zhang et al., 2016), high performance liquid chromatography (Pankajkumar-Patel et al., 2021; Vemula and Sharma, 2013; Chauhan and Patel, 2016), gas chromatography-mass spectrometry (Oenning et al., 2020) and spectrofluorimetry (Azmi et al., 2017b). Recently, a review presented the main electroanalytical techniques used in the determination of antidepressants including imipramine HCl in biological samples and pharmaceutical formulations (Martins et al., 2021).
Spectrophotometry is a universal, inexpensive, versatile and simple technique which is commonly used in mostly all laboratories. Imipramine HCl was determined by spectrophotometric methods involving the oxidation of drug with (a) ammonium metavanadate (Misiuk, 2000), (b) ammonium peroxidisulfate in phosphoric acid medium (Misiuk et al., 2001), (c) potassium permanganate in NaOH medium (Susmitha et al., 2013). The drug was assayed by reaction of imipramine with iodine (Susmitha et al., 2013). Imipramine HCl was also determined by ion-pair complexation reaction with (a) eriochrome cyanine in n-butanol (Starczewska 2000), (b) niobium(V) thiocyanate in n-butanol-chloroform (Misiuk et al., 2001), (c) bromothymol blue, bromophenol blue, bromocresol green and bromocresol purple in chloroform (Susmitha et al., 2013) by extractive spectrophotometry.
In this paper, a simple and sensitive spectrophotometric method was developed using potassium dichromate in sulphuric acid medium at room temperature (25 ± 1 °C) for the determination of imipramine HCl in tablet formulations. The green-coloured product i.e., dimeric compound of imipramine was formed and the absorbance was recorded at 620 nm. The reaction conditions were optimized by response surface methodology via Box-Behnken design and validated for developing the said spectrophotometric method as per the International Conference on Harmonization guidelines (ICH, 1995).
2 Materials and methods
2.1 Apparatus
UV–Visible spectra were recorded on Evolution 300 UV–Visible spectrophotometer (Thermo Scientific, UK) equipped with 1-cm quartz cells. pH values were recorded using Hanna pH meter (USA). OriginPro 2020b software (USA) was used to draw spectral graphs. Branson Sonicator (2800 model, Italy) was used to dissolve imipramine HCl. The tablet solution was filtered using 0.45 µm polyethersulfone membrane filter.
2.2 Reagents and standards
Reagents and solvents used were of AR grade. Potassium dichromate solution (0.01%, HiMedia Laboratories, India) and 10.0 M H2SO4 (VWR Chemicals, India) were prepared in doubly distilled water. Imipramine HCl (0.02% or 200 μg mL−1, MW = 316.9, Sigma-Aldrich, USA) standard solution was prepared by dissolving 0.02 g imipramine HCl in 150 mL Erlenmeyer stoppered conical flask with 75 mL of distilled water. The drug solution was sonicated using Sonicator at 30 ± 1 °C for half an hour for thoroughly mixing and dissolving drug. The drug solution was transferred into 100 mL standard volumetric flask and diluted up to the mark with distilled water. Tablets (solid materials) of imipramine such as Imipramine 25 (Actavis, UK) and imipramine HCl 25 (SGH, Singapore) were procured from Ministry of Health, Oman for this study.
2.3 Box Behnken design for optimization
RSM with Box-Behnken design has been used to optimize the variables of the analytical methods (Rahman et al., 2019; Rahman and Khan, 2018). For this, three variables such as volumes of 0.01% K2Cr2O7, 10 M H2SO4 and concentration of imipramine hydrochloride (µg mL−1) were selected. The range and levels of each variable were obtained by preliminary experiments which are presented in Table S1 (Supplementary data).
Design Expert software was utilized to generate BBD matrix for the selected variables (Table 1). BBD matrix showed a total of 17 experiments that are needed to evaluate the effects of variables on the response (absorbance). The experiments were carried out using different combinations of variables A, B and C and absorbance was measured at 620 nm against the reagent blank (Table 1).
Exp.Run
A
B
C
Observed response (%)
Predicted response (%)
1
0.6
8
20
0.9431
0.9348
2
0.6
5
14
0.9820
0.9820
3
0.6
5
14
0.9820
0.9820
4
0.6
5
14
0.9820
0.9820
5
0.6
2
20
0.4771
0.4875
6
0.6
8
8
0.9293
0.9189
7
0.6
5
14
0.9820
0.9820
8
0.3
8
14
0.6350
0.6347
9
0.6
5
14
0.9820
0.9820
10
0.6
2
8
0.5312
0.5395
11
0.9
5
20
0.9421
0.9314
12
0.3
5
8
0.6602
0.6709
13
0.9
8
14
0.9431
0.9348
14
0.3
2
14
0.9820
0.9820
15
0.9
2
14
0.9820
0.9820
16
0.9
5
8
0.9820
0.9820
17
0.3
5
20
0.4771
0.4875
For RSM, the coefficients of the response model were determined by fitting the measured data into second degree polynomial equation and the coefficients of the response model were evaluated. The relationship between the predicted response and the variables involving linear, quadratic and interaction terms is expressed as:
2.4 Procedure for the determination of imipramine HCl by proposed method
Aliquots of imipramine HCl (200 μg mL−1) solution were pipetted into a series of 10 mL volumetric flasks equivalent to 1–14 μg mL−1 imipramine HCl. To each flask, 5.0 mL of 10 M H2SO4 and 0.6 mL of 0.01% potassium dichromate were added. The contents of the flask were mixed well and diluted up to the mark with distilled water. The flask was kept for 1 min at room temperature (25 ± 1 °C) to complete the reaction (complete formation of the green-colored product). The absorbance was measured at 620 nm against blank solution prepared similarly except drug solution. The calibration graph was constructed by plotting absorbance (y-axis) versus initial concentration of imipramine HCl (x-axis) in μgmL−1. The linear regression equation was obtained using OriginPro 2020b software. The regression equation was utilized for assay of active imipramine in pharmaceutical dosage forms.
2.5 Procedure for the determination of imipramine HCl by reference method
Into a series of 10 mL standard volumetric flask, aliquots (0.1–1.6 mL) of 0.02% standard imipramine HCl aqueous solution corresponding to 2.0–32.0 μg mL−1 were pipetted. Each flask was diluted up to the mark with distilled water at room temperature. The contents of the flask were mixed well and the absorbance was recorded at 251 nm against distilled water as a blank solvent. The calibration graph was plotted between absorbance (y-axis) and initial concentration of imipramine HCl (x-axis) in μg mL−1. The linear regression equation was generated using calibration data by OriginPro 2020b software and utilized for the determination of active imipramine HCl in tablets.
2.6 Assay of imipramine HCl in tablet formulations by proposed and reference methods
6 tablets of imipramine 25 (Actavis, UK) and imipramine HCl 25 (SGH, Singapore) were taken out from the wrapper and weighed. The contents of tablets were finely powdered in agate mortar and pestle. 0.065 g of each fine powdered tablet equivalent to 20 mg active imipramine HCl was weighed and transferred in 150 mL Erlenmeyer stoppered conical flask with 60 mL of distilled water. The contents of the flask were sonicated using Sonicator at 30 ± 1 °C for half an hour and then passed through a filter funnel equipped with Whatmann No 42-filter paper in 100 mL standard volumetric flask. The residue was washed with 3 × 10 mL portions of distilled water and the filtrate was diluted up to the mark with distilled water. Finally, the drug solution was passed through 0.45 µm polyethersulfone membrane filter and assayed by proposed and reference procedures for the determination of active imipramine HCl in tablet formulations.
3 Results and discussion
In acidic medium, oxidants such as K2Cr2O7, KIO3 and NH4VO3 reacted with imipramine and formed oxidized blue coloured dimeric compound of imipramine but K2Cr2O7 was selected for method development because of appreciably higher reduction potential (couple Cr2O72−/Cr3+, E0 = 1.33 V, versus standard hydrogen electrode). The inorganic ions with higher reduction potential get reduced quickly and accept electrons more easily.
Imipramine HCl is soluble in distilled water and absorbed maximally at 251 nm. The aqueous solution of K2Cr2O7 absorbed maximally at 199 nm while the sulfuric acid solution of K2Cr2O7 absorbed differently and gave 2 characteristic peaks at 257 nm and 352 nm. In the proposed method, the aqueous solution of imipramine HCl reacted with acidified potassium dichromate and provided a new characteristic peak at 620 nm. The absorption band appearing at 620 nm is due to formation of a dimeric species of imipramine. Same results have been reported by Misiuk (2000) for determination of imipramine in which drug reacted with ammonium metavanadate in acidic medium and produced a dimeric compound of imipramine which absorbed maximally at 620 nm. The UV–visible spectrophotometric spectra results are shown in Fig. 1. Based on reaction findings and literature review, the reaction sequence of the proposed method is given in Fig. 2.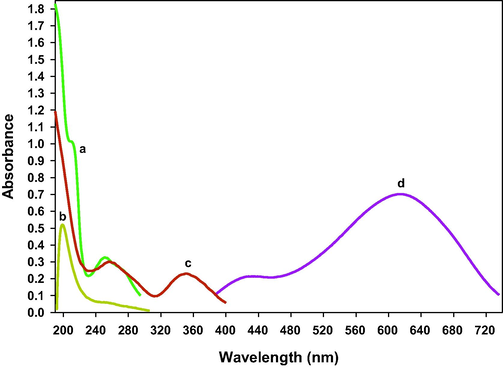
UV–visible spectrophotometric spectra (a) 0.8 mL of imipramine (0.02%) in distilled water (b) 0.25 mL of 0.01% K2Cr2O7 in distilled water (c) 0.25 mL of 0.01% K2Cr2O7 in distilled water + 5 mL of 6 M H2SO4 (d) 0.5 mL of imipramine (0.02%) in distilled water +2 mL K2Cr2O7 (0.01%) +5.5 mL of 10 M H2SO4. Each solution was taken in 10 mL of standard volumetric flask and diluted up to mark with distilled water.
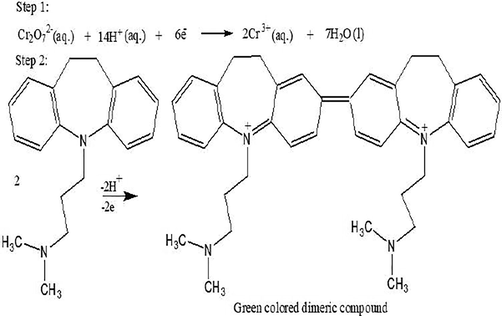
Tentative mechanism for the oxidation of imipramine.
The stoichiometric ratio between imipramine and potassium dichromate was investigated by mole ratio method (Skoog et al., 2007). In this method, the identical molar concentration of imipramine and potassium dichromate were taken. The experiment was performed by pipetting different volumes (0.2–1.2 mL) of 4.419 × 10⁻⁴ M imipramine HCl with fixed volume (0.5 mL) of 4.419 × 10⁻⁴ M potassium dichromate. The increase in absorbance was recorded at 620 nm and plotted against the mole ratio, [Imipramine]/[Potassium dichromate]. The results are shown in Fig. S1, Supplementary data. As can be seen from the figure that the highest absorbance was obtained with 1 mL of 4.419 × 10⁻⁴ M imipramine when reacted with 0.5 mL of 4.419 × 10⁻⁴ M potassium dichromate. This provided stoichiometric ratio of 2:1 between imipramine and potassium dichromate. The formation constant (Kf) of the green colored product was calculated using the following formula (Rahman et al., 2009; Lutfullah et al., 2012; Azmi et al., 2015, 2017a,b):
The reaction conditions of the proposed method were optimized by response surface methodology via Box-Behnken design (Azmi et al., 2020; Azmi et al., 2021). The green colored product i.e., dimeric compound of imipramine was formed within 1.0 min of reaction time at room temperature with potassium dichromate. The reaction time was optimized as 2 min for development of the spectrophotometric method. The similar absorbance of the green-coloured product was recorded at elevated temperature up to 30 °C. Hence, the reaction temperature of 25 ± 1 °C was optimized for development of the method. The formed green coloured product was stable up to 1 h, hence, the absorbance could be recorded within the stability time period of 1 h at room temperature.
3.1 BBD for optimization
The experimental data obtained for optimization using BBD matrix were fitted to linear, interactive and quadratic models and the statistical data are given in Table 2. The low values of standard deviation (0.0144) and predicted residual error sum of square (0.0234) and R2 of 0.9983 demonstrated the adequacy of quadratic model. The multi-regression analysis of measured data gave a relationship between the absorbance and the selected variables. The predicted response can be computed using the following equation (3) in terms of coded factors: Absorbance = + 0.9820 + 0.1393A + 0.2067B – 0.0090 C + 0.0440 AB – 0.0027 AC + 0.0170 BC – 0.1435 A2 – 0.2272 B2 – 0.346 C Pls. accept Eq. 3 in the correct form
Model
Std. Dev.
F
P values
R2
Adjusted R2
Predicted R2
PRESS
Linear
0.1624
6.29
0.0072
0.5921
0.4979
0.3550
0.5419
2-factor interaction
0.1827
0.0890
0.9644
0.6027
0.3643
−0.1731
0.9856
Quadratic
0.0144
530.84
<0.0001
0.9983
0.9960
0.9722
0.0234
Suggested
ANOVA was conducted to examine the statistical significance of the model equation to predict absorbance and the results are given in Table 3. It has been reported that the model terms are considered significant when p < 0.05. Herein, p value for the quadratic model is very low (<0.0001). This indicated that the model is highly significant for the observed results. Moreover, F-value for the model is very high (446.53) for 9 degrees of freedom which further indicated the significance of the model. Herein, model terms such as C, AC and BC are not significant because p-values >0.05. Additionally, R2 for the model was 0.9983 which showed that the model fails to explain only 0.17% of the variations in the response.
Source
Sum of Squares
df
Mean Square
F-value
p-value
Model
0.8387
9
0.0932
446.53
<0.0001
Significant
A
0.1551
1
0.1551
743.35
<0.0001
B
0.3416
1
0.3416
1637.08
<0.0001
C
0.0007
1
0.0007
3.12
0.1206
AB
0.0077
1
0.0077
37.07
0.0005
AC
0.0000
1
0.0000
0.1372
0.7221
BC
0.0012
1
0.0012
5.52
0.0511
A2
0.0867
1
0.0867
415.70
<0.0001
B2
0.2173
1
0.2173
1041.40
<0.0001
C2
0.0051
1
0.0051
24.21
0.0017
Residual
0.0015
7
0.0002
Lack of Fit
0.0015
3
0.0005
Pure Error
0.0000
4
0.0000
Cor Total
0.8401
16
3.2 Response surface plots
Response surface plots were generated for quadratic model using Design Expert software (trail version 8.0.4.1) to examine the relationship between different variables and absorbance (response). Fig. 3(I) showed the response surface plot as a function of volume of 0.01% K2Cr2O7 and volume of 10 M H2SO4 and their mutual interaction on absorbance; keeping the concentration of imipramine hydrochloride at center level (14 µgmL−1). The absorbance increased with increase in volumes of 0.01% K2Cr2O7 and 10 M H2SO4. The highest absorbance was found with 0.6 mL of 0.01% K2Cr2O7 and 5.0 mL of 10 M H2SO4. The interaction effect of the volume of 0.01% K2Cr2O7 and concentration of imipramine hydrochloride on absorbance is displayed in Fig. 3(II). The response surface plot showed that the absorbance increased with increasing volume of 0.01% K2Cr2O7 and concentration of imipramine hydrochloride and achieved a maximum value with 0.6 mL of K2Cr2O7 solution and 14 µg mL−1 of imipramine. The combined effect of volume of 10 M H2SO4 and concentration of imipramine hydrochloride on absorbance is displayed in Fig. 3(III). The absorbance increased with increasing volume of 10 M H2SO4 and concentration of imipramine hydrochloride. The highest absorbance was reached with 5.0 mL of 10 M H2SO4 and 14 µg mL−1 of imipramine. From 3D response surface plots, the optimum conditions were found to be: volume of 0.01% K2Cr2O7 = 0.6 mL, volume of 10 M H2SO4 = 5.0 mL and concentration of imipramine hydrochloride = 14 µg mL−1 to achieve the highest absorbance.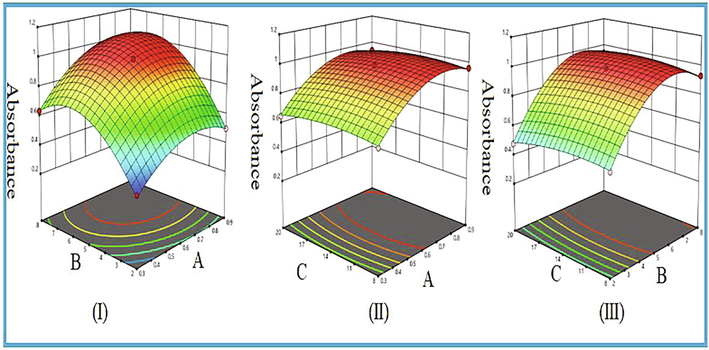
3D response surface plots as a function of (I) volume of 0.01% K2Cr2O7 and volume of 10 M H2SO4 (II) volume of 0.01% K2Cr2O7 and concentration of imipramine hydrochloride (µg mL−1) and (III) volume of 10 M H2SO4 and concentration of imipramine HCl on absorbance.
3.3 Validation
Under the optimized experimental conditions, different volumes of 0.02% imipramine HCl were added with potassium dichromate in the presence of sulfuric acid medium. The absorbance of the green colored product was recorded at 620 nm. The calibration graph was constructed by plotting absorbance against initial concentration of imipramine HCl and found to be linear in the range of 1–14 μg mL−1 with a correlation coefficient (r) of 0.999. The high value of r demonstrated the good linearity of calibration graph. The significance of correlation coefficient (r) was illustrated by computing t-value using Eq. (4) (Rahman et al., 2005):
The calculated t-value was found to be 59.12 which is higher than the tabulated t-value at 95% confidence level. This revealed the significant relationship between absorbance and concentration of imipramine hydrochloride. The parameters for analytical performance of the proposed and reference methods are summarized in Table 4. The limits of detection and quantitation of the proposed and reference methods were calculated as per the ICH guidelines for validation of analytical procedures (ICH, 1995) and found to be 0.04 and 0.13 μg mL−1 and 0.14 and 0.42 μg mL−1, respectively. The proposed method was more sensitive as compared to reference method because of having lower values of detection and quantitation limits.
Parameters
Spectrophotometric method
Proposed
Reference
Maximum wavelength, λmax (nm)
620
251
Beer’s law range (µg mL−1)
1–14
2–32
Linear regression equation
A = 4.89 × 10⁻⁴ + 7.00 × 10⁻²C
A = 4.64 × 10⁻⁴ + 2.04 × 10⁻²C
Standard deviation of intercept, Sa
6.22 × 10⁻⁴
5.42 × 10⁻⁴
Confidence limit of the intercept,±tSa
1.47 × 10⁻³
1.28 × 10⁻³
Standard deviation of slope, Sb
7.57 × 10⁻⁵
2.95 × 10⁻⁵
Confidence limit of the slope, ±tSb
1.79 × 10⁻⁴
6.97 × 10⁻⁵
Correlation coefficient (r)
0.999
0.999
Variance (So2)
7.76 × 10⁻⁷
6.56 × 10⁻⁷
Standard deviation of calibration line (So)
8.81 × 10⁻⁴
8.10 × 10⁻⁴
Limit of detection, LOD (µg mL−1)
0.04
0.14
Limit of quantification, LOQ (µg mL−1)
0.13
0.40
Molar absorptivity (Lmol−1 cm−1)
2.25 × 10⁴
6.48 × 10³
The statistical analysis of the calibration data made it possible for calculating the error (Sc) in the determination of a given concentration of imipramine HCl using the following expression (Rahman et al.,2004; Miller & Miller 1993):
The results are shown in Fig. S3 (supplementary data) by plotting % uncertainty confidence limit against the concentration of imipramine HCl (μg mL−1).
The intra-day and inter-day precision of the proposed method was evaluated by carrying out 5 replicate determinations at 3 different concentration levels of imipramine HCl (4.0, 8.0 and 12.0 µg mL−1) within the Beer’s law concentration range on the same day (intra-day) and on 5 consecutive days (inter-day). The results of analysis are summarized in Table 5. The % relative standard deviation for intra-day and inter day assays were found to vary over the range of 0.098–0.407% and 0.188–0.437%, respectively. The % recovery in both cases was varied and in the range of 99.98 to 100.18%. The results in the table revealed that the % recovery of imipramine was in the permissible range of 100 ± 2% (Canadian Health Protection Branch, 1992), hence, the proposed method followed acceptable precision.
Initial concentration of imipramine HCl (µg mL−1)
Intraday assay and interday precisions
Measured concentration ± SD(µg mL−1)
RSDa (%)
Recoverya (%)
Intraday
Interday
Intra-day
Inter-day
Intraday
Interday
4.0
4.001 ± 0.016
4.007 ± 0.018
0.407
0.437
100.04
100.18
8.0
7.998 ± 0.008
8.002 ± 0.022
0.098
0.271
99.98
100.02
12.0
12.010 ± 0.016
12.007 ± 0.023
0.130
0.188
100.09
100.06
The specificity and selectivity of the proposed method was assessed by monitoring the absorbance at 14 μg mL−1 imipramine HCl in the presence of excipients such as lactose, sucrose, starch, polyethylene glycol, mannitol, povidone, polyvinyl pyrrolidone. The maximum tolerance limit of excipients was calculated in terms of % concentration which was further converted into μg mL−1 using the following equation:
The maximum tolerance limits of added excipients are given in Table S2 (Supplementary data). It can be seen from table that the % recovery of imipramine was in the range of 99.34–100.87% in the presence of excipients. The % recovery of drug was in the permissible range of 100 ± 2% (Canadian Health Protection Branch, 1992), hence the proposed method was specific and selective. Some excipients such as microcrystalline cellulose and methyl cellulose were practically insoluble in distilled water. They were filtered using filter funnel with Whatmann No. 42 filter paper and then passed through 5 mL Millex-HV syringe filter unit of 0.45 µm polyethersulfone membrane filter. The tablet drug solutions were assayed and showed no interference from these excipients. Therefore, the proposed method could be suitably used to assay active imipramine HCl in pharmaceutical formulations.
The accuracy of the proposed method was investigated and the recovery was compared with the reference method. The amount of active imipramine HCl in tablet formulations of imipramine HCl 25 (SGH) and imipramine HCl 25 (Actavis, UK) was assayed using proposed and reference methods. Five independent analyses containing 14 μg mL−1 of active imipramine from tablet solutions were performed. The amount of active imipramine HCl in both tablet formulations was estimated by proposed and reference methods using obtained absorbance values, substituted in the following equations:
The % recovery of active imipramine in tablets by both methods was in the range of 99.94 to 100.08% (Table S3, Supplementary data). The % recovery results were in the permissible range of 100 ± 2% (Canadian Health Protection Branch, 1992), hence the proposed method was accurate and comparable with reference method.
The significance of both methods have been evaluated by interval hypothesis test. The results are summarized in Table 6. Paired t- and F-values were calculated (Rahman et al., 2017) and found to be lesser than the tabulated t (
=8, 2.306) and F-values (
=4, 4; 6.39) at 95% confidence level. This indicated that that there was no significant difference between proposed and reference methods. The bias based on recovery results of ±2% is acceptable (Canadian Health Protection Branch, 1992). The bias of both methods was calculated by interval hypothesis test (Rahman et al., 2016; Hartmann et al., 1995) using the following quadratic equation:
Tablet formulations
Concentrationa (µg mL−1)
Found
t-valueb
F-valueb
θLc
θUc
PM
RM
Imipramine HCl 25 (SGH)
14.007
13.991
1.199
3.54
0.996
1.002
Imipramine HCl 25 (Actavis, UK)
14.002
14.011
0.526
4.54
0.997
1.004
The quadratic equation has two roots (θL and θU) provided θL and θU of 0.996 and 1.002, respectively in Imipramine HCl 25 (SGH) and 0.997 and 1.004, respectively in Imipramine HCl 25 (Actavis, UK). The results were acceptable and showed the compliance with regulatory guidelines (Canadian Health Protection Branch, 1992).
3.4 Comparison with other methods
The performances of the proposed method and other published spectrophotometric methods was presented in Table 7. It is clear from the table that most of the published spectrophotometric methods (Misiuk et al., 2001; Starczewska 2000; Susmitha et al., 2013) were extractive in nature. They used buffer solutions and organic solvents (chloroform, butanol, dichloroethane) for extraction and analyses purposes. These methods involved more steps prior to analysis which made methods tedious and expensive. The proposed method utilized 2 min of analysis time at room temperature and avoided the use of any organic solvents. The proposed method was sensitive as acquired higher molar absorptivity except 2 methods, one with Nb(V) (Misiuk et al., 2001) and another with picryl chloride (Hussein et al., 1989). The limit of quantification of the proposed method is less than the reference method. Additionally, the value of molar absorptivity of the proposed method is greater than those of reference method which indicated the higher sensitivity of the proposed method. Based on the above merits, it is concluded that the proposed method is simple, sensitive and inexpensive.
S.No.
Reagents
Temperature (℃)
Analysis time (min)
λmax (nm)
Linearity (μg mL−1) & molar absorptivity (L mol−1cm−1)
References
1
IMP base + 2,3-dichloro-5,6-dicyano-p-benzoquinone
25 ± 1
Pre-treatment time (1 h)
460
10–60 & 4.15 × 10³
Abdel-Salam et al., 1985
2
IMP base + Picryl chloride in chloroform
25 ± 1
Pre-treatment time (1 h)
395
0.1–1.0 & 5.84 × 10⁵
Hussein et al., 1989
3
IMP + ammonium metavanadate + 6 M sulphuric acid
25 ± 1
1.0
620
0.6–40 & 2.24 × 10⁴
Misiuk 2000
4 (a)
IMP + ammonium peroxidisulfate + 1 M phosphoric acid
25 ± 1
1.0
658
10–110 & 3.30 × 10³
Misiuk et al., 2001
(b)
IMP + 2.0 M sulphuric acid + 1.2 M NH4SCN + 1.5 × 10⁻⁴ M Nb(V) + Mixed well and left for 5 min. Extracted in mixture of n-butanol-chloroform (9:1).
25 ± 1
7.0
350
0.8–8 & 6.42 × 10⁴
Misiuk et al., 2001
5
IMP & eriochrome cyanine R solutions in separatory funnel and extracted in n-butanol
25 ± 1
5.0
520
10–80 & 6.78 × 10³
Starczewska 2000
6 (a)
IMP, bromothymol blue & pH 2.8 sodium acetate-HCl buffer solutions and extracted in chloroform.
25 ± 1
5.0
415
2.5–25 & 1.93 × 10⁴
Susmitha et al., 2013
(b)
IMP, bromophenol blue & pH 2.5 sodium acetate-HCl buffer solutions and extracted in chloroform.
25 ± 1
5.0
415
3.0–25 & 1.75 × 10⁴
Susmitha et al., 2013
(c)
IMP, bromocresol green and pH 3.5 sodium acetate-HCl buffer solutions and extracted in chloroform.
25 ± 1
5.0
415
2.5–25 & 2.05 × 10⁴
Susmitha et al., 2013
(d)
IMP, bromocresol purple and pH 2.5 sodium acetate-HCl buffer solutions and extracted in chloroform.
25 ± 1
5.0
415
2.5–25 & 1.99 × 10⁴
Susmitha et al., 2013
(e)
IMP and I2 reacted in dichloroethane.
25 ± 1
5.0
366
2.5–25 & 2.05 × 10⁴
Susmitha et al., 2013
(f)
IMP, KMnO4 & 0.045 M NaOH solutions.
25 ± 1
5.0
610
3.0–25 & 2.10 × 10⁴
Susmitha et al., 2013
7
IMP and K2Cr2O7 in sulfuric acid.
25 ± 1
2.0
620
1.0–14 & 2.25 × 10⁴
This work
4 Conclusions
A simple spectrophotometric method has been developed involving a cheap reagent. Beer’s law is obeyed over the concentration range of 1.0–14.0 μg mL−1 with a molar absorptivity of 2.25 × 10⁴ Lmol−1 cm−1. The proposed method was not interfered by the common excipients of tablet formulations in tablets (solid materials). The results of the proposed method were in good agreement with those of reference method and showed good compliance with regulatory guidelines. Hence, it is recommended that the proposed method could be used as an alternative method in pharmaceutical industries, hospitals and academic institutions for routine analysis of active imipramine HCl in pharmaceutical formulations and biological fluids.
Acknowledgements
This research was supported by Researchers Supporting Project number (RSP-2022/249), King Saud University, Riyadh, Saudi Arabia. The authors are also grateful to the higher-up and the Vice Chancellor of the University of Technology and Applied Sciences (Higher College of Technology) Muscat, Sultanate of Oman for support to carry out this work.
Conflict of interest
The authors declare no conflict of interest.
Declaration of Competing Interest
The authors declare that they have no known competing financial interests or personal relationships that could have appeared to influence the work reported in this paper.
References
- Spectrophotometric determination of some tranquilizers and antidepressants using 2,3-dichloro 5,6-dicyno-p-benzoquinone. Anal. Lett.. 1985;18:1391-1403.
- [Google Scholar]
- Review on pharmaceutical impurities, stability studies and degradation products. Rev. Adv. Sci. Eng.. 2013;2:155-166.
- [Google Scholar]
- Utility of eosin Y as a complexing reagent for the determination of citalopram hydrobromide in commercial dosage forms by fluorescence spectrophotometry. Luminescence. 2015;30(8):1352-1359.
- [Google Scholar]
- Development and validation of fluorescence spectrophotometric method: Quantitation of chlorpheniramine maleate in pharmaceutical formulations. J. Mol. Liq.. 2017;243:750-760.
- [Google Scholar]
- Azmi S.N.H., Al-Hattali M.K., Al-Hinai R.K., Al-Ajmi I.M., 2017b. A new spectrofluorimetric approach for the quantitation of imipramine HCl in commercial dosage forms. Journal of Advanced Pharmaceutical Science and Technology 1, 29-47.
- Optimization for synthesis of silver nanoparticles through response surface methodology using leaf extract of Boswellia sacra and its application in antimicrobial activity. Env. Monit. Assess.. 2021;193:497.
- [Google Scholar]
- Adsorptive removal of Pb(II) ions from groundwater samples in Oman using carbonized Phoenix dactylifera seed (Date seed) Journal of King Saud University-Science. 2020;32:2931-2938.
- [Google Scholar]
- Quantitative analysis of cefixime via complexation with palladium(II) in pharmaceutical formulations by spectrophotometry. J. Pharm. Anal.. 2013;3(4):248-256.
- [Google Scholar]
- British National Formulary 81, Chapter 4: Nervous System, Royal Pharmaceutical Society, UK, March-September 2021, p. 396.
- B. Pharmacopoeia vol. I, Her, Majesty Stationary Office 2018 London, UK 1290 1291
- Canada Health Protection Branch, Drugs Directorate guidelines, Acceptable Methods, Ministry of National Health and Welfare, 1992 (Draft).
- Optimization of stability indicating RP-HPLC method for the estimation of an antidepressant agent’s alprazolam and imipramine in pure & pharmaceutical dosage form. Eurasian J. Anal. Chem.. 2016;11:101-113.
- [Google Scholar]
- Goodman and Gilman’s The Pharmacological Basis of Therapeutics, 12th edition, McGraw-Hill, New York, 2010.
- Reappraisal of hypothesis testing for method validation: detection of systematic error by comparing the means of two methods or of two laboratories. Anal. Chem.. 1995;67(24):4491-4499.
- [Google Scholar]
- Identification of metabolic pathways involved in the biotransformation of eslicarbazepine acetate using UPLC-MS/MS, human microsomal enzymes and in silico studies. J. King Saud Univ. Sci.. 2021;33(2):101281.
- [CrossRef] [Google Scholar]
- Spectrophotometric determination of some dibenzazepines with picryl chloride. Talanta. 1989;36(11):1147-1149.
- [Google Scholar]
- International Conference on Harmonization, 1995. Food and Drug Administration, ICH Harmonised Tripartite Guideline-Text on Validation of Analytical Procedures. Rockville, MD, USA. Fed. Regist. 60, 11260.
- Utilization of mesna as a complexing reagent and determination of Ni(II) by spectroscopic methods. Adv. Sci. Lett.. 2012;10:61-71.
- [Google Scholar]
- Antidepressant’s determination using electroanalytical approach: a review of methods. J. Pharm. Biomed. Anal.. 2021;114:365.
- [Google Scholar]
- J.C. Miller J.N. Miller Errors in instrumental analysis; regression and correlation Statistics for analytical chemistry 1993 Third edition, Ellis Horwood and Prentice Hall, England, p. 119.
- Spectrophotometry assay of imipramine and desipramine using ammonium metavanadate and its application to pharmaceutical preparations. J. Pharm. Biomed. Anal.. 2000;22(1):189-196.
- [Google Scholar]
- Spectrophotometric determination of imipramine hydrochloride using ammonium peroxidisulfate and niobium(V) thiocyanate complex. Anal. Lett.. 2001;34(2):201-209.
- [Google Scholar]
- Oenning A.L., Birk L., Eller S., Franco de Oliveira T., Merib J., Carasek E., 2020. A green and low-cost method employing switchable hydrophilicity solvent for the simultaneous determination of antidepressants in human urine by Journal of Chromatography B 122069 1143,
- Analysis of tricyclic antidepressants in pharmaceuticals by microemulsion liquid chromatography. Microchem. J.. 2021;160:105659.
- [CrossRef] [Google Scholar]
- The importance of impurity analysis in pharmaceutical products: an integrated approach. Accred. Qual. Assur.. 2006;11(1-2):69-74.
- [Google Scholar]
- Spectrofluorimetric method for the determination of doxepin hydrochloride in commercial dosage forms. AAPS PharmSci Tech.. 2009;10:1381-1387.
- [Google Scholar]
- Kinetic spectrophotometric method for the determination of norfloxacin in pharmaceutical formulations. Eur. J. Pharm. Biopharm.. 2004;57(2):359-367.
- [Google Scholar]
- Rahman, N., Haque, Sk.M., Azmi, S.N.H., Rahman, H., 2017. Optimized and validated spectrophotometric methods for the determination of amiodrone hydrochloride in commercial dosage forms using N-bromosuccinimide and bromothymol blue, J. Saudi Chem. Soc., 21, 25-34.
- Experimental design approach in the optimization of potentiometric method for lansoprazole determination using lansoprazole-tungstate based ion-selective electrode. Ind. Eng. Chem. Res.. 2018;57(29):9351-9361.
- [Google Scholar]
- Application of Box-Behnken design and desirability function in the optimization of spectrophotometric method for the quantification of WADA banned drug: Acetazolamide. J. Mol. Liq.. 2019;274:270-277.
- [Google Scholar]
- Spectroscopic study on the interaction of haloperidol and 2,4-dinitrophenylhydrazine and its application for the quantitation in drug formulations. Anal. Chem. Lett.. 2016;6:874-885.
- [Google Scholar]
- Optimized and validated spectrophotometric methods for the determination of lisinopril in pharmaceutical formulations using ninhydrin and ascorbic acid. J. Braz. Chem. Soc.. 2005;16(5):1001-1009.
- [Google Scholar]
- Desmopressin, imipramine and oxybutynin in the treatment of primary nocturnal enuresis: A randomized clinical trial. Iran Red Crescent Med. J.. 2015;17(7)
- [CrossRef] [Google Scholar]
- Analytical techniques in pharmaceutical analysis: a review. Arabian J. Chem.. 2017;10:S1409-S1421.
- [Google Scholar]
- 14: Application of ultraviolet-visible molecular absorption spectroscopy. In: Principles of Instrumental Analysis (6th ed.). Cole: Thomson-Brooks; 2007. p. :385-386.
- [Google Scholar]
- Spectrophotometric studies and application of imipramine-eriochrome cyanine R system for determination of imipramine in pharmaceuticals. J. Pharm. Biomed. Anal.. 2000;23(2-3):383-386.
- [Google Scholar]
- Spectrophotometric determination of imipramine HCl in pure and pharmaceutical forms. Der Pharma Chemica. 2013;5:271-279.
- [Google Scholar]
- Experience of medical treatment with desmopressin and imipramine in children with severe primary nocturnal enuresis in Taiwan. Res. Rep. Urol.. 2019;11:283-289.
- [Google Scholar]
- Analytical method development and validation for simultaneous estimation of imipramine and diazepam in tablet dosage form by RP-HPLC. Int. J. Pharm. Pharm. Sci.. 2013;5:249-253.
- [Google Scholar]
- Transfer of TLC screening methods for azithromycin, imipramine HCl and sulfadoxime + pyrimethamine tablets to quantitative HPTLC-densitometry. J. Liq. Chromatogr. Relat. Technol.. 2016;39:277-280.
- [Google Scholar]
Appendix A
Supplementary data
Supplementary data to this article can be found online at https://doi.org/10.1016/j.jksus.2022.101823.
Appendix A
Supplementary data
The following are the Supplementary data to this article:


