

Translate this page into:
Determination of structural lineaments of Northeastern Laos using the LTHG and EHGA methods
⁎Corresponding author. dr_a.eldosoky@yahoo.com (Ahmed M. Eldosouky) ahmed.eldosouky@sci.suezuni.edu.eg (Ahmed M. Eldosouky)
-
Received: ,
Accepted: ,
This article was originally published by Elsevier and was migrated to Scientific Scholar after the change of Publisher.
Peer review under responsibility of King Saud University.
Abstract
The LTHG and EHGA methods are enhancement versions of the gradient amplitude and can outline the edges of shallow and deep anomalous bodies simultaneously. Recently, these techniques have been used in approximating the edges of gravity and magnetic data. In this paper, we apply the LTHG and EHGA methods to the gravity dataset from the global gravity model WGM2012 to extract structural features of Northeastern Laos that appear as lineaments on transformed data maps. We also apply the tilt depth method to this dataset to estimate the depth of these lineaments. The findings showed that most of structures identified in Northeastern Laos are trending in the ENE-WSW, NE-SW, E-W, WNW-ESE and N-S directions with the depth ranging from 1.3 to 2.1 km.
Keywords
Gravity
WGM2012
LTHG
EHGA
Northeastern Laos

1 Introduction
The study area is located in Northeastern Laos (Fig. 1a). It lies within the northern part of the Truong Son Fold Belt where there are several significant mineral deposits particularly gold and copper. The Truong Son Fold Belt is bounded by the Tam Ky-Phuoc Son suture zone to the south and Song Ma suture to the north (Huan et al., 2021). The belt developed through subduction and collision between the South China and Indochina blocks, with four main Paleozoic-Early Mesozoic episodes of magmatism having been identified (Hou et al., 2019). The study area contains important information for unraveling the tectonic setting of the Song Ma tectonic zone in North Laos and answering questions about the tectonic linkage of the different tectonic zones in the northern Indochina and southern South China blocks. Herein, we aim to contribute to the understanding of the nature of structural features of Northeastern Laos by analyzing Bouguer gravity anomalies. Several global gravity models have been developed according to new data sets to improve the understanding of the geodynamical and geological processes of the Earth (Bonvalot et al. 2012; Sandwell et al., 2014; Melouah et al., 2021). The new gravity models with high accuracy can be used for detection of structural features of Northeastern Laos.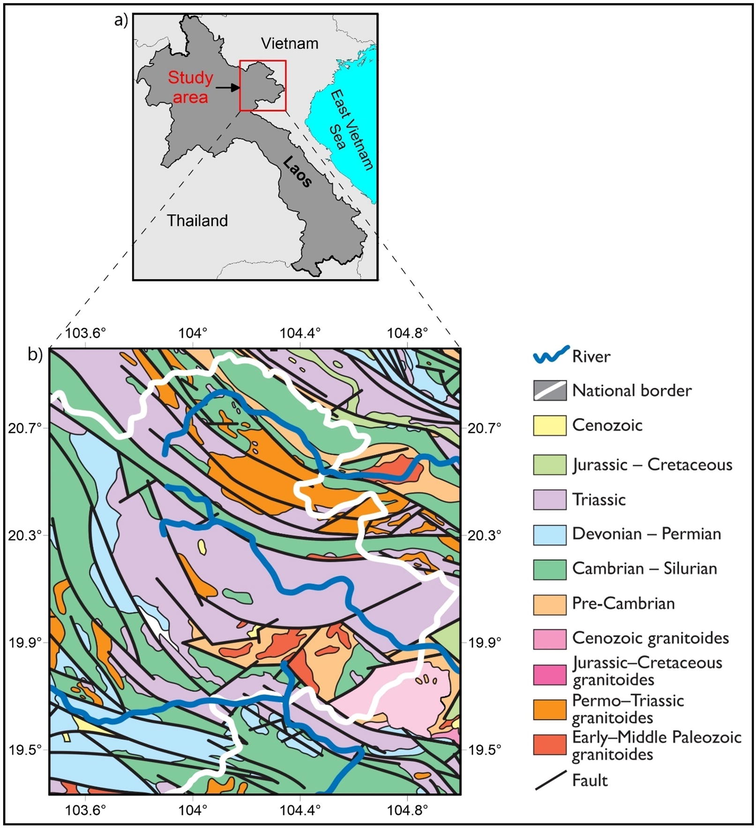
(a) Location of the study area, (b) Geology map of Northeastern Laos and adjacent areas (modified from Fyhn et al., 2019).
The horizontal boundaries of the sources have a decisive role in interpreting gravity and magnetic data and constraining the subsurface models (Pilkington and Tschirhart, 2017; Castro et al., 2018; Sehsah et al., 2019; Eldosouky et al., 2020a,b,c; Oksum et al., 2019). These are important in detecting boundaries of geological formations and understanding the structural settings (Eldosouky, 2019; Pham 2020, 2021; Ghomsi et al., 2021). Many edge detection methods are presented to recognize the source edges; most of them are based on the horizontal and vertical derivatives of potential field data (Ferreira et al., 2013; Narayan et al., 2017; Nasuti et al., 2019; Pham et al., 2018a,b; 2021a,b). The total horizontal gradient method (Cordell, 1979) is one of the most commonly used methods for interpreting potential field data. The total gradient is another popular method used to extract the boundaries of subsurface structures (Nabighian, 1984). The disadvantage of these methods is their poor performance in balancing the amplitudes of anomalies produced by the causative bodies located at different depths simultaneously (Le et al., 2020; Pham et al., 2021c,d,e,f). In order to simultaneously display the edges of the shallow and deep sources, a wide range of phase based methods have been developed. For instance, Miller and Singh (1994) introduced the tilt angle filter that use the inverse tangent function of the ratio between the vertical derivative and total horizontal gradient. Verduzco et al. (2004) calculated the total horizontal gradient of the tilt angle, and showed that this filter is more effective than the tilt angle in enhancing the source edges. Wijns et al. (2005) proposed the theta filter that uses the total horizontal gradient to normalize the total gradient. Cooper and Cowan (2006) used a normalized version of the total horizontal gradient. Ferreira et al. (2013) introduced another enhanced version of the total horizontal gradient, called the tilt angle of the horizontal gradient. Pham et al. (2019, 2020a) presented the LTHG and EHGA methods that employ respectively the logistic and inverse sine functions to improve the THG method. Apart from the filters mentioned above, many other filters also can be used to detect the source edges. (Fedi and Florio, 2001; Fedi, 2002; Cella et al., 2009; Tatchum et al., 2011; Pham et al., 2020b, 2021f; Oksum et al., 2021b; Melouah and Pham, 2021).
In this paper, the LTHG, EHGA and the tilt depth techniques have been applied to gravimetry data from the high-resolution global gravity model WGM2012 to outline the geological features of Northeastern Laos. The findings bring a better understanding of structural features of Northeastern Laos.
2 Geological setting
The Indochina Peninsula is an excellent example of the Cenozoic evolution in Southeast Asia (Takemoto et al., 2009). The Indochina Peninsula has been subdivided into the Truong Son fold belt, Loei fold belt, Song Ma terrane, Khorat terrane and the Kontum massif based on distinctive tectonostratigraphic and magmatic histories (Thassanapak et al., 2018). The Truong Son fold belt is a NW-trending fault and orogenic belt, running from central Vietnam to central Laos (Sanematsu et al., 2011). The Truong Son fold belt is dominated by dextral strike-strip faults and shear zones within this belt are characterized by mylonitization and high-temperature metamorphism which occurred from 250 Ma to 240 Ma (Sanematsu et al., 2011). It is an important Fe-Cu-Sn-Au polymetallic ore district (Hou et al., 2019). Precambrian to Cenozoic strata are distributed throughout the belt, and contain mainly marine or continental sediments.
The study area is located in the northern part of the Truong Son Fold Belt. Fig. 1b shows the geological map of the study area (modified from Fyhn et al., 2019). The structural geology of the area is complicated with many major NW-SE and E-W trending faults that represent the main dividing boundaries of zones and tectonic regions. Lower Paleozoic sillimanite schists, Devonian sand and siltstones cover much of Northeastern Laos (Fig. 1b). These deposits are overlain by Triassic sediments, Upper Devonian–Permian limestones and siliciclastics (Fyhn et al., 2019). Ordovician–Silurian granitoids/orthogneisses and Permo–Triassic granitoids and effusive rocks are also common in Northeastern Laos (Lepvrier et al., 2008; Fyhn et al., 2019). Some rocks of Early – Middle Paleozoic and Pre-Cambrian ages are also present in the study area (Fig. 1)
3 Data
The gravity dataset used in this study was generated from the WGM2012 model. The WGM2012 is a global gravity field model with high resolution, which contains data from EGM2008 and DTU10 models (Bonvalot et al. 2012). The gravity anomalies from the WGM2012 model include 1′ × 1′ resolution terrain corrections derived from ETOPO1 model that consider the contribution of most surface masses (atmosphere, land, oceans, inland seas, lakes, ice caps and ice shelves) (Bonvalot et al. 2012). The WGM2012 model has been realized by the International Gravimetic Bureau in collaborations with organizations such as the Commission for the Geological Map of the World, International Association of Geodesy, International Union of Geological Sciences and UNESCO (Bonvalot et al. 2012). The data is available from the International Gravimetic Bureau for download at https://bgi.obs-mip.fr/data-products/grids-and-models/wgm2012-global-model/#. Recently, the use of gravity data from the WGM2012 model in detecting geological structures has shown great success (Kahveci et al., 2019; Eldosouky et al., 2021; Elmas and Karslı, 2021). Fig. 2 shows the Bouguer data of Northeastern Laos. The data of range from −58 mGal to 93 mGal, with high amplitude signals appearing in the eastern part (Fig. 2).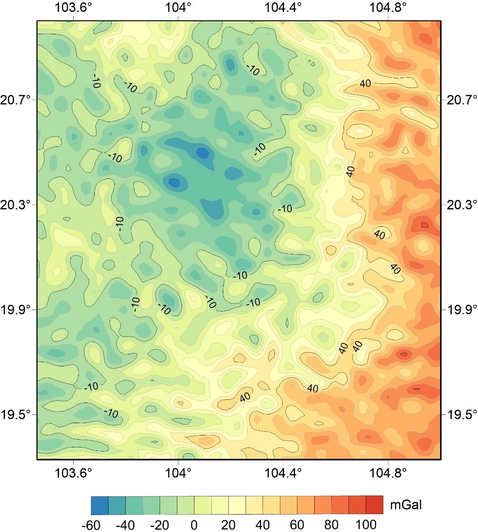
Bouguer gravity data of the study area.
4 Methods
The THG is one of the most commonly used detectors for detecting the edges of the geology structures. This detector is formulated as follows (Cordell, 1979):
The THG is less effective when the anomalous bodies are interfered by nearby sources. Pham et al. (2019) proposed the LTHG method for improving the performance of the THG method:
Another detector for approximating the edge is also developed by Pham et al. (2020a), which is based on the asin function and the THG derivatives. The detector is given by:
Salem et al. (2007) introduced the tilt depth method for estimating the depth to the top of magnetic sources. Oruc (2011) also developed another tilt depth method for interpreting gravity data. This technique uses the derivatives of the first vertical gradient of gravity anomaly and derives the relationship between the tilt angle
, horizontal location and depth of a vertical 2D contact model as
Eq. (4) show that the value of the tilt angle over the edges of the contact is 0° (h = 0) and equal to 45° when and –45° when . This suggests that tilt angle contours can be used to determine the horizontal location (θ = 0°) and depth (half distance between ±45° contours) of sources (Oruc, 2011).
5 Results
We generated a gravity model (Fig. 3a) to evaluate the applicability of the THG detector and its enhanced versions. The gravity anomalies of the model are shown in Fig. 3b. Fig. 4a displays the THG of the anomaly data in Fig. 3a. It is observed from this figure that the THG method brings clear images for the edges for the source D, but responses from the bodies A, B and C are blurred. Fig. 4b displays the edges estimated from applying the LTHG method to the anomaly in Fig. 4a. It is seen that the maxima of the LTHG are located directly over the source edges, and the results are more sharp-cut responses over the source boundaries than those from the THG method. Fig. 4c displays the edges determined from using the EHGA technique. Similar to the LTHG detector, the EHGA detector equalized the anomalies of shallow and deep bodies. This method provided a boundary map having a higher resolution than the THG method.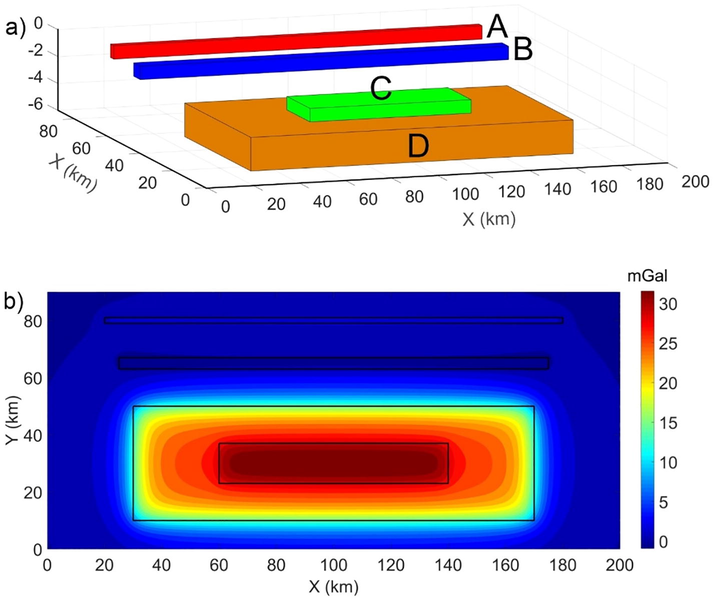
(a) 3D view of the model, (b) Gravity anomaly.
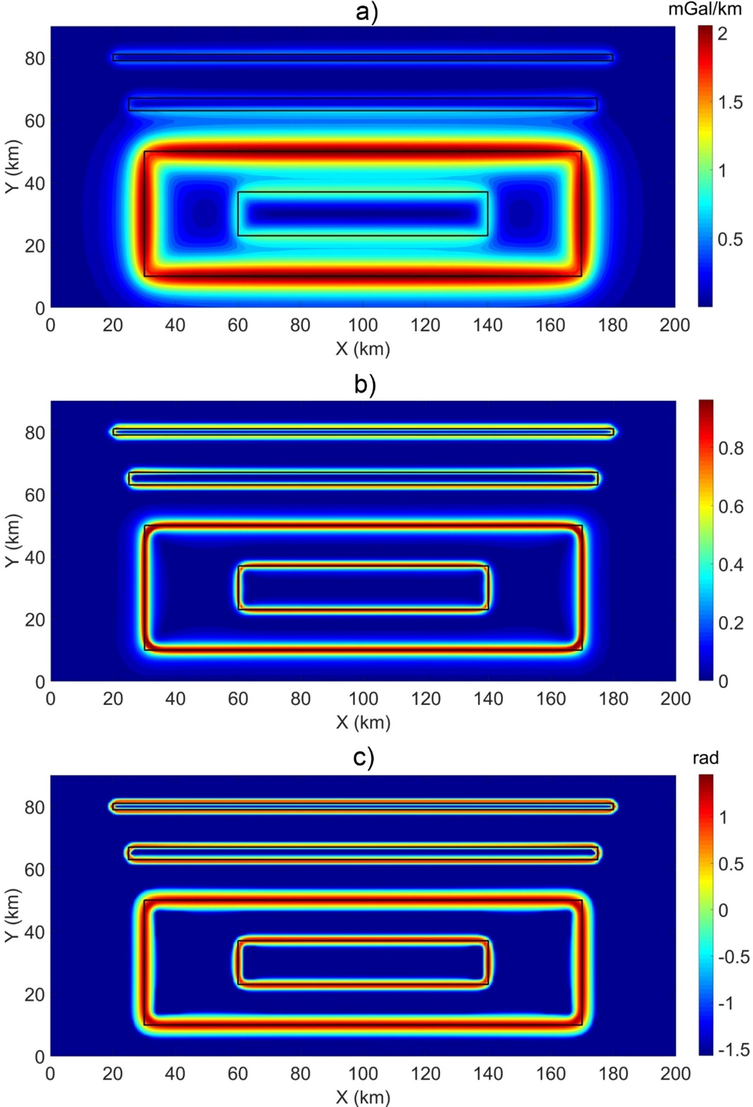
Gravity data of Fig. 3b processed by (a) THG, (b) LTHG with α = 3, (c) EHGA with k = 2.
Fig. 5a displays the boundaries determined by applying the THG detector to the gravity of Northeastern Laos. In the THG filter result, it is seen that the edges of the more significant amplitude anomalies prevailing in the eastern and southern regions of the area are prominent. The THG method cannot balance gravity different anomalies, making it less effective in approximating the edges of the deep structures. Fig. 5b shows the edges outlined by applying the LTHG method to gravity data. As shown in the model example, the peaks of the LTHG function are located directly over the boundaries of geological structures. It is seen from this figure that a large number of boundaries are delineated by this method. The method emphasizes shallow and deep surface features with different wavelengths. Fig. 5c illustrates the map obtained by applying the EHGA technique to the Bouguer gravity data. It is observed from this figure that the method provides a uniform gain for all transformed data, and they represent the signatures of geology due to density variations.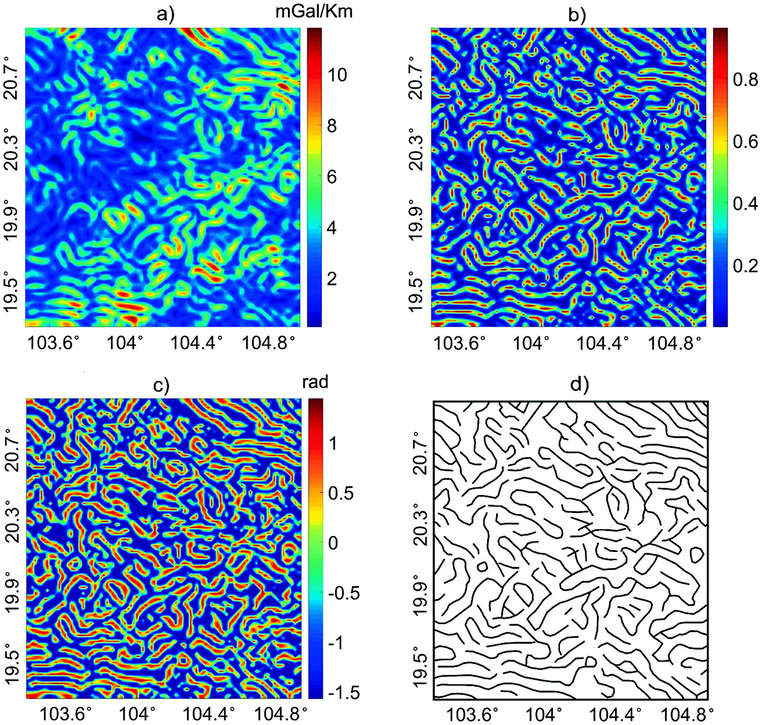
Gravity data of Fig. 2 processed by (a) THG, (b) LTHG with α = 3, (c) EHGA with k = 2, (d) Gravity lineaments extracted from the gravity LTHG and EHGA maps.
6 Discussion
It is clearly seen from Fig. 5a that the THG emphasizes shallow geological features with relatively short wavelengths. The reason is that this technique uses the gradient amplitudes of gravity anomaly. The LTHG and EHGA techniques are based on the ratio of the derivative amplitudes of data, therefore they can emphasize both short and long wavelengths. In other words, the LTHG and EHGA methods are effective in balancing different anomalies, and they provide clearer geological features than the THG. It can be noted that the LTHG and EHGA methods provided more sharp-cut responses over the edges of geology structures compared to the THG and other methods. Since the LTHG and EHGA methods produced clearer images than those from the THG method, we used these methods to determine the lineaments of Northeastern Laos. Fig. 5d shows the lineaments extracted from the LTHG and EHGA maps (Fig. 5b and c). The major structural features in Northeastern Laos are oriented in the NW-SE, E-W, WNW-ESE and ENE-WSW directions with the predominant trend being the NW-SE.
To detect the depth of the lineaments, we used the tilt depth method (Oruc, 2011). The major advantages of this method are that it does not depend on the structural index or the window size. In addition, the tilt depth method does not require a mean depth or low-pass filtering as the frequency methods. Fig. 6 shows the result of application of the tilt depth method to the Bouguer gravity data. Fig. 7 shows the histogram of the depth estimates obtained from the tilt depth method. It can be seen from Figs. 6 and 7 that the depth of most of the lineaments varies from 1.3 km to 2.1 km. For comparison, the lineaments in Fig. 5d are superimposed on the tilt depth map. We can see that the majority of solutions are trending in the NW-SE, E-W, WNW-ESE and ENE-WSW directions. Clearly, the positions of source points are mostly correlated with the lineaments determined by the LTHG and EHGA methods. The presence of the gravity lineaments in the eastern and southern parts of Northeastern Laos (Fig. 5d) is verified by the signals of the THG (Fig. 5a). We can see that many gravity lineaments match with geological features of Northeastern Laos. The lineaments illustrate a good correlation with the NW-SE trending faults in the northern and southeastern parts of the area. The lineaments also coincide with some E-W trending faults in the southwestern part of the area. We anticipate that the dominant NW-SE trending boundaries determined by the edge filters are related to the same tectonic activity that might be originated due to the collision of Indochina and South China.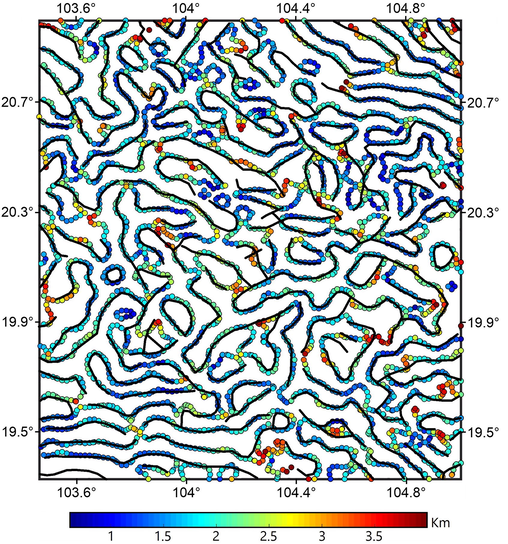
Depth estimates obtained by the tilt depth method. Gravity lineaments from Fig. 5d are superimposed on the tilt depth map.
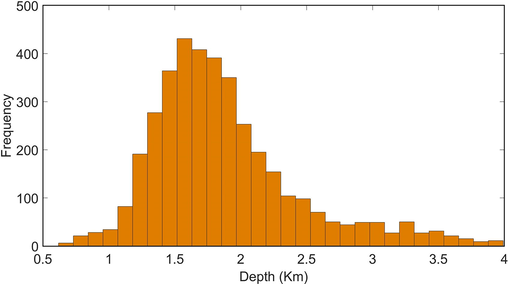
The histogram of the depth obtained from the tilt depth method.
7 Conclusions
The LTHG and EHGA methods were applied to gravity data to outline structural features of Northeastern Laos. The tilt depth technique was also used to detect the depth of gravity lineaments. Various structures were identified in the Northeastern Laos by the interpretation results of Bouguer anomaly. Our findings showed that most of the lineaments outlined in the Northeastern Laos are trending in the ENE-WSW, NE-SW, E-W, WNW-ESE and N-S directions with the predominant trend being the NW-SE. The depth of these lineaments ranges from 1.3 to 2.1 km. The obtained lineaments match with geological features of Northeastern Laos and provide valuable information for geophysicists to better understand the subsurface geological structures of the area.
Acknowledgement
Deep thanks and gratitude to the Researchers Supporting Project number (RSP-2022/351), King Saud University, Riyadh, Saudi Arabia for funding this research article.
Declaration of Competing Interest
The authors declare that they have no known competing financial interests or personal relationships that could have appeared to influence the work reported in this paper.
References
- In: Commission for the Geological Map of the World (eds) World gravity map. Paris: BGI-CGMW-CNES-IRD; 2012.
- Combining tilt derivative filters: new approaches to enhance magnetic anomalies. Braz. J. Geoph.. 2018;36(3):335-343.
- [Google Scholar]
- Toward a full multiscale approach to interpret potential fields. Geophys. Prospect.. 2009;57(4):543-557.
- [Google Scholar]
- Enhancing potential field data using filters based on the local phase. Comput. Geosc.. 2006;32(10):1585-1591.
- [Google Scholar]
- Cordell, L., 1979. Gravimetric expression of graben faulting in Santa Fe Country and the Espanola Basin. New Mexico Geol. Soc. Guidebook, 30th Field Conf., New Mexico, 59–64.
- Aeromagnetic data for mapping geologic contacts at Samr El-Qaa area, North Eastern Desert, Egypt. Arab. J. Geosci.. 2019;12:2.
- [Google Scholar]
- Integrating aeromagnetic data and Landsat-8 imagery for detection of post-accretionary shear zones controlling hydrothermal alterations: The Allaqi-Heiani Suture zone, South Eastern Desert, Egypt. Adv. Space Res.. 2020;65(3):1008-1024.
- [Google Scholar]
- Enhancing linear features in aeromagnetic data using directional horizontal gradient at Wadi Haimur area, South Eastern Desert, Egypt. Carpathian J. Earth Environ. Sci.. 2020;15(2):323-326.
- [Google Scholar]
- A comparative study of THG, AS, TA, Theta, TDX and LTHG techniques for improving source boundaries detection of magnetic data using synthetic models: a case study from G. Um Monqul, North Eastern Desert. J. Afr. Earth Sci.. 2020;170:103940.
- [CrossRef] [Google Scholar]
- Eldosouky A.M., Pham L.T., El-Qassas R.A.Y., Hamimi Z., Oksum E., 2021. Lithospheric Structure of the Arabian–Nubian Shield Using Satellite Potential Field Data. In: Hamimi Z., Fowler AR., Liégeois JP., Collins A., Abdelsalam M.G., Abd EI-Wahed M. (eds) The Geology of the Arabian-Nubian Shield. Regional Geology Reviews. Springer, Cham.
- Tectonic and crustal structure of Archangelsky ridge using Bouguer gravity data. Mar. Geophys. Res.. 2021;42:21.
- [Google Scholar]
- Detection of potential fields source boundaries by enhanced horizontal derivative method. Geophys. Prospect.. 2001;49:40-58.
- [Google Scholar]
- Multiscale derivative analysis: A new tool to enhance gravity source boundaries at various scales. Geophys. Res. Lett.. 2002;29
- [Google Scholar]
- Enhancement of the total horizontal gradient of magnetic anomalies using the tilt angle. Geophysics. 2013;78(3):J33-J41.
- [Google Scholar]
- Detrital zircon ages and heavy mineral composition along the Gulf of Tonkin - Implication for sand provenance in the Yinggehai-Song Hong and Qiongdongnan basins. Mar. Pet. Geol.. 2019;101:162-179.
- [Google Scholar]
- Geology, Geochronology, and Hf Isotopic Composition of the Pha Lek Fe Deposit, Northern Laos: Implications for Early Permian Subduction-Related Skarn Fe Mineralization in the Truong Son Belt. J. Earth Sci.. 2019;30(1):109-120.
- [Google Scholar]
- Paleogene granite magmatism in the north of the Truong Son belt and implication for crustal evolution. Vietnam J. Earth Sci.. 2021;43(4):444-464.
- [Google Scholar]
- Main structural lineaments of the southern Cameroon volcanic line derived from aeromagnetic data. J. Afr. Earth Sci.. 2021;186:104418.
- [CrossRef] [Google Scholar]
- Subdividing the tectonic elements of Aegean and Eastern Mediterranean with gravity and GPS data. Acta Geophys.. 2019;67(2):491-500.
- [Google Scholar]
- Estimating Effectiveness of Some Methods for Detecting Edge of Potential Field Sources. VNU J. Sci.. 2020;36(4):99-115.
- [Google Scholar]
- Improved ILTHG method for edge enhancement of geological structures: application to gravity data from the Oued Righ valley. J. Afr. Earth Sci.. 2021;177:104162
- [Google Scholar]
- Melouah, O., Eldosouky, A.M.,Ebong, W.D., 2021. Crustal architecture, heat transfer modes and geothermal energy potentials of the Algerian Triassic provinces, Geothermics, Volume 96, 102211, ISSN 0375-6505, https://doi.org/10.1016/j.geothermics.2021.102211.
- Potential field tilt a new concept for location of potential field sources. J. Appl. Geophys.. 1994;32(2-3):213-217.
- [Google Scholar]
- Toward a three-dimensional automatic interpretation of potential field data via generalized Hilbert transforms— fundamental relations. Geophysics. 1984;49(6):780-786.
- [Google Scholar]
- STDR: a novel approach for enhancing and edge detection of potential field data. Pure Appl. Geophys.. 2019;176(2):827-841.
- [Google Scholar]
- Delineation of structural features over a part of the Bay of Bengal using total and balanced horizontal derivative techniques. Geocarto Int.. 2017;32(4):351-366.
- [Google Scholar]
- Inverting gravity anomalies over the Burdur sedimentary basin. SW Turkey. Acta Geod. Geophys.. 2019;54(4):445-460.
- [Google Scholar]
- A novel approach based on the fast sigmoid function for interpretation of potential field data. Bull. Geophys. Oceanogr.. 2021;62(3):543-556.
- [Google Scholar]
- Edge Detection and Depth Estimation Using a Tilt Angle Map from Gravity Gradient Data of the Kozaklı-Central Anatolia Region, Turkey. Pure Appl. Geophys.. 2011;168:1769-1780.
- [Google Scholar]
- A comparative study on different filters for enhancing potential field source boundaries: synthetic examples and a case study from the Song Hong Trough (Vietnam) Arab. J. Geosci.. 2020;13(15):723.
- [Google Scholar]
- A high-resolution edge detector for interpreting potential field data: a case study from the Witwatersrand basin, South Africa. J. Afr. Earth Sci.. 2021;178:104190
- [Google Scholar]
- Determination of maximum tilt angle from analytic signal amplitude of magnetic data by the curvature-based method. Vietnam J. Earth Sci.. 2018;40(4):354-366.
- [Google Scholar]
- A new method for edge detection in interpretation of potential field data. J. Eng. Sci. Des.. 2018;6(4):637-642.
- [Google Scholar]
- Edge enhancement of potential field data using the logistic function and the total horizontal gradient. Acta Geod. Geophys.. 2019;54(1):143-155.
- [Google Scholar]
- A new high resolution filter for source edge detection of potential field data. Geocarto Int.. 2020;1–18
- [CrossRef] [Google Scholar]
- Enhancement of potential field source boundaries using an improved logistic filter. Pure Appl. Geophys.. 2020;177(11):5237-5249.
- [Google Scholar]
- Delineation of structural lineaments of the Southwest Sub-basin (East Vietnam Sea) using global marine gravity model from CryoSat-2 and Jason-1 satellites. Geocarto Int.. 2021;1–18
- [CrossRef] [Google Scholar]
- A comparative study on the peak detection methods used to interpret potential field data: A case study from Vietnam. Geocarto Int. 2021
- [CrossRef] [Google Scholar]
- Mapping subsurface structural lineaments using the edge filters of gravity data. J. King Saud Univ. Sci.. 2021;33(8):101594.
- [CrossRef] [Google Scholar]
- Performance evaluation of amplitude- and phase based methods for estimating edges of potential field sources. Iran J. Sci. Technol. Trans. Sci.. 2021;45(4):1327-1339.
- [Google Scholar]
- Application of the improved parabola-based method in delineating lineaments of subsurface structures: A case study. J. King Saud Univ. Sci.. 2021;33(7):101585.
- [CrossRef] [Google Scholar]
- Edge detection of potential field sources using the softsign function. Geocarto Int.. 2021;1–14
- [CrossRef] [Google Scholar]
- Practical considerations in the use of edge detectors for geologic mapping using magnetic data. Geophysics. 2017;82(3):J1-J8.
- [Google Scholar]
- Tilt-depth method: A simple depth estimation method using first-order magnetic derivatives. Lead. Edge. 2007;26(12):1502-1505.
- [Google Scholar]
- New global marine gravity model from CryoSat-2 and Jason-1 reveals buried tectonic structure. Science. 2014;346(6205):65-67.
- [Google Scholar]
- 40Ar/39Ar ages of granitoids from the Truong Son fold belt and Kontum massif in Laos. J. Mineral. Petrol. Sci.. 2011;106(1):13-25.
- [Google Scholar]
- Unpaired ophiolite belts in the Neoproterozoic Allaqi-Heiani Suture, the Arabian-Nubian Shield: Evidences from magnetic data. J. Afr. Earth Sci.. 2019;156:26-34.
- [Google Scholar]
- Tectonic deformation of the Indochina Peninsula recorded in the Mesozoic palaeomagnetic results. Geophys. J. Int.. 2009;179(1):97-111.
- [Google Scholar]
- A gravity model study for differentiating vertical and dipping geological contacts with application to a bouguer gravity anomali over the foumban shear zone. Cameroon. Geophysica. 2011;47(1–2):43-55.
- [Google Scholar]
- Silurian radiolarians from the Sepon Mine, Truong Son Terrane, central Laos and their palaeogeographic and tectonic significance. Geol. Mag.. 2018;155(8):1621-1640.
- [Google Scholar]
- New insights into magnetic derivatives for structural mapping. Lead. Edge. 2004;23(2):116-119.
- [Google Scholar]
Appendix A
Supplementary data
Supplementary data to this article can be found online at https://doi.org/10.1016/j.jksus.2022.101825.
Appendix A
Supplementary data
The following are the Supplementary data to this article:


