

Translate this page into:
Date pits extracts assisted synthesis of magnesium oxides nanoparticles and its application towards the photocatalytic degradation of methylene blue
⁎Corresponding author at: UNESCO-UNISA Africa Chair in Nanosciences/Nanotechnology, College of Graduate Studies, University of South Africa (UNISA), Muckleneuk Ridge, P.O. Box 392, Pretoria, South Africa. sackey@tlabs.ac.za (J. Sackey)
-
Received: ,
Accepted: ,
This article was originally published by Elsevier and was migrated to Scientific Scholar after the change of Publisher.
Peer review under responsibility of King Saud University.
Abstract
In the present work, a novel bio-synthesis of highly crystalline cubic MgO nanoparticles from aqueous extracts obtained from date pits is reported. The synthesised cubic MgO nanoparticles were annealed at 500 and 700 °C for 2 h in air. Characterization of the samples was carried out using various characterization techniques. To show the photocatalytic effectiveness of date pits mediated MgO nanoparticles, degradation ability with Methylene blue (MB) under visible irradiation was evaluated.
HRTEM analysis of the samples reveals a spherical-like structure of the nanoparticles while selected area electron diffraction and XRD patterns showed that the annealed nanoparticles are crystalline. The photocatalysis efficiency showed 64 and 52% degradation ability for MB of MgO nanoparticles annealed at 500 and 700 °C, respectively.
Keywords
Pollution
Photocatalysis
Date pits
MgO
Nanograins

1 Introduction
Textile industry contributes significantly to the world’s economy with its global worth determined to be 1 trillion American dollars. It generates employment opportunities to about 35 million people worldwide and boosts growth in the agricultural sector.
Regardless of its irrefutable significance and global impact, the textile industry is considered as one of the biggest channel for pollution worldwide. Amongst the environmental impacts caused by the industry, water pollution of effluents streams containing organic dyes which constituents 80% of the total emission produced by the industry is major environmental contamination Naciri et al. (2020a).
Organic dyes such as methylene blue, acid red 14, remazol red RR, reactive blue 19, methyl discharged into streams affect aquatic life and human health due to their degradation inefficiencies and toxicity Naciri et al. (2019). They present the challenge of being stable and persisting in the environment over a long period causing chronic diseases to organisms on exposure. It has become vital that such dyes be removed from effluents emanating from industries before being discharged into environments (Razanamahandry et al., 2018; Naciri et al., 2020b, 2020c, 2018; Hsini,et al. 2020).
In response to the SDG-6 call for clean and accessible water for all, researchers have used different conventional methods for removal of dye from wastewater. However, these methods are unproductive, ineffective, expensive and undesirable due to the strong chemicals involved Verma et al. (2012).
Recently, there is an exponential rise in the number of publications related to nanoparticles effectiveness in the degradation of organic dyes in wastewater (Bashir et al., 2019a; Sackey et al., 2020a; Tsegay et al., 2020).
Amongst the various metal oxides nanoparticles used for toxic wastewater remediation, magnesium oxide (MgO) has proven to show enhanced catalytic activity in the degradation of organic dyes Zou et al. (2008)
MgO is one of the common insulating oxides with better acid and basic properties and is widely used in fields, such as catalyst supports, and superconductors Liang and Gay (1986). At the nanoscale, MgO nanoparticles show high and different reactivities from conventionally prepared MgO toward adsorbed chemicals Klabunde et al. (2009).
Various synthesis routes and morphologies of MgO are reported. For instance, Li et al. (2016) synthesised MgO via the microemulsion based method and obtained a flower-like 3D hierarchical structure and well-defined MgO nanoparticles. Subramania et al. (2007) used a polyol-mediated thermolysis process to prepare MgO nanoparticles as well as nanowires. Subsequently, Ding et al. (2001) synthesised Mg(OH)2 via the hydrothermal process and obtained nanocrystallites with the rod, tube, needle, or lamella-like morphologies.
The chemical and physical methods mentioned above require sophisticated equipment, long preparation procedure, templates, surfactants, harmful toxic chemicals and is time-consuming. The use of a biocompatible, eco-friendly, non-toxic and inexpensive preparation method for synthesis of MgO nanostructures is a better alternative. Specifically, the preparation of metals oxides including MgO via green chemistry synthesis method using extracts from plant parts or agri-waste products as reducing agents has gained significant attention worldwide (Bashir et al., 2019b; Bakayoko et al., 2020; Fall et al., 2020). Owing to the unique metabolites in the extracts, bio-synthesis researches are extensively ongoing.
Date pit (see Fig. 1(a)) used as complementary feed materials for animals and poultry or as a conventional soil fertilizer is the by-product of Phoenix dactylifera. Reported phytochemicals including phenolics (See Fig. 1(b)), sterols, carotenoids, anthocyanins, procyanidins, and flavonoids contained in date pits are known to exhibit antioxidant, anticancer and antidiabetic potentials (Al-Farsi and Lee, 2008; Dowson, 1982; Baliga et al., 2011).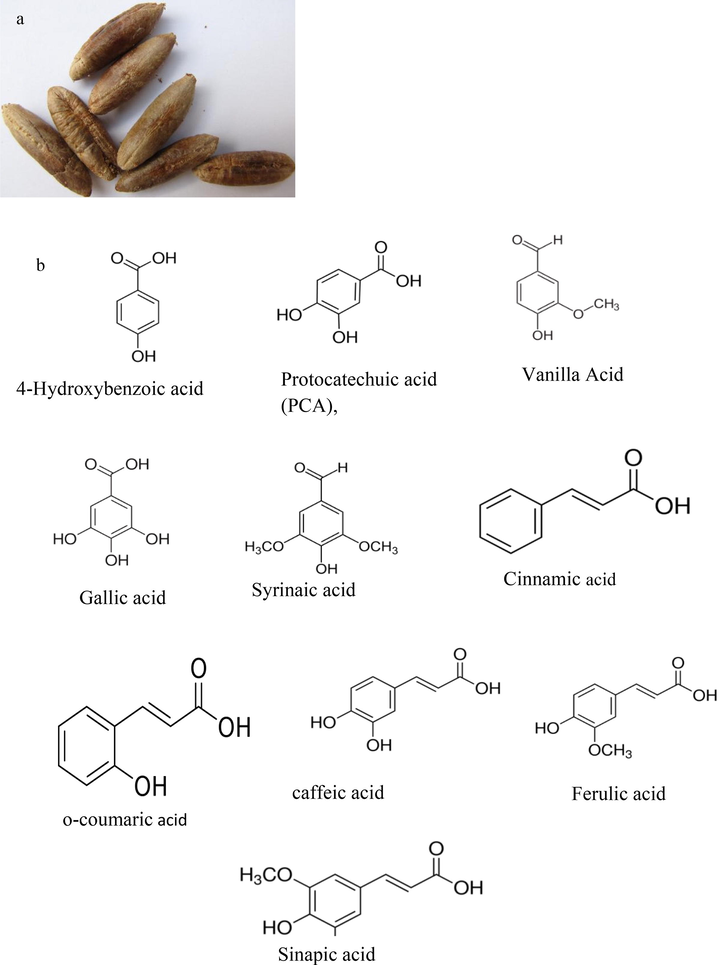
Showing image of (a) date pits used in the biosynthesis of MgO nanoparticles, (b) chemical structure of the phenolics contained in the date pits, (c) pictorial illustrations of biosynthesis process of MgO nanoparticles obtained from aqueous extracts of date pits.
Showing image of (a) date pits used in the biosynthesis of MgO nanoparticles, (b) chemical structure of the phenolics contained in the date pits, (c) pictorial illustrations of biosynthesis process of MgO nanoparticles obtained from aqueous extracts of date pits.
In our study, we synthesised single-phase cubic MgO nanoparticles via the green chemistry approach using extracts obtained from date pits. We report the physical, structural, and optical properties of our material. As a direct application, the MgO nanoparticles were instantly applied on Methylene blue (MB) under visible irradiation and its photocatalysis degradation efficiency is presented.
2 Materials and method
Magnesium acetate tetrahydrate (Mg(CH3COO)2·4H2O) of the analytical grade used as the precursor was purchased from Sigma –Aldrich. Dates were purchase from Cash ‘n’ Carry, Strand, South Africa. After eating the date fruits, the date pits were washed and air-dried; ready to be used for the synthesis. MgO nanoparticles were synthesised using aqueous extracts obtained from date pits via the green synthesis method described elsewhere Sackey et al., (2020b). Extraction of the aqueous solution is described as follows: a 30.0 g of date pits were brought to boil in distilled water (200 mL). A dusty yellow colour aqueous extracts with pH of 6 was obtained after filtration using Whatman filter paper (55 mm cat no 1820055). The extracts were kept at room temperature ready to be used for the synthesis.
Following the nanochemistry approach, bio-synthesis of MgO is explained below; in a typical experimental setup, a 2.0 g of the Mg (CH3COO)2·4H2O precursor was dissolved in 50 mL aqueous extracts of date pits. The mixture which recorded a pH of 8 was placed under continuous magnetic string for 2 h and afterwards kept in an oven at 100 °C to dry. The obtained cream-like precipitates were annealed at different temperatures of 500 and 700 °C in air for 2 h and characterized using SEM, EDS, HRTEM, XRD, Raman, ATR. For reproducibility, the experiment was repeated at least three times and at each run, there were no significant changes in the obtained results. The pictorial representation of biosynthesis of MgO nanoparticles using aqueous extracts of date pits is shown in Fig. 1(c).
The morphology and chemical compositions of samples were characterized by a high-resolution transmission electron microscopy (HRTEM) (Tecnai 720) and Zeiss Ultra plus 55 field emission scanning electron microscope (FE-SEM), operated at a voltage of 200 and 2.0 kV, respectively. Phase identification of the synthesised samples was characterized by X-ray diffraction (Bruker AXS D8 Advance) with radiation (λCukα = 1.5406 Å). A T64000 micro-Raman spectrometer which has a laser wavelength of 633 nm (HORIBA Scientific, JobinYvon Technology) was used to investigate vibrational modes of the samples. Fourier-Transform Infrared spectroscopy was performed in an Attenuated Total Reflection (ATR) mode using a Perkin Elmer 100 Spectrometer in 400–4000 cm1 range. UV–Vis Absorbance and diffuse reflectance measurements were performed on a Cary 5000 UV–Vis-NIR spectrophotometer equipped with an integrating sphere. The photoluminescence properties were investigated with QE Pro-FL spectrometer (Ocean Optics, FL, USA).
Photocatalytic activity of annealed MgO nanoparticles was evaluated by measuring the degradation ability of aqueous solution of methyl blue (MB) under the UV lamp. The UV lamp used as the visible light irradiation is Mega-Ray 160 W/240 V MR160 SPL11/14. A mass of 10.0 mg annealed MgO nanoparticles were put in a glass beaker containing 25.0 mL aqueous solution of MB. Before adding MgO nanoparticles, the pH of MB was adjusted to 8.99 and UV–Vis absorbance measurement was recorded. Before exposing the mixture (MgO in MB to visible light irradiation, it was stirred in the dark for 1 h to achieve adsorption/desorption equilibrium. The first measurement was taken at 0 min of contact time with visible irradiation, under constant stirring, and subsequently after every 15 min for 150 min. The mixture under constant stirring and exposure to visible irradiation was placed in an ice bath to prevent easily evaporation of MB.
3 Results and discussion
3.1 Morphology and chemical element of MgO nanoparticles
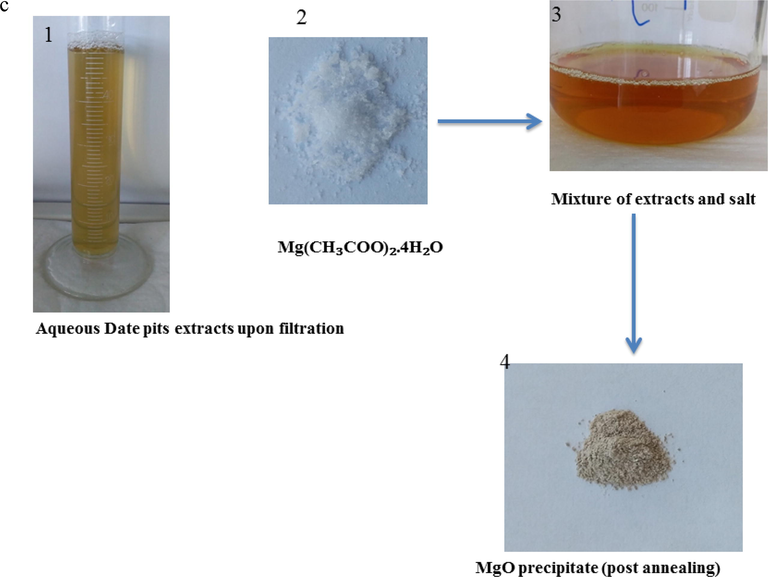
Fig. 2(a, b) shows scanning electron microscopy (SEM) images of MgO nanoparticles annealed at (a) 700 and (b) 500 °C, respectively. Spherical nanograins of irregular sizes (both small and big) are observed from SEM images. Usually irregular nanograins tend to agglomerate (see insets) due to their surface energy leading to the formation of large surface area. It is seen that MgO nanoparticles annealed at 700 °C exhibit bigger nanograins that form agglomeration (see Fig. 2(a)). Researchers report that bigger grains could be attributed to the Oswald ripening process with limited porosity and crystallinity.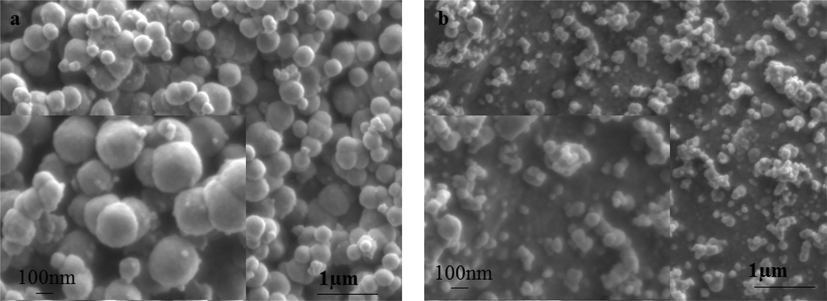
SEM images showing the morphology of synthesised MgO nanoparticles annealed at (a) 700 and (b) 500 °C. Insets show spherical agglomerated nanograins.
The SEM images of samples annealed at lower annealing temperature of 500 °C is shown in Fig. 2(b). A breakdown of agglomeration revealing much smaller nanograins is seen. Thus by visual inspection only, it is seen that at lower annealing temperature, smaller size nanograin is achieved.
To identify the elemental composition of synthesised MgO nanoparticles, EDS analysis was conducted and results are shown in Fig. 3(a-d). Obtained from EDS mapping in high percentages are Magnesium (Mg) and Oxygen (O), which are the main chemical elements in the samples. This confirms the purity of MgO nanoparticles devoid of impurities. The presence of carbon observed arises from carbon coating samples before SEM analysis. It is noted that atomic percentages of chemical elements of MgO nanoparticles vary with annealing temperature. For instance, percentage of Mg is higher in MgO nanoparticles annealed at 500 °C as compared with MgO annealed at 700 °C. In the same way, O is in abundance in MgO nanoparticles annealed at 700 °C than in MgO nanoparticles annealed at 500 °C.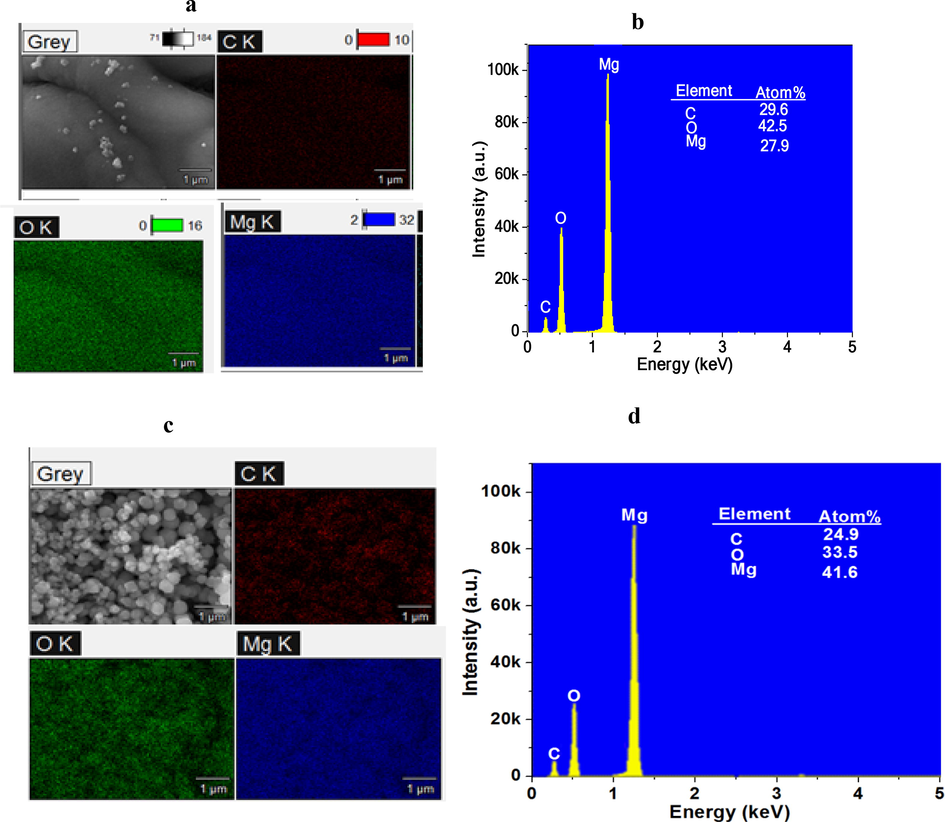
EDS spectra showing the mapping of elements present in samples with respective atomic percentages of synthesized MgO annealed at (a, b) 700 °C, (c, d) 500 °C.
High-resolution transmission electron microscopy (HRTEM) images of un-annealed MgO nanoparticles are presented in Fig. 4(a-c). As one can see, un-annealed MgO nanoparticles reveal agglomerated spherical nanograins evident in Fig. 4(a). It is observed that SAED pattern (see Fig. 4(c)) taken from un-annealed MgO nanoparticles shows no diffraction peak, indicative of the amorphous nature of un-annealed MgO nanoparticles.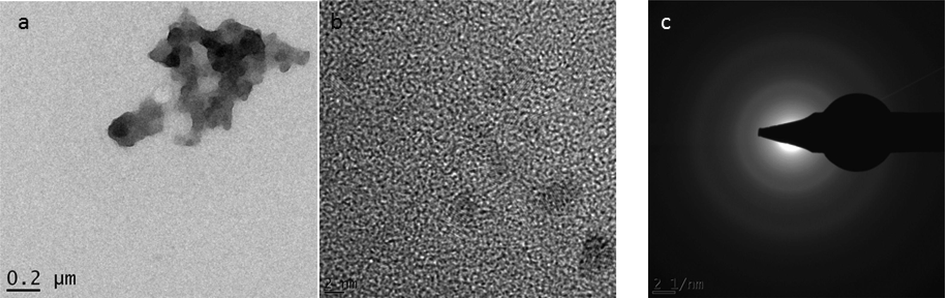
HRTEM images of un-annealed MgO nanoparticles showing (a) nanograins, (b) singular nanograins, (c) SAED pattern.
Upon annealing MgO nanoparticles, the structure becomes refined. This can be observed from the HRTEM images of MgO nanoparticles annealed at 700 °C, as shown in Fig. 5(a). One can see both small and big size nanograins of spherical shapes. For a singular nanograin shown in Fig. 5(b), series of distinguishable planes with approximate dhkl distances of 0.32 and 0.34 nm are observed. Bright diffraction peaks (Fig. 5(c)) with dhkl distances of 0.22, 0.149and 0.121 nm which correspond to (0 0 2), (0 2 2), and (2 2 2) planes, respectively, of face-centred cubic Periclase MgO, are seen on SAED image.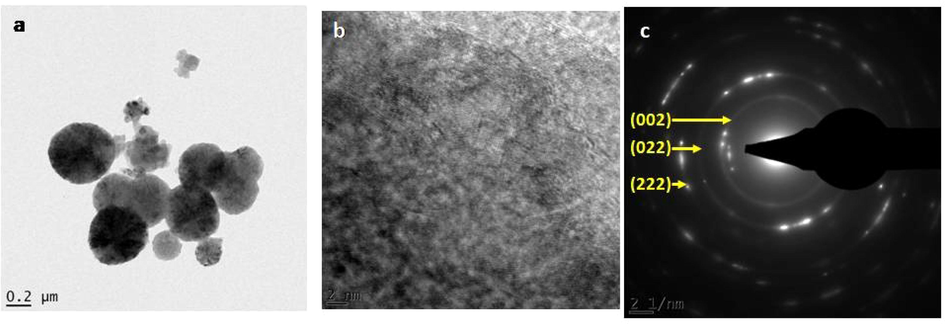
HRTEM images of annealed at 700 °C MgO nanoparticles showing (a) nanograins, (b) singular nanograins, (c) SAED pattern.
As annealing temperature is reduced to 500 °C, MgO nanoparticles become less agglomerated. This is evident from Fig. 6(a-c) which shows an HRTEM image of nanograins with average size of 14.0 nm. Lattice resolved HRTEM image presented in Fig. 6(b) illustrates the interplanar distances of 2.10 and 1.49 Å of (0 0 2) and (0 2 2) crystal planes, respectively. Corresponding SAED pattern characterized by bright diffraction spots with each spot arising from Bragg reflection from an individual crystallite is shown in Fig. 6(c).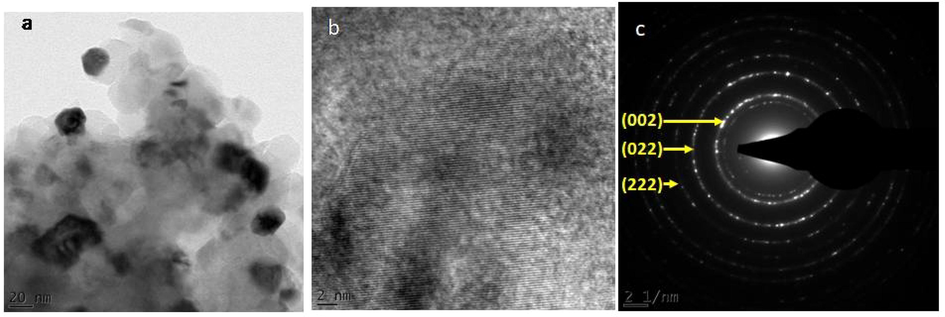
HRTEM images of annealed at 500 °C MgO nanoparticles showing (a) nanograins, (b) singular nanograins, (c) SAED pattern.
Observation from SAED patterns of un-annealed and annealed MgO nanoparticles present different outputs. Un-annealed MgO nanoparticles SAED image reveals diffuse ring patterns confirming the amorphous nature of nanograins. While SAED patterns of annealed MgO nanoparticles reveal bright diffraction spots, and small spots making up rings. This confirms crystalline and poly-nano-crystalline of nanograins.
The histogram of particle size distribution estimated via image J software for each sample is plotted in supporting document Fig. 7(a-c). The results presented in Fig. 7(a-c) give estimates average particle sizes. It is estimated that un-annealed MgO nanoparticles (Fig. 7(a)) recorded random particle distribution. However, as MgO nanoparticles are annealed at (b) 700 °C and (c) 500 °C, particles are evenly distributed. Lowest average particle size is recorded for annealed at 500 °C MgO nanoparticles. The average particle size agrees with observations from SEM and HRTEM analysis.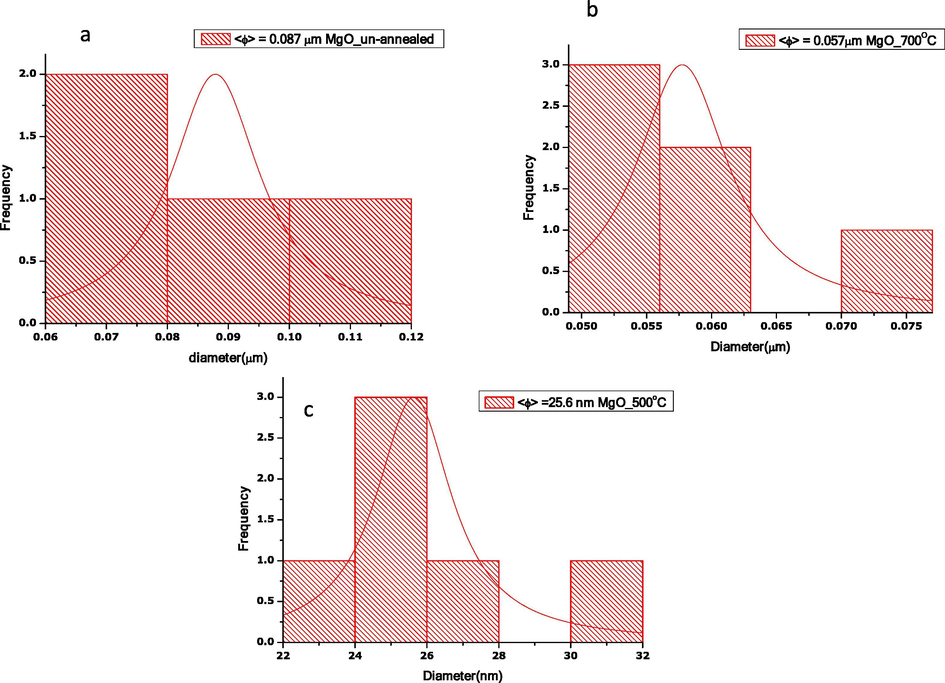
Histogram of the particle size distribution of MgO (a) un-annealed, annealed at (b) 700 (c) 500 °C.
3.2 Phase identification: XRD, Raman, ATR
XRD patterns of un-annealed and annealed MgO nanoparticles synthesised via the green chemistry approach are shown in Fig. 8(a). From the XRD patterns, un-annealed MgO nanoparticles show amorphous structure while annealed samples exhibit well crystalline structures. Precisely, the XRD pattern of un-annealed MgO nanoparticles shows no diffraction peak. Meanwhile annealed MgO nanoparticles exhibited five (5) distinguishable peaks at 2θ = 36.889°, 42.856°, 62.216°, 74.577°, 78.510° which correspond to crystal lattice planes (1 1 1), (2 0 0), (2 2 0), (3 1 1), (2 2 2) respectively. The observed peaks are perfectly matched to a Face-centered cubic Periclase MgO with lattice perimeters of a = 4.2171 Å, S.G. = Fm-3m (2 2 5), Z = 4. These values are in good agreement with standard values reported by ICSD code 9863.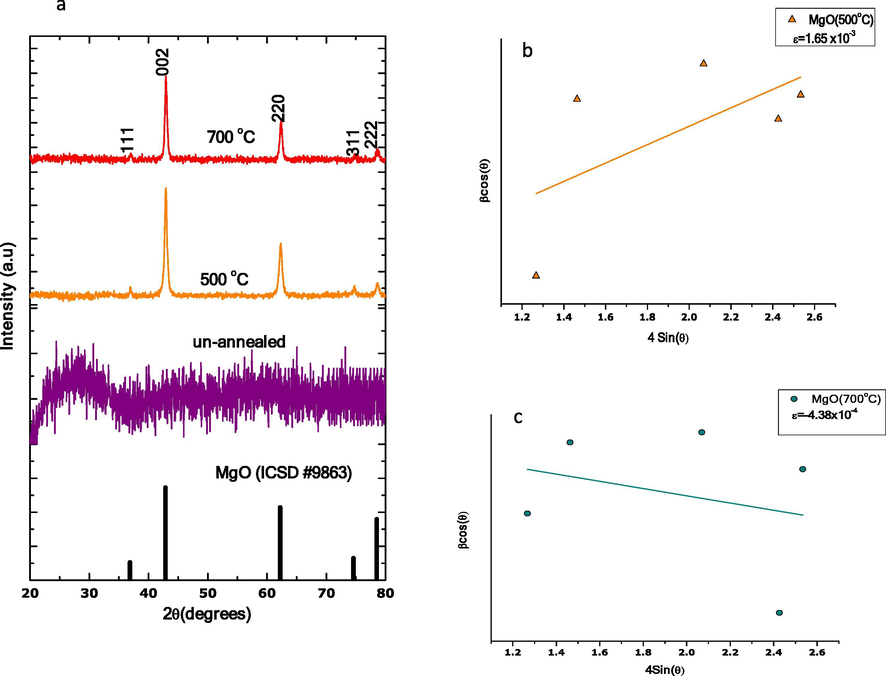
(a) The XRD patterns for un-annealed and annealed MgO nanoparticles, (b) W-H plot of MgO nanoparticles annealed at 500 °C and (c) W-H plot of MgO nanoparticles annealed at 700 °C.
X-ray profile was used to estimate crystallite size. The average crystallite size (< ˃m) was calculated by employing the Debye–Scherrerformula:
By considering the peak width as a function of 2θ, the lattice strain of annealed MgO nanoparticles are estimated via the Eq. (2).
A graph of and along × and y-axis respectively, for annealed MgO nanoparticles, is shown in Fig. 8(b,c). From linear fit, microstrains (ɛ), are estimated from the slope of fit. Annealed MgO nanoparticles reveal positive strain while a minimal strain characterized by negative value was obtained for MgO nanoparticles annealed at 500 and 700 °C respectively.
The dislocation density (δ) is estimated via equation below:
To investigate vibrational modes of samples, ambient temperature Raman spectra was performed and results are shown in supporting document Fig. s1. Raman line observed at 423 cm−1 from 500 °C annealed MgO nanoparticles coincide with one of the prominent peaks in Chen’s calculation Karthik et al. (2019). Such a line is attributed to transverse optical (TO) phonon at the zone centre. Also, a prominent peak at 2433 cm−1 ascribed to C–H carbon bonded with MgO at the surface is identified on MgO nanoparticles annealed at 500 °C yet absent on MgO nanoparticles annealed at 700 °C. Raman spectrum obtained on MgO nanoparticles annealed at 700 °C shows strong peaks at various regions indicating cubic structure designated to MgO.
ATR spectra recorded with wavelength ranging from 400 to 4000 cm−1 on annealed MgO nanoparticles presented (see supporting document Fig. s2). The peaks seen at 3692 and 1428 cm−1 correspond to OH stretching and H2O adsorption. The bands observed at 2990 and 2922 cm−1 are attributed to aliphatic group CH2 asymmetric and symmetric vibration respectively. The medium appearing at 1259 and 1069 cm−1 are assigned to φ-O vibration and C–O stretching vibrations, respectively. The absorption band observed at 884 cm−1 is a characteristic vibration of a cubic MgO Wu et al. (2008).These peaks further confirmed the successful synthesis of MgO phase.
3.3 Optical properties: DRS, UV–Vis absorbance, PL
Diffuse reflectance spectra (DRS) of synthesised un-annealed and annealed MgO nanoparticles are shown in Fig. s5 of supporting document. DRS spectra in the UV–VIS-NIR range of annealed and un-annealed MgO nanoparticles show fairly constant reflectance and a broadband at 320 nm with fringes respectively. It is reported that pure MgO nanoparticles record sharp absorption band at 185 nm which correspond to optical excitation of five-fold coordinated O2− anion (Suresh and Arivuoli, 2011). Such wavelength is below the accessible wavelength of spectrophotometer used in this analysis. In our spectra, absorption bands are observed at 205 and 276 nm which have been designated by regions I& II (See supporting document Fig. s3). These bands correspond to 6.04 and 4.49 eV respectively. Such bands are identified with excitation of four-fold and three-fold coordinated O2− anions in edges and corners of MgO respectively Gu et al. (2008).
From DRS measurement, the optical band gap (supporting document Fig. s4) was calculated via Kubelka–Munk function described elsewhere and values are given in Table 2 (see supporting document). The band-gap obtained for un-annealed MgO nanoparticles is less than the standard value. The decreased bandgap could be due to the quantum confinement effect.
The band edge potential, i.e. the potential of conduction and valence band is determined via the equations below;
The valence band is expressed as
The values of the calculated conduction and valence bands of the MgO nanoparticles are shown in Table 2 (see supporting documents).
UV–Vis absorbance was used to investigate the formation and nanoparticle growth dynamics of the MgO nanoparticles. The absorbance spectra of aqueous extracts of date pits and mixture (magnesium acetate and extracts) is shown in supporting document (Fig. s5). The UV–Vis absorbance spectrum of aqueous date pits extracts shows two peaks at 280 and 330 nm. Such peaks originate from phenolics such as gallic acid and flavonoids which serve as reducing agents. UV–Vis absorbance spectrum of mixture shows a broad and shift in wavelength at 290 nm. The peak observed at 290 nm is the characteristic peak of MgO nanoparticles Mabry et al. (1970).It should be noted that the UV–Vis absorbance of the mixture was measured immediately magnesium acetate was added to extracts. This implies that at 0 h reaction time, MgO nanoparticles are formed.
To further understand the optical properties and various structural defects of MgO nanoparticles, room temperature photoluminescence spectra (PL) were recorded. An ultraviolet light source of 240 nm was used to excite the MgO nanoparticles. The PL spectra (Fig. s6 of supporting document) revealed two emission bands. One broad blue band emission is at 424 nm (2.92 eV) which is attributed to 3B1u→1Ag transition of F22+center in D2h symmetry. Such centres consist of two oxygen vacancies in nearest neighbour position along 〈1 1 0〉, each having a trapped electron with the ground and first excited states as 1Ag and 3B1u, respectively Kumar et al. (2011). The second emission band is observed at 541 nm which would favour the existence of large quantities of oxygen vacancies to acts as deep defect donors to create new energy levels in the bandgap of MgO nanoparticles.
3.4 Photocatalytic activity OF MgO
Photocatalytic activity of annealed MgO nanoparticles was studied by measuring the degradation ability with aqueous solutions of methyl blue (MB) under the UV lamp. UV–Vis absorbance at different concentrations of MB (2, 4, 6, 8, 10 ppm) were measured on a wavelength range of 200–800 nm. The spectra shown in Fig. 9(a), recorded the highest absorbance (10 ppm) value at a unique wavelength of 663.4 nm.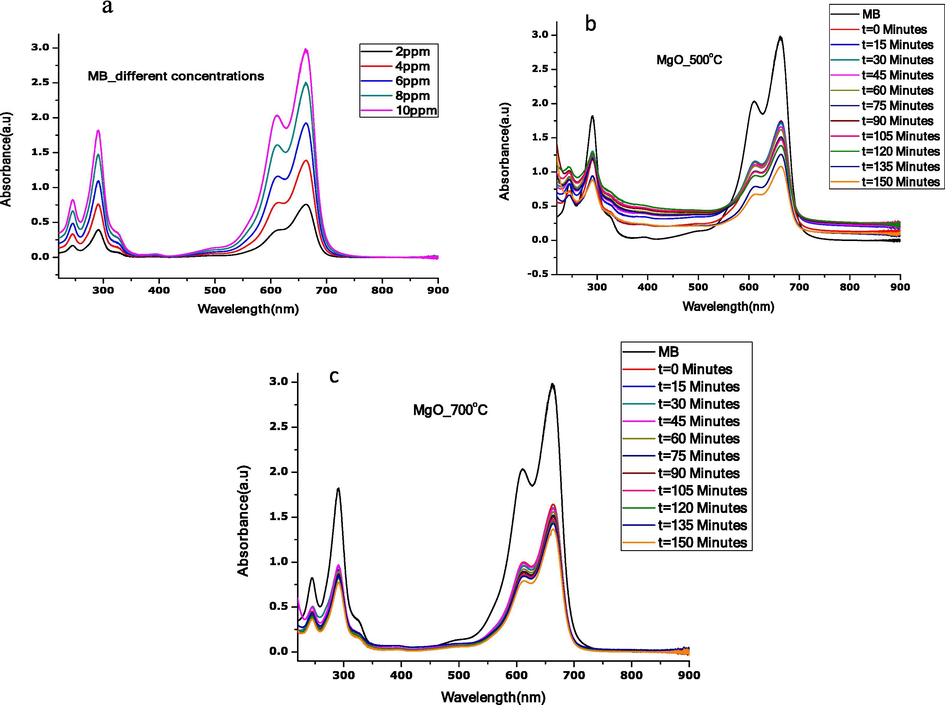
UV–Vis absorbance spectra for (a) different MB concentrations, (b) photocatalytic degradation of MB in contact time with MgO annealed at 500 °C (c) photocatalytic degradation of MB in contact time with MgO annealed 700 °C.
Fig. 9(b,c) show spectra for the photocatalytic activity of annealed MgO nanoparticles under visible light at sampling time. As can be seen, UV–Vis absorption spectra of MB by annealed MgO nanoparticles under a UV lamp at sampling time changes. The peak levels decrease with an increase in a contact time of visible light irradiation. The photocatalytic degradation of MB dye by annealed MgO nanoparticles can be attributed to its spherical-like nano grain structures.
After 150 min of contact time of visible light irradiation, the shape of the UV–Vis absorbance peak remains the same. This shows that our material is still active even after such a long time. For stability and reproducibility, the experiment was repeated three times and it was noticed that each run did not show any significant difference in the results.
The photocatalytic efficiency was evaluated by the equation below:
3.4.1 Removal kinetic of MB
The photocatalytic of MgO nanoparticles obeys pseudo-first-order kinetics which was calculated by the equation.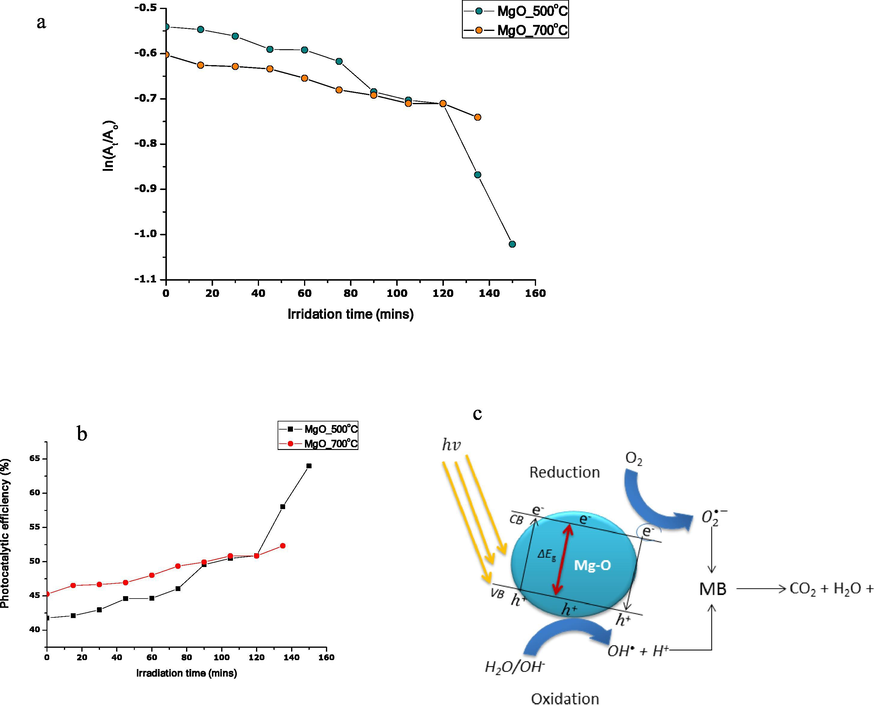
Plot showing (a) photocatalytic degradation efficiency of MgO nanoparticles versus irradiation time, (b) removal Kinetic of MB, (c) the mechanism of photocatalysis of MgO nanoparticles on MB.
As a follow up of this study, it is intended to use the same procedure to bio-synthesize several other functional nanoscaled oxides and even nanocomposites (Simo et al., 2014; Kaviyarasu et al., 2015; Magdalane et al., 2018; Maaza et al., 2005; Khenfouch, et al., 2012).
4 Conclusion
Aqueous extracts obtained from date pits were used to bio-synthesise MgO nanograins. UV–Vis absorbance analysis confirms the presence of phytochemicals contained in date pits extracts which serve as reducing agents favouring the instant formation of MgO nanoparticles. SEM and HRTEM images reveal spherical nanograins with increased particles size as annealing temperature increased. Meanwhile, X-ray profile analysis of the annealed samples was perfectly matched to single-phase cubic Periclase MgO nanoparticles. The date pits mediated MgO showed excellent photocatalytic degradation towards methyl blue.
Acknowledgements
The work was supported by University of South Africa (UNISA) Chair in Nanosciences/Nanotechnology (Nr. 90390490). We are also grateful to Nanosciences African network (NANOAFNET), as well as the National Research Foundation of South Africa, iThemba LABS.
Declaration of Competing Interest
The authors declare that they have no known competing financial interests or personal relationships that could have appeared to influence the work reported in this paper.
References
- Nutritional and functional properties of dates: a review. Crit. Rev. Food Sci. Nutr.. 2008;48(10):877-887.
- [Google Scholar]
- Synthesis and characterization of zinc oxide nanoparticles (ZnO NPs) in powder and in thin film using corn husk extract via green chemistry. MRS Adv.. 2020;5(21–22):1083-1093.
- [Google Scholar]
- A review of the chemistry and pharmacology of the date fruits (Phoenix dactylifera L.) Food Res. Int.. 2011;44(7):1812-1822.
- [Google Scholar]
- Investigation of electrochemical performance of the biosynthesized α-Fe2O3 nanorods. Surf. Interfaces. 2019;17:100345
- [Google Scholar]
- Biosynthesis of NiO nanoparticles for photodegradation of free cyanide solutions under ultraviolet light. J. Phys. Chem. Solids. 2019;134:133-140.
- [Google Scholar]
- Nanoscale magnesium hydroxide and magnesium oxide powders: control over size, shape, and structure via hydrothermal synthesis. Chem. Mater.. 2001;13(2):435-440.
- [Google Scholar]
- Dowson, V. H. (1982). Date Production and Protection (Plant Production and Protection Paper No. 35). FAO Food and Agriculture Organization of the United Nations, Rome, Italy.
- Investigation of structural and optical properties of CdO nanoparticles via peel of Citrus x sinensis. Mater. Today:. Proc. 2020
- [CrossRef] [Google Scholar]
- Crystallinity of Li-doped MgO: Dy3+ nanocrystals via combustion process and their photoluminescence properties. J. Alloy. Compd.. 2008;453(1–2):361-365.
- [Google Scholar]
- Elaboration of novel polyaniline@ Almond shell biocomposite for effective removal of hexavalent chromium ions and Orange G dye from aqueous solutions. Environ. Sci. Pollut. Res. 2020:1-14.
- [Google Scholar]
- Fabrication of MgO nanostructures and its efficient photocatalytic, antibacterial and anticancer performance. J. Photochem. Photobiol., B. 2019;190:8-20.
- [Google Scholar]
- Synthesis and characterization studies of MgO: CuO nanocrystals by wet-chemical method. Spectrochim. Acta Part A Mol. Biomol. Spectrosc.. 2015;142:405-409.
- [Google Scholar]
- White photoluminescence from a grown ZnO nanorods/graphene hybrid nanostructure. Opt. Mater.. 2012;34(8):1320-1326.
- [Google Scholar]
- Klabunde, K.J., Richards, R.M. (Eds.). (2009). Nanoscale Materials in Chemistry. John Wiley & Sons.
- Sol–gel synthesis of highly luminescent magnesium oxide nanocrystallites. J. Lumin.. 2011;131(4):640-648.
- [Google Scholar]
- Preparation of MgO nanomaterials by microemulsion-based oil/water interface precipitation. Mater. Lett.. 2016;171:204-207.
- [Google Scholar]
- A 13C solid-state NMR study of the chemisorption and decomposition of ethanol on MgO. J. Catal.. 1986;101(2):293-300.
- [Google Scholar]
- Surface plasmon resonance tunability in Au− VO2 thermochromic nano-composites. Gold Bull.. 2005;38(3):100-106.
- [Google Scholar]
- The ultraviolet spectra of flavones and flavonols. In: The Systematic Identification of Flavonoids. Berlin, Heidelberg: Springer; 1970. p. :41-164.
- [Google Scholar]
- Evaluation on La2O3 garlanded ceria heterostructured binary metal oxide nanoplates for UV/visible light induced removal of organic dye from urban wastewater. S. Afr. J. Chem. Eng.. 2018;26:49-60.
- [Google Scholar]
- Facile synthesis, characterization and photocatalytic performance of Zn3 (PO4) 2 platelets toward photodegradation of Rhodamine B dye. J. Environ. Chem. Eng.. 2018;6(2):1840-1847.
- [Google Scholar]
- Photocatalytic degradation of sulfadiazine by Zn3 (PO4) 2/BiPO4 composites upon UV light irradiation. Mater. Today:. Proc.. 2020;22:48-51.
- [Google Scholar]
- Preparation, characterization and photocatalytic degradation of Rhodamine B dye over a novel Zn3 (PO4) 2/BiPO4 catalyst. J. Environ. Chem. Eng.. 2019;7(3):103075
- [Google Scholar]
- Influence of Sr-doping on structural, optical and photocatalytic properties of synthesized Ca3 (PO4) 2. J. Colloid Interface Sci. 2020
- [CrossRef] [Google Scholar]
- Recent progress on the enhancement of photocatalytic properties of BiPO4 using π–conjugated materials. Adv. Colloid Interface Sci.. 2020;102160
- [Google Scholar]
- Razanamahandry, L. C., Andrianisa, H. A., Karoui, H., Yacouba, H., Manikandan, E., Maaza, M. (2018). Cyanide dynamics in catchment areas affected by artisanal gold mining in Burkina Faso. In: Artisanal Small Mining Conference.
- Antibacterial effect of silver nanoparticles synthesised on a polycarbonate membrane. Mater. Today:. Proc. 2020
- [CrossRef] [Google Scholar]
- Electrochemical properties of Euphorbia pulcherrima mediated copper oxide nanoparticles. Mater. Chem. Phys.. 2020;244:122714
- [Google Scholar]
- VO2 nanostructures based chemiresistors for low power energy consumption hydrogen sensing. Int. J. Hydrogen Energy. 2014;39(15):8147-8157.
- [CrossRef] [Google Scholar]
- Polyol-mediated thermolysis process for the synthesis of MgO nanoparticles and nanowires. Nanotechnology. 2007;18(22):225601
- [Google Scholar]
- Synthesis and characterization of Pb+ doped MgO nanocrystalline particles. Digest J. Nanomater. Biostruct.. 2011;6(4):1597-1603.
- [Google Scholar]
- Green synthesis of Khat mediated silver nanoparticles for efficient detection of mercury ions. Mater. Today:. Proc. 2020
- [CrossRef] [Google Scholar]
- A review on chemical coagulation/flocculation technologies for removal of colour from textile wastewaters. J. Environ. Manage.. 2012;93(1):154-168.
- [Google Scholar]
- Magnesium hydroxide nanoparticles synthesized in water-in-oil microemulsions. J. Colloid Interface Sci.. 2008;324(1–2):167-171.
- [Google Scholar]
- Morphology-tunable synthesis and characterizations of Mg (OH) 2 films via a cathodic electrochemical process. Mater. Chem. Phys.. 2008;107(1):85-90.
- [Google Scholar]
Appendix A
Supplementary data
Supplementary data to this article can be found online at https://doi.org/10.1016/j.jksus.2020.06.013.
Appendix A
Supplementary data
The following are the Supplementary data to this article:


