

Translate this page into:
COMSOL multiphysics 3.5a package for simulating the cadmium transport in the sand bed-bentonite low permeable barrier
⁎Corresponding authors. nadhir.alansari@ltu.se (Nadhir Al-Ansari), mnaushad@ksu.edu.sa (Mu. Naushad)
-
Received: ,
Accepted: ,
This article was originally published by Elsevier and was migrated to Scientific Scholar after the change of Publisher.
Peer review under responsibility of King Saud University.
Abstract
Here, batch study for Iraqi bentonite-cadmium aqueous solution interaction was conducted with conditions of contact time ≤ 120 min, sorbent dosage from 0.05 to 1 g per 100 mL and shaking speed from 50 to 300 rpm for initial concentration of 50 mg/L with initial pH of 3 to simulate the acetogenic phase in the sanitary landfill. The best conditions were 1 h, 0.7 g/100 mL and 250 rpm, respectively to obtain the highest removal (90%). The sorption data were well formulated by Freundlich and Langmuir models with determination coefficient (R2) ≥ 0.98 and sorption capacity of 145.3 mg/g; so, the removal process governed by the physico-chemical forces. The average coefficient of the hydraulic conductivity was found equal to 1.98 × 10⁻¹⁰ m/s and this is suitable for low permeable barrier (LPB). Finally, the predictions of COMSOL package were presented satisfactory simulation for the cadmium concentrations within two-dimensional physical model packed with sand aquifer and Iraqi bentonite. Two configurations of LPB were evaluated for restriction of contaminant front migration and the results proved that the surrounding of the location required to protect it from three sides against to the flow direction can be more dependable from continuous configuration.
Keywords
Low permeable barrier
Iraqi bentonite
Cadmium
Isotherm models
COMSOL package

1 Introduction
In most parts of the world, there are a number of environmental issues that required urgent solutions based on the nature of geotechnical properties of this environment (Naushad et al., 2016). For example, recent studies proved that there is a big pollution with toxic contaminants like organic compounds (Naushad et al., 2019) and heavy metals (Faisal et al., 2020; Naushad and ALOthman, 2015) in the geographical environment adjacent to the sites of landfills, farmlands, and old factories; consequently, such locations are required solutions from decision maker. In 1950s, cadmium received much attention as a potentially toxic and highly bioavailable element when the disease of Itai-itai had spreading in Japan and this may correlate with high concentrations of cadmium in water used for rice fields irrigation. Pollution from base-metal mining represents the origin of cadmium in this issue (Kasuya et al., 1992). In addition, a remarkable increase in the concentration of this element in European soils was recorded during the 20th century. Actually, there is a great difficult in the estimation the fluxes of cadmium because this element can produce from different sources such as phosphate fertilizers, liming, manure and atmospheric deposition; also, high transfer of cadmium and soaking in the soil can occur (Six and Smolders, 2014).
Many techniques have been studied for treatment of groundwater and followed by many researchers and workers since their inception like low permeable barrier (LPB), permeable reactive barrier (PRB) and others. The LPB is the wall constructed underground from the reactive material that have high swelling capability and low value of hydraulic conductivity coefficient to prevent the off-site propagation of water/ contaminant. Wall of bentonite clay is the familiar type of LPB due to easy construction and low cost; however, 90% of clay walls are mixtures either of soil-bentonite or soil-cement-bentonite (Six and Smolders, 2014). The bentonite barrier mostly used for creation of low permeability region for redirection or containment of groundwater flow because hydraulic conductivity of this material is very low.
Evaluation of using green sand from gray iron foundry as a low-permeability material for LPB was studied. The experimental outputs elucidated that this sand is a viable material for building low hydraulic conductivity barrier to be used as caps or liners for landfills, ponds, and others (Abichou et al., 2002). The two-dimensional flow of groundwater in the regional field after incorporated of LPB was described mathematically by using explicit analytical solution to find the distribution of hydraulic head and velocity vectors. This solution was utilized effectively to evaluate the effect of LPBs on the flow domain and; more accurately, on the hydraulic retention of the contaminant by combining the vertical barrier and extraction wells (Anderson and Mesa, 2006). Geosynthetics-bentonite liner was also tested and the results proved that the system was worked efficiently under the effect of stress with low permeability (Bradshaw et al., 2016). In this work, Iraqi bentonite considers abundant material with inexpensive cost; so, its utilization as LPB for restriction the movement of the cadmium plume and consequently the protection of water resources is achieved by batch and continuous studies with aid of COMSOL Multiphysics 3.5a (2008) package.
2 Experimental work
The materials which were used in the present study ate given the ESI (Text S1).
2.1 Batch experiments
Batch tests were implemented to identify the suitable conditions of contact time, reactive material dosage and agitation speed for certain values of initial pH and initial concentration. All experiments were applied on the acetogenic phase (pH = 3) because it’s critical case in the leachate resulted from the sanitary landfills especially the liner represents good application of LPB. A set of 250 mL flasks were used and 100 mL of solution contaminated with 50 mg/L cadmium were placed in each flask. Amounts ranged from 0.05 to 1 g of bentonite were added in different flasks and they were stirred at 250 rpm using orbital shaker (Edmund Buhler SM25, German) for 1 h. A certain volume of solution was taken from each flask and filtered using filter paper type (JIAO JIE 102). A 10 mL of the filtered solution was utilized to measure the cadmium concentration in the solution using the atomic adsorption spectrometer (AAS, Sens AA, Australian). The removal efficiency for contaminant was determined as below:
Kinetic studies were conducted with sorbent dosages of (0.05, 0.1, 0.3, 0.5, 0.7, 0.9 and 1 g), contact times of (5, 10, 20, 30, 60 and 120 min) and agitation speeds of (50, 100, 150, 200, 250 and 300 rpm). The quantity of adsorbed contaminant (qe) was established as follows (Gheju and Miulescu, 2007):
2.2 Continuous experiments
The transport of simulated polluted solution was carried out in the two-dimensional tank packed with sand aquifer and bentonite as LPB (Fig. S2). This tank was manufactured from 6 mm rectangular glass tank with dimensions of 100 cm length, 40 cm width and height of 10 cm. Two perforated glass plates covered with filter paper were used to divide the tank into three compartments. The plates were the side boundaries of the sand-filled middle compartment with dimensions of 80 × 40 × 10 cm. The two outer influent and effluent compartments were designed to control the position of the groundwater with dimensions of 10 cm length, 40 cm width and 10 cm height for each one. One value of the flow rate (25 mL/min) was applied on the bed model from storage tank with aid of flow meter and aqueous samples were collected from certain locations by stainless needles at certain times. Initially, the middle compartment was filled with bed model in the alignment of Fig. S2 (50 cm sand + 10 cm bentonite + 20 cm sand in the longitudinal direction) with depth of 5 cm. Flow rate of 25 mL/min was applied and the concentration of cadmium was monitored at ports 1, 2 and 4 for 7 days; however, samples were immediately analyzed by AAS.
2.3 Modeling of batch and continuous outputs
2.3.1 Models of adsorption
Here, Freundlich (1906) and Langmuir (1916) models were applied for description of adsorption process. Freundlich model is described the data for heterogeneous surfaces and multilayer sorption as follows:
Single monolayer of solute accumulates on the solid surface of sorbent is the popular assumption of Langmuir model which shows the following form:
2.3.2 Modeling of cadmium transport
Simulation the transport of cadmium ions in the 2D bed is based on the combination of two main equations; equation of groundwater flow for steady state system that depended on the Darcy’s law (Eq. (5)) and equation of contaminant transport (Eq. (6)) as illustrated below:
The Langmuir model must be incorporated with Eq.6 to describe the adsorption process in the contaminant transport as in the following formula:
3 Results and discussion
3.1 X-ray diffraction analysis
The chemical composition of the bentonite was characterized using the X-ray diffraction analysis as shown in Fig. 1. This analysis was conducted in Germany Laboratory/ Geology Department/ College of Science/ University of Baghdad/ Iraq. The composition of this material is consisted of SiO2, aluminum silicate, calcium silicate hydrate and calcium aluminum silicate hydrate. Since the structure of the bentonite is montmorillonite, can expand and contract as well as have the higher power for adsorption of water and cation. Besides that, the bentonite can also be used as catalyst supports (Naswir et al., 2013) and as adsorbent for heavy metal (Bereket et al., 1997).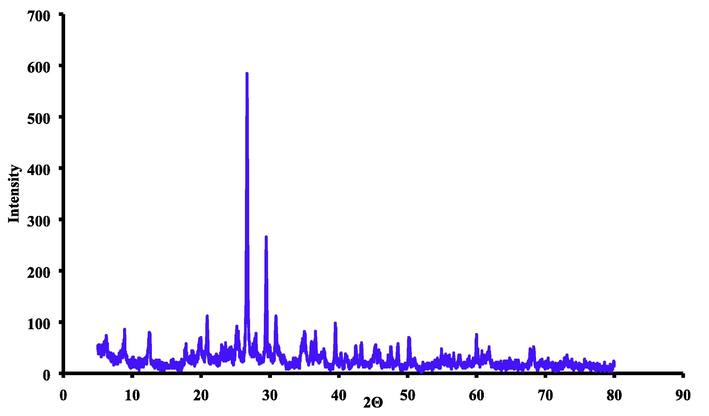
The X-ray diffraction (XRD) analysis for natural bentonite utilized in this study.
3.2 Coefficient of hydraulic conductivity
The “falling head permeameter” utilized in the measurement of the hydraulic conductivity coefficient (K) for bentonite material. The experiment was beginning by saturating the porous medium sample with tap water for duration not less than 2 days; so, this test actually measures the water passing through this material. The test is based on the monitoring of the falling head as a function of the time and the corresponding conductivity can be calculated. Fig. S3 plots the relationship between the hydraulic conductivity coefficient and elapsed time where this coefficient was decreased from 4.37 × 10⁻⁸ to 6.29 × 10⁻⁹ cm/s after 9 days with average value of 1.98 × 10⁻⁸ cm/s which is suitable for LPB. Due to the high density of the present reactive material, this will cause the slowed flow within the internal pores and consequently, the decrease of K was noted (Worthington and Soley, 2017).
3.3 Batch experiments
Sorbent dosage: The relationship between the cadmium removal efficiencies and sorbent dosages of bentonite is plotted in Fig. 2(a) which includes the adopted operation conditions. The increase of sorbent mass improved the removal efficiency and this may be attributed to available greater vacant sites. This figure certifies that the sorption efficiency was increased from 38 to 83.20% due to increase of dosage from 0.05 to 0.3 g/100 mL; thereafter, slow increase in the efficiency was recognized. So, 0.7 g/100 mL was chosen as the best value to obtain the fair removal efficiency reached to 90% because no significant effect on the adsorption capacity was observed beyond this dosage.
Contact time: Fig. 2(b) plots the variations of sorption efficiencies for cadmium ions onto bentonite versus the contact time under the relevant conditions specified within this graph. This figure reveals that the sorption rate was very fast within the first five minutes and at which the efficiency approaches to 61.9. Thereafter, the rate was gradually slowed and efficiency approximately stabilized beyond 1 h at 90. The presence of sufficient numbers of the binding sites on the adopted sorbent may be the main reason for high rate of sorption process and it was decreased with elapsed time which may be resulted from the occupation of these sites by cadmium ions. However, the contact time of 1 h was considered the best value to achieve the maximum removal efficiency and definitely the maximum adsorption capacity.
Agitation speed: This speed was changed from 50 to 300 rpm and the measured corresponding removal percentages were plotted in Fig. 2(c) under the operational conditions Co = 50 mg/L, contact time = 1 h, initial pH = 3, and dosage = 0.7 g/ 100 mL. It seems that there was a gradual increase in the sorption of cadmium with increase of speed to reach of 92.2% at 300 rpm. The increase of speed generated the proper contact between metal ions and particles of sorbent; so, this enhanced the effective diffusion and, consequently, the improvement of efficiency. For practical purposes, the choice speed of 250 rpm as best value for batch tests was satisfactory for sorbent under consideration.
Initial pH: The industrial or municipal solid wastes must be disposed in the landfills that composed of storage space, liner, leachate collection system, gas collection system, and capping (Li, 2008). The liner of the landfill must be built-up impervious (or low) permeability material to isolate the waste from surrounding environment (Milosevic, 2012). Leachate is the contaminated solution that generated from the sanitary landfill as a result of water (or rainfall) percolation through dumped wastes (Taulis, 2005); however, this liquid can be emitted to nearby environment through external sources (Koshy et al., 2007). This leachate will associate with complex interplay between the biogeochemical and hydrological conditions that initiate the liquid flow (Abdul Aziz et al., 2004). So, it includes a broad range of inorganic and organic chemicals such as heavy metals, ammonia nitrogen and COD. Aerobic stage, hydrolysis stage, acetogenic stage, and methanogenic stage are the major successive phases involved for leachate degradation (Kjeldsen et al., 2002a). The third phase considers the more dangerous situation on the performance and durability of the liner system because the acidic phase leachate is chemically aggressive and will increase the chemicals solubility like heavy metals (Foo and Hameed, 2009; Kjeldsen et al., 2002b). Accordingly, the initial pH of the contaminated solutions was adopted of 3 in all batch experiments for interaction of cadmium ions with bentonite to represent the acetogenic phase of leachate spilled from sanitary landfill.
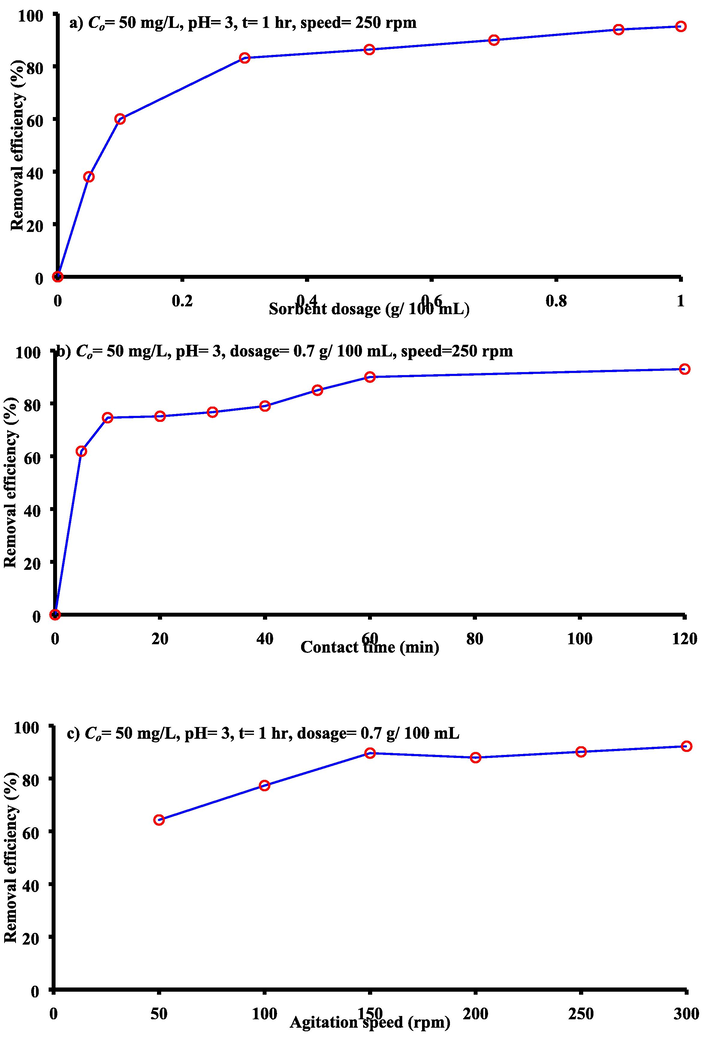
- The trend of the relationships related between the removal efficiencies of the cadmium ions a) sorbent dosage, b) contact time and c) agitation speed.
3.4 Isotherm models for sorption data
Fig. 3 shows the isotherm models that fit the sorption data to describe the removal of cadmium ions onto bentonite reactive material. Constant of these models are listed in Table 1 and they are calculated by using non-linear regression fitting in Excel (2016) utilizing the “Solver” option. It is clear from Fig. 3 in combination with coefficient of determination (R2) mentioned in this table that the two models were able to represent of sorption data for case under consideration. The maximum adsorption capacity for bentonite is equal to 45.3 mg/g as calculated from Langmuir model and the affinity constant of 0.01182 L/mg.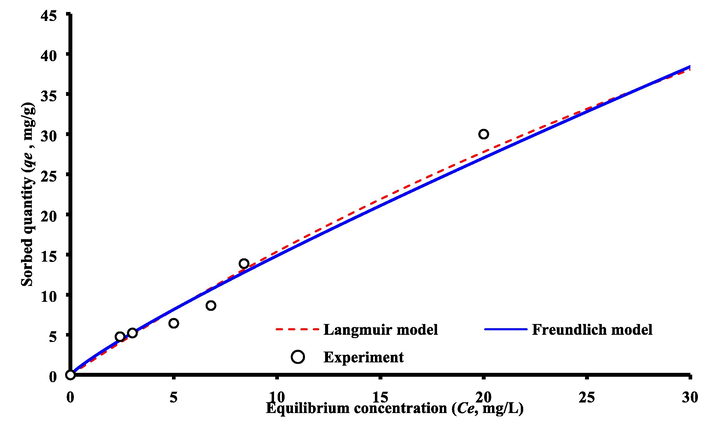
Isotherms models for sorption of cadmium ions onto bentonite.
Model
Parameter
Value
Freundlich
2.03
1.16
R2
0.984
Langmuir
(mg/g)
145.3
b (L/mg)
0.0118
R2
0.989
3.5 Fourier transform infrared (FTIR) analysis
The spectra of FTIR before and after adsorption of cadmium ions onto bentonite is illustrated in Fig. 4. Stretching vibration of structural –OH group for bentonite can be reflected at 3610 cm−1 absorption band. A sharp band at 765 cm−1 represents the quartz admixture in the specimen and this finding is compatible with outputs of XRD analysis. The band at 920 cm−1 may correspond to Al–Al–OH and the Si–O bending vibration can lead to strong absorption band at 1018 cm−1 (Abd Ali et al., 2020; Naji et al., 2019; Saad et al., 2019; WANG et al., 2009). The bands at 3610, 3435 and 1666 cm−1 are responsible of free uncomplexed hydroxyls, hydroxyls bound via hydrogen bonds and bending H–O–H vibration in water, respectively. The bands at 2920, 2812, 1458, 1382 and 709 cm−1 are resulted from presence of aliphatic hydrocarbons in the this material (ATIA, 2008). The quartz and feldspar can be appeared in the other peaks as impurities.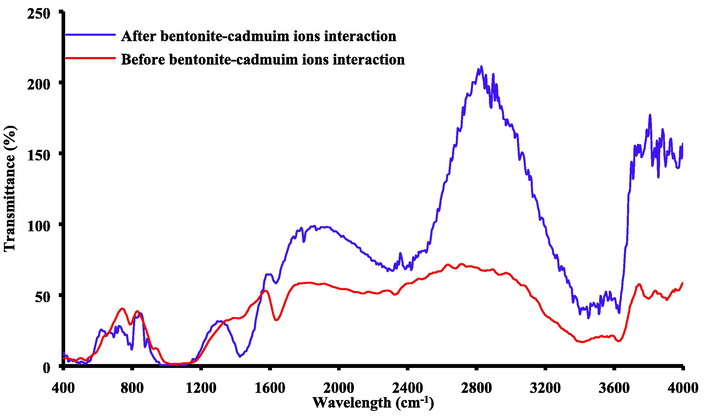
FTIR analysis for bentonite before and after sorption of cadmium ions.
Spectra of FT-IR was in the range from 4000 to 400 cm−1 for distinguishing the locations of adsorbed cadmium ions. The sheets of octahedral and tetrahedral due to the adsorption of these ions can influence on the vibrations of the H2O and Si–O groups. The patterns of FT-IR for bentonite loaded with cadmium showed that there is a shifting in the water broad band in comparison with natural bentonite. Replacement of alkaline metals with cadmium ions for natural bentonite may be the path for occurrence of adsorption process. Montmorillonite is a kind of swelling clay that contains water of hydration. The extent of clay hydration is based on the nature and type of inter-layer cations, temperature and its crystalline structure. Because, the state of hydration for montmorillonite can be reflected through the size of its inter-layer space. The Mg+2 and Fe+3 in bentonite replaced the Si+4 in silicon–oxygen tetrahedron of the montmorillonite; finally, the shifts in the bands certify that the adsorption was the predominant process.
3.6 Cadmium transport in the physical bed model
Mathematical and experimental representations of metal transport in the 2D bed model with embedded of bentonite LPB were introduced. The model depends on the solution of transient solute transport and steady water flow simultaneously by COMSOL package for physical problem mentioned previously; however, all information required to achieve this solution are listed in Table 2. The ability of COMSOL Multiphysics 3.5a in the description of the cadmium ions transport within the sand aquifer containing the bentonite LPB was evaluated by comparison the predictions of the theoretical model with experimental measurements at ports (1, 2, 7) up- and down- gradient of the barrier as plotted in Fig. 5(a). Satisfactory matching can be observed between the theoretical outputs and lab measurements as well as the proposed barrier has a significant role in the protection of locations after LPB; however, an increase in the concentration of the contaminant can recognize with the time.
Item
Parameter/Location
Value
Sand aquifer
Length before LPB (m)
0.50
Length after LPB (m)
0.20
Porosity
0.31
Hydraulic conductivity (m/s)
4.1 × 10⁻⁴
Bulk density (kg/m3)
1733.5
LPB
Length (m)
0.10
Porosity
0.547
Hydraulic conductivity (m/s)
1.98 × 10⁻¹⁰
Bulk density (kg/m3)
1114
Boundary conditions for fluid flow
Hydraulic head (cm) – Line source
5
Hydraulic head (cm) – Outlet side
zero
Zero flux/symmetry – All other sides
------
Boundary conditions for solute transport
Concentration (mg/L) – Line source
50
Advective flux – Outlet side
------
No flux/symmetry – All other sides
------
Initial condition for solute transport
Concentration at t = 0 – flow domain
Zero
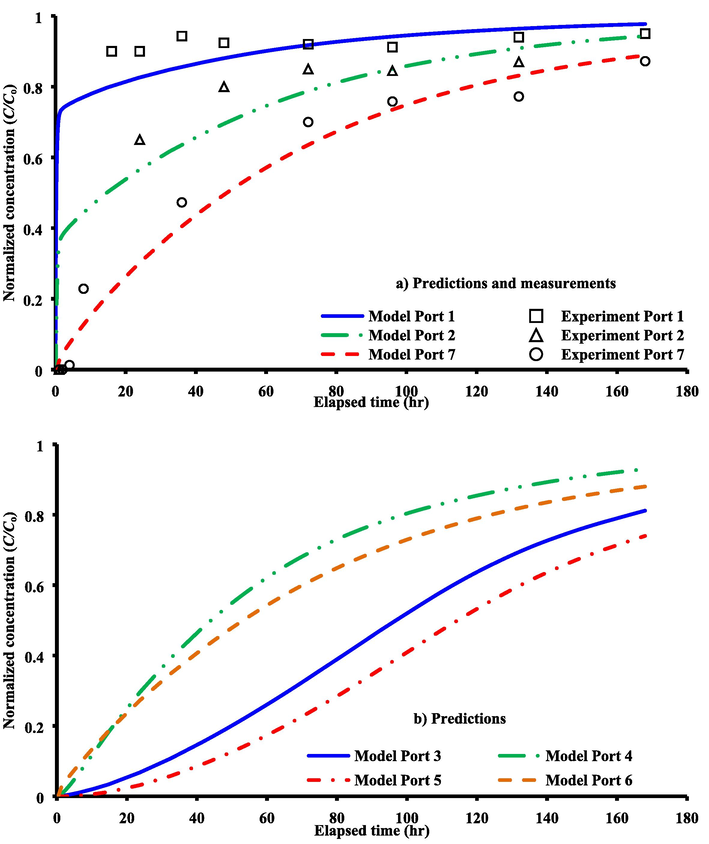
For laboratory 2D sandy soil packed tank with presence of bentonite LPB; a) comparison between COMSOL solution and experimental results at ports 1, 2 and 7; b) predictions by COMSOL package at ports 3, 4, 5 and 6.
Due to the presence of matching between model results and measurements as described previously, this means that the present simulation based on the COMSOL package can be utilized to predict the spatially and temporally normalized concentrations of cadmium ions within the physical problem adopted in this study. Accordingly, Fig. 5(b) is introduced the predictions of breakthrough curves for ports (3, 4, 5, 6) up- and down- gradient of LPB. Fig. 6 elucidates that the concentrations of contaminant have the lowest values in the locations adjacent to the LPB especially in the down gradient side. For present simulations described by COMSOL package, Fig. 6 plots the variation of velocity and hydraulic head under the effect of bentonite LPB embedded in the laboratory 2D sand aquifer. Two stagnant points can be appeared at the up- and down- gradient sides of the barrier along the centerline in the direction of the flow. It seems that there is a change in the advection front nearby the barrier and significant decrease in the flow velocity occurs inside LPB. At specified times, Fig. 7 plots COMSOL outputs for normalized concentration within the flow domain and significant reduction in the propagation rate of advective front with expansion in the lateral directions can be recorded due to presence of LPB after the line source.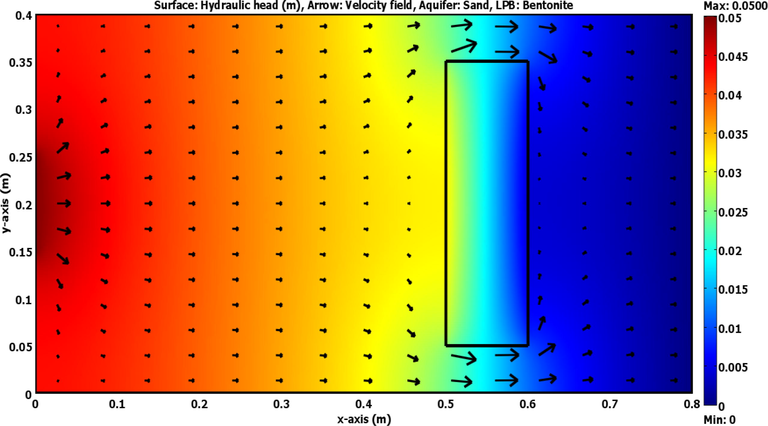
Distribution of hydraulic head and velocity field across the laboratory 2D sandy soil packed tank with presence of bentonite LPB as predicted by the COMSOL software at steady state.
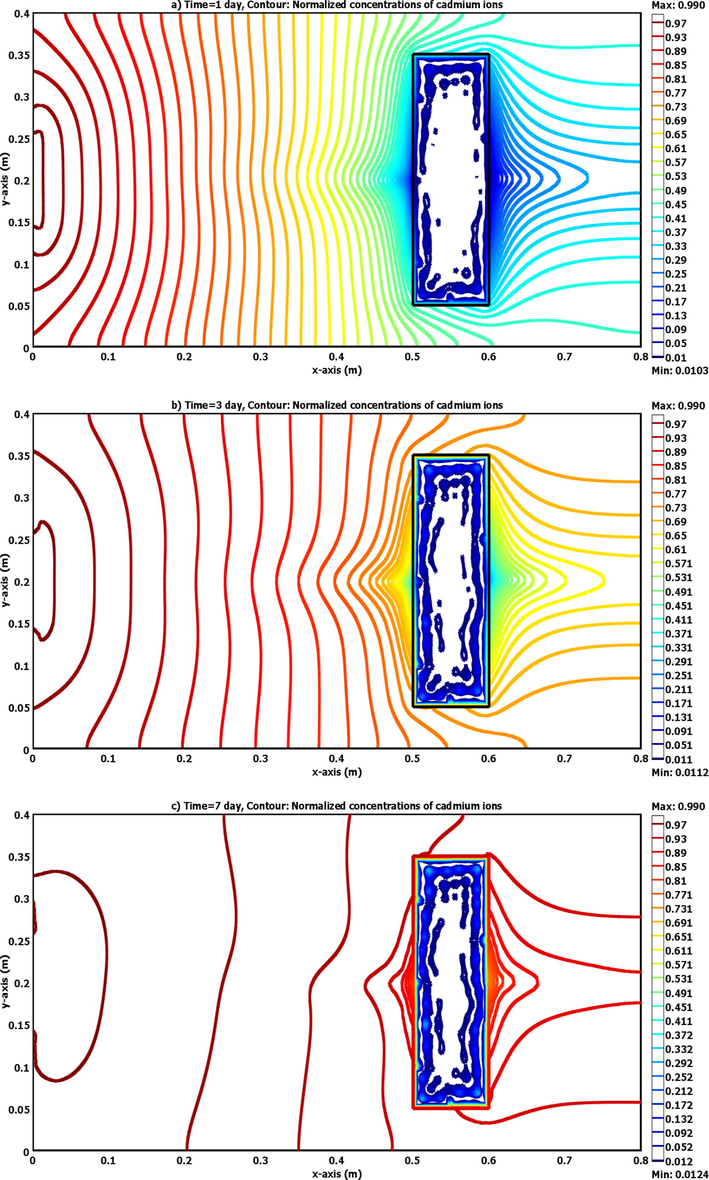
Normalized concentration contours of cadmium ions across the 2D sandy soil packed tank in the presence of bentonite LPB as predicted by the COMSOL software for (a) 1, (b) 3 and (c) 7 day.
The distribution of contaminant up and down gradient of the LPB was introduced when the barrier takes the “continuous configuration”. Another configuration of the bentonite LPB (Fig. S4) was studied based on the verified version of COMSOL package for problem described previously to protect the region beyond the barrier. The predictions of COMSOL package for normalized concentrations at port 5 after 100 days are plotted in Fig. S5. It can be observed that the contaminant concentrations beyond the bentonite in this configuration are decreased significantly in comparison with “continuous configuration”. For example, the C/Co of cadmium at port 5 after 7 days is 0.71 for “continuous configuration” and this value was decreased to 0.01896 for second configuration which will be very effective in the protection of the down gradient barrier.
4 Conclusions
Batch tests for sorption of cadmium ions using bentonite revealed that the removal process can be influenced by contact time, sorbent dosage and agitation speed for specified values of initial pH and initial concentration. To simulate the acetogenic phase in the sanitary landfill, all tests were conducted with initial pH of 3. The best values of the operational conditions for material under consideration were equal to 1 h, 0.7 g/100 mL, and 250 rpm, respectively for 50 mg/L initial concentration to obtain the highest removal efficiency of 90%.
For cadmium-Iraqi bentonite interaction, the sorption measurements were well described by Freundlich and Langmuir models with R2 ≥ 0.98; so, this interaction may be governed by physicochemical forces with maximum sorption capacity of 145.3 mg/g.
Developed mathematical model solved by COMSOL Multiphysics 3.5a describes in a good manner the water flow and contaminant distribution in comparison with experimental measurements within the bed model to specify the efficacy of LPB in the protection of the water resources.
Based on the predicted values of the breakthrough curves, the surrounding of the location by LPB from three sides against the flow direction can be more effective in the protection of this location.
Acknowledgements
We would like to gratefully acknowledge the technical support for Laith A. Naji, Environmental Engineering Department/University of Baghdad and Lulea University of Technology during this work. One of the authors (Mu. Naushad) is grateful to the Researchers Supporting Project number (RSP-2019/8), King Saud University, Riyadh, Saudi Arabia for the support.
Declaration of Competing Interest
The authors declare that they have no known competing financial interests or personal relationships that could have appeared to influence the work reported in this paper.
References
- Predominant mechanisms for the removal of nickel metal ion from aqueous solution using cement kiln dust. J. Water Process Eng.. 2020;33:101033
- [CrossRef] [Google Scholar]
- Removal of ammoniacal nitrogen (N-NH3) from municipal solid waste leachate by using activated carbon and limestone. Waste Manag. Res.. 2004;22:371-375.
- [CrossRef] [Google Scholar]
- Foundry green sands as hydraulic barriers: field study. J. Geotech. Geoenvironmental Eng. 2002
- [CrossRef] [Google Scholar]
- The effects of vertical barrier walls on the hydraulic control of contaminated groundwater. Adv. Water Resour.. 2006;29:89-98.
- [CrossRef] [Google Scholar]
- Adsorption of chromate and molybdate by cetylpyridinium bentonite. Appl. Clay Sci.. 2008;41:73-84.
- [CrossRef] [Google Scholar]
- Removal of Pb(II), Cd(II), Cu(II), and Zn(II) from aqueous solutions by adsorption on bentonite. J. Colloid Interface Sci.. 1997;187:338-343.
- [CrossRef] [Google Scholar]
- Hydraulic conductivity of geosynthetic clay liners to recirculated municipal solid waste leachates. J. Geotech. Geoenviron. Eng. 2016
- [CrossRef] [Google Scholar]
- Waterworks sludge-filter sand permeable reactive barrier for removal of toxic lead ions from contaminated groundwater. J. Water Process Eng.. 2020;33:101112.
- [CrossRef] [Google Scholar]
- An overview of landfill leachate treatment via activated carbon adsorption process. J. Hazard. Mater.. 2009;171:54-60.
- [CrossRef] [Google Scholar]
- Sorption equilibrium of hexavalent chromium on granular activated. Carbon. 2007;52:1-2.
- [Google Scholar]
- Water pollution by cadmium and the onset of itai-itai disease. Water Sci. Technol.. 1992;25:149-156.
- [CrossRef] [Google Scholar]
- Present and long-term composition of MSW landfill leachate: a review. Crit. Rev. Environ. Sci. Technol.. 2002;32:297-336.
- [CrossRef] [Google Scholar]
- Present and long-term composition of MSW landfill leachate: a review present and long-term composition of MSW landfill leachate: a review. Crit. Rev. Environ. Sci. Technol.. 2002;32:37-41.
- [CrossRef] [Google Scholar]
- Bioreactivity of leachate from municipal solid waste landfills - assessment of toxicity. Sci. Total Environ.. 2007;384:171-181.
- [CrossRef] [Google Scholar]
- Batch and Bench-Scale Fixed-Bed Column Evaluations of Heavy Metal Removals From Aqueous Solutions and Synthetic Landfill Leachate Using Low-Cost Natural Adsorbents. Kingston, Ontario, Canada: Queen’s University; 2008.
- Milosevic, M., 2012. Multiple interfaces, in: Internal Reflection and ATR Spectroscopy. doi:10.1002/9781118309742.ch11.
- Modification of Langmuir model for simulating initial pH and temperature effects on sorption process. Sep. Sci. Technol.. 2019;1–8
- [CrossRef] [Google Scholar]
- Characterization of bentonite by XRD and SEM-EDS and use to increase PH and color removal, Fe and organic substances in peat water. J. Clean Energy Technol.. 2013;313–317
- [CrossRef] [Google Scholar]
- Synthesis and characterization of a new starch/SnO2 nanocomposite for efficient adsorption of toxic Hg2+ metal ion. Chem. Eng. J.. 2016;300:306-316.
- [CrossRef] [Google Scholar]
- Separation of toxic Pb2+ metal from aqueous solution using strongly acidic cation-exchange resin: analytical applications for the removal of metal ions from pharmaceutical formulation. Desalin. Water Treat.. 2015;53:2158-2166.
- [CrossRef] [Google Scholar]
- Photodegradation of toxic dye using Gum Arabic-crosslinked-poly(acrylamide)/Ni(OH)2/FeOOH nanocomposites hydrogel. J. Cleaner Prod.. 2019;241:118263.
- [CrossRef] [Google Scholar]
- Saad, N., Abd Ali, Z.T., Naji, L.A., AAH Faisal, A., 2019. Development of Bi-Langmuir model for description initial pH and temperature effects on the sorption of cadmium onto waste foundry sand. Environ. Eng. Res. doi:10.4491/eer.2019.277.
- Future trends in soil cadmium concentration under current cadmium fluxes to European agricultural soils. Sci. Total Environ.. 2014;485–486:319-328.
- [CrossRef] [Google Scholar]
- Taulis, M., 2005. Metal contaminants in leachate from sanitary landfills. Biogeosci. Fac. Sci. Technol.
- Characterization of GMZ bentonite and its application in the adsorption of Pb(II) from aqueous solutions. Appl. Clay Sci.. 2009;43:164-171.
- [CrossRef] [Google Scholar]
- Identifying turbulent flow in carbonate aquifers. J. Hydrol.. 2017;552:70-80.
- [CrossRef] [Google Scholar]
Appendix A
Supplementary data
Supplementary data to this article can be found online at https://doi.org/10.1016/j.jksus.2020.01.047.
Appendix A
Supplementary data
The following are the Supplementary data to this article:


