

Translate this page into:
Complete sequence and characterization of the Mobula tarapacana (Sicklefin Devilray) mitochondrial genome and its phylogenetic implications
⁎Corresponding authors. inbakandan@sathyabama.ac.in (Inbakandan Dhinakarasamy)
-
Received: ,
Accepted: ,
This article was originally published by Elsevier and was migrated to Scientific Scholar after the change of Publisher.
Peer review under responsibility of King Saud University.
Abstract
Mitochondrial genome sequences provide excellent insight into the study of molecular phylogeny and evolution. Mobula tarapacana (Sicklefin devil ray) has an olive-green to brown colored dorsal surface and darkly colored ventral markings. Due to their grey ventral stripes, fisherman and divers sometimes mistake these species for manta rays. To avoid the misidentification during bycatch and to increase the scientific knowledge of this resource as per the SDG Target 14.A, the complete mitogenome sequence of Sicklefin devil ray was sequenced, annotated, and submitted to the GenBank (Accession: MH669414.1). The mitogenome of M. tarapacana is a closed circular dsDNA of 5, 686 bp in size, which transcribes into 13 protein-coding genes (PCGs), 22 tRNAs, and 2 rRNAs. The percentage of protein-coding genes in the genome was 60.30%. Each protein-coding gene is initiated with an ATG codon excluding COX1 and ATP8 that begin with GTG and CCT respectively. Leu (L) and ser (S) were the most common abundant amino acids in the PCGs. The phylogenetic relationship and evolutionary distances were constructed by maximum likelihood approach using MEGA X software. The reported mitogenome was closely related to Mobula kuhlii (MKU MG10, KM364987) and Mobula eregoodootenkee (NC 025954).
Keywords
Mobula tarapacana
Mitogenome
Sequencing
Annotation
Phylogeny

1 Introduction
Ray species are extensively available elasmobranchs in tropical and warm water regions. In which, the Myliobatidae family is a larger, unique, and highly non-stationary group that consists of 2 genera known as Mobula and Manta rays. These ray species are known for their feeding habit, i.e., they are filter-feeding planktivores and piscivores (mostly feed on fishes). These species are migratory and are crossing boundaries from oligotrophic regions to subtropical regions and travel across many deep oceans in their life span. It is most usually seen in the oceanic environment, though it may also be present in the neritic zone (Compagno, 1999; Couturier et al., 2012).
M. tarapacana is morphologically identified by having a long head with shorter horns, shorter cephalic region and vertically elongated spiracle. The dorsal fins are strongly curved and are in uniform olive green colour. There is a missing white spot and a stinging spine behind the dorsal fin and the tails are shorter than the disc width. These species were repeatedly reported on the Asia-pacific, Indian and Atlantic coastline (Marshall, 2009). Most importantly, M. tarapacana and M. japanica species are reported throughout the year in the India and Sri Lanka coastal regions (Fernando & Stevens 2011).
Studies about M. tarapacana population dynamics, ecology and life history are very rare because of their migratory behavior. This species will grow up to 3700 mm wingspan, the males are maturing at 2340 – 2522 mm wingspan and information about maturity of a female is uncertain (White et al. 2006). Currently, the Mobulid populations and the catching have declined all over the region (Raje et al. 2007).
The primary cause of vulnerability and decline of ray species is due to increased targeted and by-catch fishery. Mobulid species captured and utilized especially for gill plates that are applied in pharma and food products in several countries. This species was captured using gill, purse-seine, trawl nets and long-lines, which makes it more vulnerable. Mobulidae exhibit some conservatory characters, which led to the overexploitation of the species. It takes 5 to 6 years to attain sexual maturity and reproduction. It has a longer gestation period and a low fecundity value (Couturier et al., 2012). Due to these reasons, the Convention on International Trade in Endangered Species of Wild Fauna and Flora (CITES) advised that the entire Mobulids could be enlisted in Appendix II. Recently, the IUCN declared Mobula tarapacana sicklefin devil ray (Phillipi, 1892) as an “endangered” list (Marshall et al., 2019).
The identification of Mobula and Manta species are uncertain by the cause of their taxonomy. The similarities of species generate ambiguity in identification (Couturier et al., 2012). To avoid the misidentification during the bycatch and to increase the scientific knowledge of this resource as per the SDG Target 14.A, the complete mitogenome sequence information of M. tarapacana was studied in an attempt to aid to draw a distinction.
The ecological features and life stories of the Mobulidae reveal that they are exposed to extinction. The evolution history of Mobulidae can be accomplished by molecular phylogenetic inferences and a complete taxonomic sampling. However, this can be achieved through mitochondrial genome sequencing of the species (Aschliman, 2011). Mitogenome sequencing using NGS platforms would delimit the species boundaries among fishes and may give full insights into the evolutionary dynamics taking place (Miya and Nishida, 2015).
The analysis of the relatively conserved protein-coding genes revealed species and genus level interlinks with much higher resolution than the rRNA genes. To evaluate the relationship among closely related species, the whole mitogenome analysis is necessary, with which we can predict much accurate interspecies variation and evolution (Shao and Barker, 2006).
The present analysis affirms the whole mt genome sequence of Mobula tarapacana that frequently caught on the southeast coast of Tamil Nadu, India. These sequencing results give clear evidence of the phylogeny and evolutionary pattern of M. tarapacana.
2 Materials and methods
2.1 Sample collection and mitochondrial DNA extraction
Mobula tarapacana tissue sample was collected from Nagapattinam (10°45′04′' N and 79° 50′46′' E) fish landing centre, Tamil Nadu, India. The collected tissue sample was preserved in liquid nitrogen and carried to the laboratory. The mtDNA was extracted using QIAamp DNA Micro Kit (Cat.No: 56304, Germany) followed by manufacturer's instructions. The purity of DNA was analysed using NanoDrop 2000 spectrophotometer (Thermo fisher scientific, USA). Also, the quantity of the DNA was examined by Qubit fluorometer (Thermo Fisher Scientific, USA).
2.2 Construction of 2 × 150 NextSeq500 shotgun library
The pure DNA was extracted using TruSeq Nano DNA Library Prep Kit (Illumina, San Diego, California, USA) of the paired-end sequencing library. DNA fragmentation was carried out using Covaris M220 with the mean fragment dissemination of 350 bp. Covaris dissolution results in dsDNA fragments with 3′ or 5′ overhangs. The fragmented overhangs are subjected to blunt ends with the help of an end-repair mix. The 3′ overhangs were removed during the 3′ to 5′ exonuclease activity and also polymerase activity of the 5′ to 3′ overhangs occupies the 5′ overhangs followed by adapter association with the fragments. This scenario provides a low rate of fragment formation. Size selection of the fragments was done using AMPure XP beads. PCR amplification with Index primer was carried out to the size-selected fragments. The ends of the DNA fragments were tied up with the indexing adapters as they were prepared for assimilation onto a flow cell.
2.3 Cluster generation and sequencing
NextSeq500 was loaded with PE Illumina libraries for cluster formation and further sequencing. The Qubit Concentration and the Mean peak value of Agilent TapeStation 4200 were also loaded with other library inputs. Forward and backward direction sequencing was possible through paired-end sequencing on the NextSeq500 platform. In the paired-end flow cell, samples were tied together with the oligonucleotide adapters using kit reagents. These oligos were responsible for selective cleavages on the forward strands and re-synthesis of the complimentary strand throughout the process. The backward sequencing was done in a counter direction and the opposite end of the fragment with the reverse strand of the previous sequence.
2.4 Sequence assembly and annotation
The high-quality pair-end reads acquired from Illumina NextSeq 500 platform were reference-based assembled by SeqMan NGen (DNASTAR Inc., Madison, WI, USA). Sequence alignment was described by NCBI nucleotide database with blastn tool (https://blast.ncbi.nlm.nih.gov/Blast.cgi). PCR amplification was done with the help of standard method (Sun et al., 2016). The characteristic of the assembled mitogenome of M. tarapacana was assessed by MitoAnnotator (http://mitofish.aori.u-tokyo.ac.jp/annotation/input.html) (Iwasaki et al., 2013).
2.5 Mitogenome analysis
The structural modification of the identified transfer RNAs (tRNAs) was predicted using the tRNAmod platform (https://webs.iiitd.edu.in/raghava/trnamod/index.html). OGDRAW 1.2 platform was used for generating the circular mitochondrial genome of M. tarapacana (https://chlorobox.mpimp-golm.mpg.de/OGDraw.html) (Lohse et al., 2013). MEGA 6.0 software was used in the analysis of nucleotide composition and codon usage bias (Tamura et al., 2013). The bioinformatic tool DnaSp 5.10.01 were used to calculate the ratio of synonymous and non-synonymous codon usage between the protein coding genes of different species (Rozas, 2009). The following formula AT-skew = (A − T)/ (A + T) and GC-skew = (G − C)/ (G + C) were used for calculating the A + T composition of whole Mitogenome of protein-coding genes (PCGs), tRNA, rRNA and control regions. (Junqueira et al., 2004).
2.6 Phylogenetic analysis
The phylogenetic analysis was performed on the Mobula species were studied using Maximum Likelihood methods, with the dataset of 21 species containing the nucleic acid and concatenated amino acid sequences. Bootstrap values were calculated using 1,000 replicates to assess node support. Evolutionary analyses were done using MEGA X (Kumar et al., 2018).
3 Results and discussion
3.1 Deciphering the mitochondrial genome
An isolated mitochondrial DNA was sequenced with Illumina NextSeq500 platform. Sequencing has resulted in 7,800,506 reads, with a minimum read length of 300 bp. The high-quality data of 2.3 GB was generated and processed to decode the mitochondrial genome. The sequencing analysis has identified the circular mitochondrial genome of Mobula tarapacana with a size of 15,686 bp, and submitted it to GenBank (accession number MH669414.1). An online tool MitoAnnotator were used for annotate the M. tarapacana mitogenome (Iwasaki et al., 2013). In total of 37 genes were annotated which includes 13 protein-coding genes, 22 tRNA genes, and 2 rRNA genes, respectively (Fig. 1). However, the similar mitogenome pattern has been reported in other Mobula species like Mobula thurstoni, Mobula mobular, Mobula japonica. These results are in strongly supported with fish mitogenome (Miya and Nishida, 1999).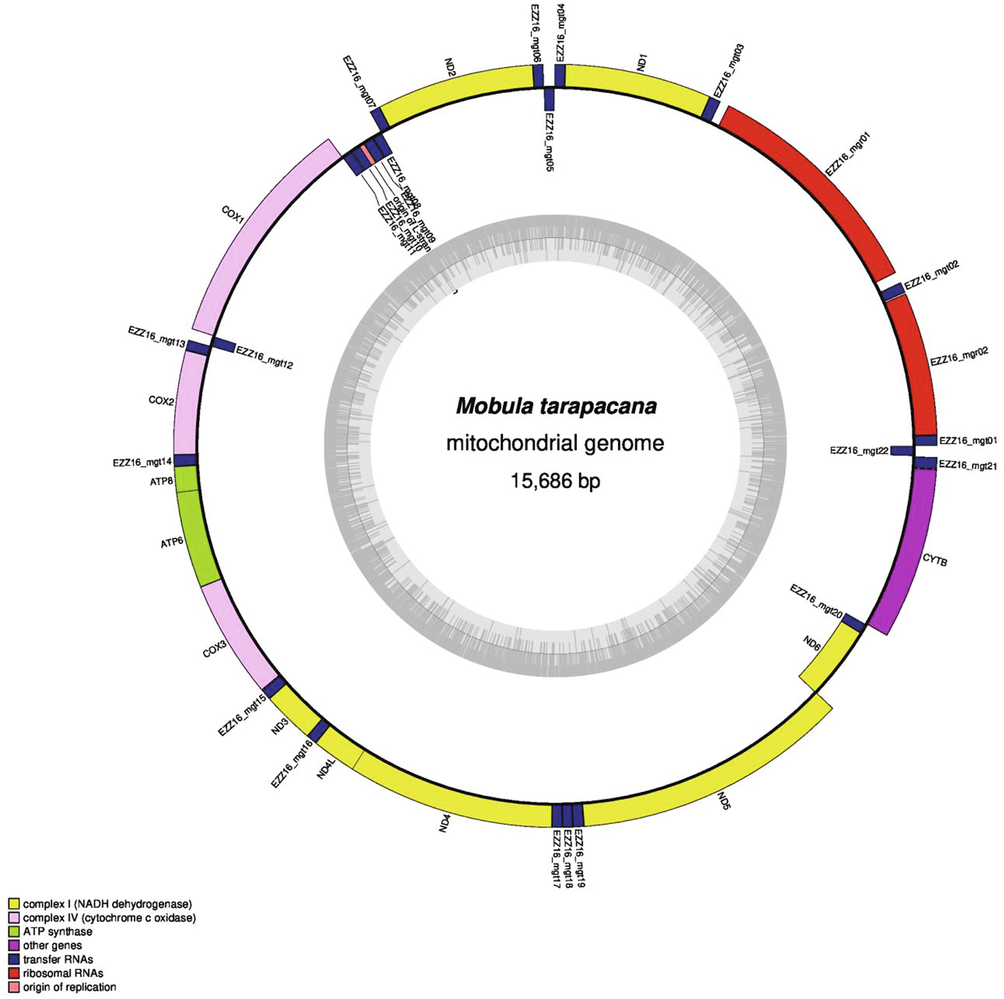
Map of the Mobula tarapacana mitochondrial genome. The innermost circle of the images represents GC% per every 5 bp of the mitogenome; the darker lines are, the higher their GC%.
The nucleotide composition of M. tarapacana was observed and A + T content was found to be 60.74% of the whole mitogenome. The A + T content of PCGs, tRNA, and rRNA constitutes 60.30%, 62.76%, and 61.33% of the whole mitogenome respectively. The positive AT skewness (0.02) was observed in the whole mitogenome which is lower than other Mobula species representing the presence of higher adenine (As) compared with thymine (Ts). The negative GC skewness (-0.32) represents the presence of more cytosine (Cs) compared with guanine (Gs), which is similar to other Mobula species (Table 1). Previous studies reported that the base composition bias was playing the significant part in the transcription and replication process (Chang and Clayton, 1986).
Species
Size (bp)
A%
T%
G%
C%
A + T%
AT Skewness
GC Skewness
Whole mitogenome
M. tarapacana
15659.00
30.88
29.86
13.32
25.95
60.74
0.02
−0.32
M. eregoodootenkee
15715.00
30.26
28.57
13.79
27.38
58.83
0.03
−0.33
M. thurstoni
17609.00
30.69
29.10
13.69
26.51
59.80
0.03
−0.32
M. mobular
18913.00
32.92
29.72
12.63
24.73
62.63
0.05
−0.32
M. japanica
18853.00
32.73
29.77
12.79
24.71
62.50
0.05
−0.32
M. munkiana
15677.00
30.54
28.50
13.47
27.49
59.04
0.03
−0.34
M. kuhlii
15710.00
30.29
28.57
13.77
27.37
58.86
0.03
−0.33
Protein-coding genes
M. tarapacana
11,236
28.47
31.83
13.12
26.58
60.30
−0.06
−0.34
M. eregoodootenkee
11,439
27.90
30.26
13.55
28.30
58.15
−0.04
−0.35
M. thurstoni
11,439
27.85
30.38
13.60
28.17
58.23
−0.04
−0.35
M. mobular
11,440
28.66
31.14
12.95
27.25
59.80
−0.04
−0.36
M. japanica
11,119
28.51
31.28
13.22
26.99
59.79
−0.05
−0.34
M. munkiana
11,403
28.07
30.40
13.25
28.27
58.48
−0.04
−0.36
M. kuhlii
11,435
27.87
30.27
13.55
28.32
58.14
−0.04
−0.35
tRNA
M. tarapacana
1552
32.41
30.35
19.72
17.53
62.76
0.03
0.06
M. eregoodootenkee
1554
31.79
29.67
20.27
18.28
61.45
0.03
0.05
M. thurstoni
1557
32.11
29.99
20.10
17.79
62.11
0.03
0.06
M. mobular
1556
32.46
29.88
19.79
17.87
62.34
0.04
0.05
M. japanica
1617
32.16
29.68
20.41
17.75
61.84
0.04
0.07
M. munkiana
1480
32.23
30.41
19.86
17.50
62.64
0.03
0.06
M. kuhlii
1554
31.85
29.79
20.21
18.15
61.65
0.03
0.05
rRNA
M. tarapacana
2661
34.87
26.46
17.06
21.61
61.33
0.14
−0.12
M. eregoodootenkee
2664
34.65
25.86
17.27
22.22
60.51
0.15
−0.13
M. thurstoni
2671
34.74
25.91
17.26
22.09
60.65
0.15
−0.12
M. mobular
2663
34.89
25.46
17.27
22.38
60.35
0.16
−0.13
M. japanica
2660
34.89
25.49
17.26
22.37
60.38
0.16
−0.13
M. munkiana
2665
34.82
25.14
17.30
22.74
59.96
0.16
−0.14
M. kuhlii
2664
34.68
25.19
17.23
22.15
59.87
0.16
−0.12
Control region
M. tarapacana
ND
ND
ND
ND
ND
ND
ND
ND
M. eregoodootenkee
ND
ND
ND
ND
ND
ND
ND
ND
M. thurstoni
1884
34.08
32.38
12.74
20.81
66.45
0.03
−0.24
M. mobular
3199
43.11
32.14
9.22
15.54
75.24
0.15
−0.26
M. japanica
3164
42.54
32.24
9.83
15.39
74.78
0.14
−0.22
M. munkiana
ND
ND
ND
ND
ND
ND
ND
ND
M. kuhlii
ND
ND
ND
ND
ND
ND
ND
ND
The bases of 2 gene regions overlapped with their neighbouring genes, from 2 −5 bp in size. The predominant overlapping region observed among ND4L and ND4 with a size of 5 bp. The intergenic spacer nucleotides were observed in 18 places ranging from 1 − 144 bp and the longest spacing sequence of 144 bp was detected between tRNA- Lys and ATP6 (Table 2).
Locus_name
One letter code
From
To
Size
Strand
No of amino acids
Anti-codon
Inferred initiation codon
Inferred termination codon
GC_percent (%)
Intergenic nucleotides*
tRNA-Phe
F
1
69
69
H
GAA
31.9
0
12S-rRNA
70
1032
963
H
40.8
0
tRNA-Val
V
1033
1104
72
H
TAC
40.3
0
16S-rRNA
1105
2805
1701
H
37.5
0
tRNA-Leu
L
2806
2880
75
H
TAG
41.3
1
ND1
2882
3856
975
H
324
ATG
TAA
40.3
1
tRNA-Ile
I
3858
3927
70
H
GAT
40.0
2
tRNA-Gln
Q
3930
4001
72
L
TTG
34.7
0
tRNA-Met
M
4002
4070
69
H
CAT
39.1
0
ND2
4071
5116
1046
H
348
ATG
TA
39.2
0
tRNA-Trp
W
5117
5186
70
H
TCA
28.6
1
tRNA-Ala
A
5188
5256
69
L
TGC
36.2
1
tRNA-Asn
N
5258
5330
73
L
GTT
37.0
34
tRNA-Cys
C
5365
5432
68
L
GCA
41.2
5
tRNA-Tyr
Y
5438
5507
70
L
GTA
47.1
1
COXI
5509
7065
1557
H
518
GTG
TAA
39.2
4
tRNA-Ser
S
7070
7140
71
L
GCT
40.8
0
tRNA-Asp
D
7141
7208
68
H
GTC
36.8
2
COXII
7211
7901
691
H
230
ATG
TTT
39.2
0
tRNA-Lys
K
7902
7976
75
H
TTT
38.7
144
ATP6
8121
8755
635
H
211
ATG
TCT
37.7
0
ATP8
8756
8788
33
H
10
CCT
CTA
41.9
0
COXIII
8789
9574
786
H
261
ATG
TAA
42.9
4
tRNA-Gly
G
9579
9650
72
H
TCC
27.8
0
ND3
9651
9999
349
H
116
ATG
AAT
39.5
0
tRNA-Arg
R
10000
10,070
71
H
TCG
31.0
0
ND4L
10071
10,367
297
H
98
ATG
TAA
45.5
−5
ND4
10361
11,741
1381
H
460
ATG
CCT
39.6
0
tRNA-His
H
11742
11,810
69
H
GTG
18.8
1
tRNA-Ser
S
11812
11,878
67
H
GCT
37.9
1
tRNA-Leu
L
11880
11,951
72
H
TAG
39.4
1
ND5
11953
13,794
1842
H
613
ATG
TAA
40.2
−2
ND6
13791
14,312
522
L
173
ATG
TAG
39.8
0
tRNA-Glu
E
14313
14,381
69
L
TTC
33.3
6
Cytb
14388
15,530
1143
H
380
ATG
TAA
40.5
3
tRNA-Thr
T
15534
15,606
73
H
TGT
54.8
10
tRNA-Pro
P
15617
15,686
70
L
TGG
41.4
0
3.2 Protein-coding genes
There are 13 protein-coding genes obtained from the mitogenome of M. tarapacana with the length of 11, 236 bp, which was shorter than other Mobula species except for Mobula japanica, though it covers 60.30% of A + T content. The start codon ATG was used as a canonical putative initiative for all PCGs, except COX1 and ATP8 where they use GTG and CCT as a start codon respectively. These features of initial start and stop codons are generally ascertained in all elasmobranchs (Liu et al., 2013). This was common among all vertebrate mitogenomes (Yue et al., 2016). Among 13 PCGs, 12 of them were determined by heavy strand (ND1, ND2, COXI, COXII, ATP6, ATP8, COXIII, ND3, ND4L, ND4, ND6, Cytb) and ND6 was stated by light strand. The protein-coding genes ND1, COXI, Cytb, COXIII use TAA as termination codon, whereas ND3, ND4L, ND5 use AAT as a termination codon. Likewise, COXII, ATP6, ATP8, ND4, and ND6 use TTT, TCT, CTA, CCT, and TAG respectively. ND2 was encoded by an incomplete termination codon TA (Table 2). The same decoding pattern was observed in the vertebrate mitogenome and extended to a complete TAA termination codon via post-transcription polyadenylation (Pindaro et al., 2016).
The predominant amino acids predicted in the protein-coding genes (PCGs) of M. tarapacana were leucine, proline, and serine in the range of 12.51%, 8.24%, and 10.34% respectively (Table 3). The number of codon usage within the PCGs of M. tarapacana was compared with other Mobula species, and it revealed that leucine, serine, and proline were higher in all species (Figs. 2 & 3).
Amino acid
Codon
Number
Frequency
(%) RSCU
Amino acid
Codon
Number
Frequency
(%) RSCU
Ala
GCC
66
1.27
1.36
Thr
ACT
117
2.25
1.25
GCA
53
1.02
1.09
CAT
105
2.02
1.07
GCT
62
1.19
1.28
Ile
ATT
165
3.17
1.28
GCG
13
0.25
0.27
ATC
92
1.77
0.72
Arg
CGA
37
0.71
1.36
Leu
TTA
169
3.25
1.56
CGT
23
0.44
0.84
CTA
128
2.46
1.18
CGC
34
0.65
1.25
CTT
139
2.67
1.28
CGG
15
0.29
0.55
CTC
112
2.15
1.03
ASN
AAT
147
2.82
1.1
TTG
62
1.19
0.57
AAC
121
2.33
0.9
CTG
41
0.79
0.38
ASP
GAT
47
0.90
1.03
Lys
AAA
195
3.75
1.45
GAC
44
0.85
0.97
AAG
74
1.42
0.55
CYS
TGT
41
0.79
1.05
Met
ATA
125
2.40
1.37
TGC
37
0.71
0.95
ATG
57
1.10
0.63
Gln
CAA
121
2.33
1.39
Phe
TTT
138
2.65
1.05
CAG
53
1.02
0.61
TTC
125
2.40
0.95
GAA
63
1.21
1.17
Pro
CCA
120
2.31
1.12
GAG
45
0.86
0.83
CCC
98
1.88
0.91
Gly
GGA
47
0.90
1.31
CCT
177
3.40
1.65
GGC
31
0.60
0.87
CCG
34
0.65
0.32
GGT
48
0.92
1.34
Ser
TCA
109
2.09
1.22
GGG
17
0.33
0.48
TCT
138
2.65
1.54
His
92
1.77
0.93
TCC
119
2.29
1.33
AGC
84
1.61
0.94
TCG
33
0.63
0.37
AGT
55
1.06
0.61
Trp
TGA
86
1.65
1.3
ACG
29
0.56
0.31
TGG
46
0.88
0.7
Stp*
TAA
153
2.94
1.72
Tyr
TAT
137
2.63
1.08
AGA
60
1.15
0.67
TAC
116
2.23
0.92
AGG
65
1.25
0.73
Val
GTA
44
0.85
1.28
TAG
78
1.50
0.88
GTT
44
0.85
1.28
Thr
ACA
111
2.13
1.18
GTC
29
0.56
0.85
ACC
118
2.27
1.26
GTG
20
0.38
0.58
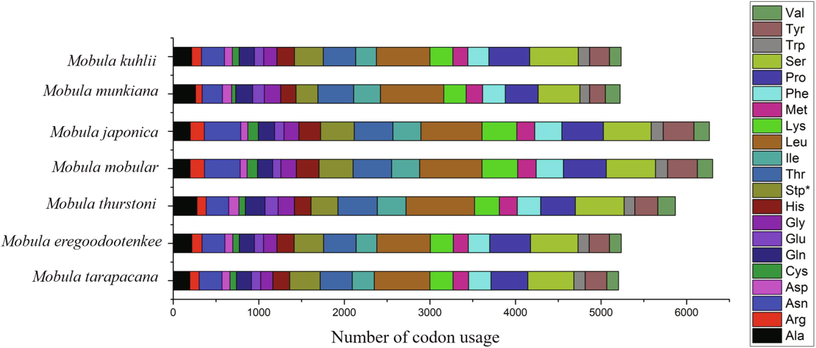
Comparison of codon usage within the mitochondrial genome of members of the Mobula species (Mobula tarapacana, Mobula eregoodootenkee, Mobula thurstoni, Mobula mobular, Mobula japonica, Mobula munkiana and Mobula kuhlii).
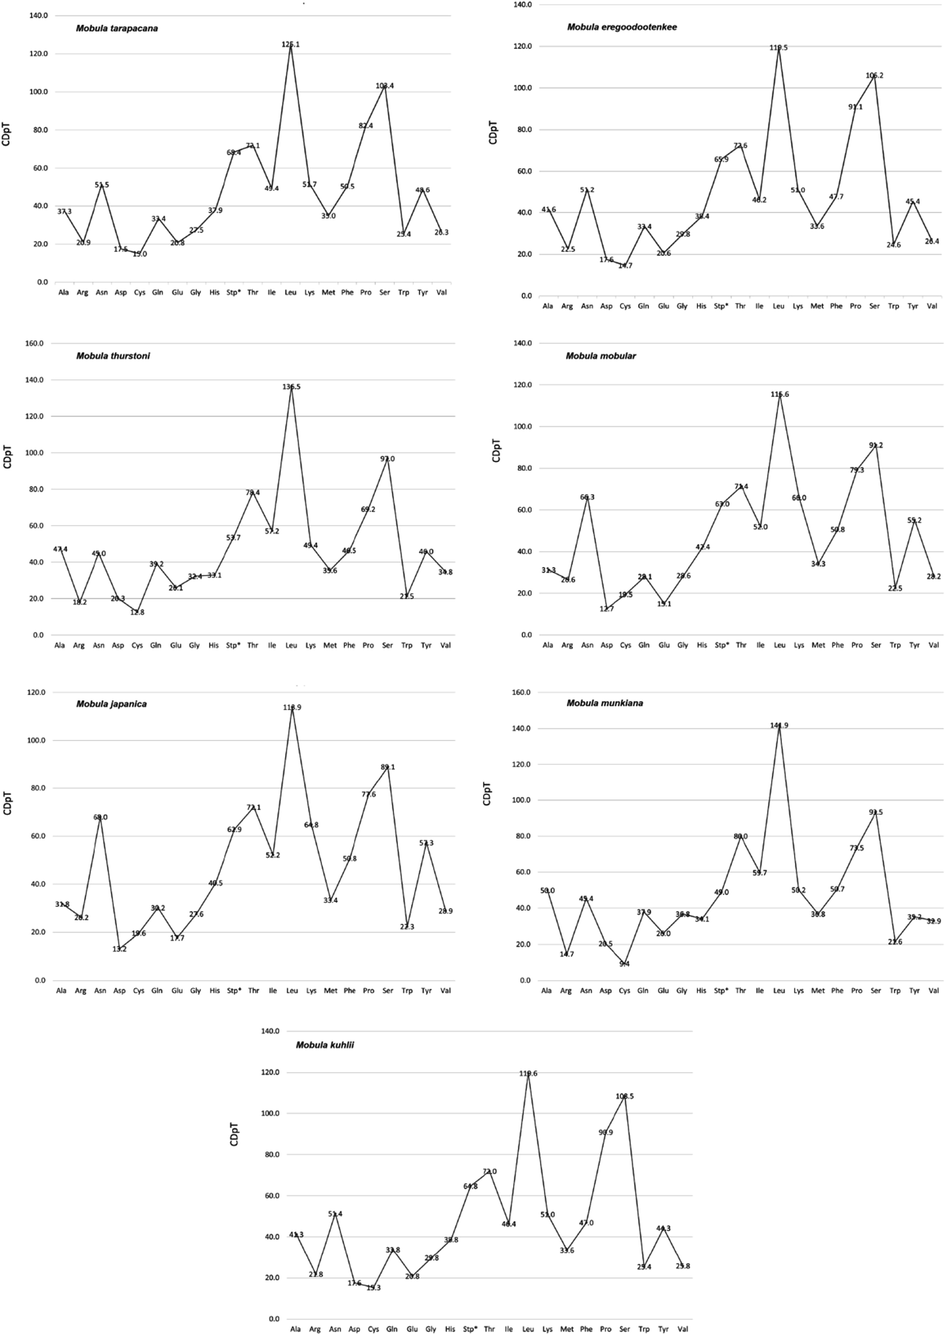
Codon distribution in members of seven species in the Mobula. CDspT = codons per thousand codons.
3.3 Transfer RNAs (tRNA) and ribosomal RNAs (rRNA)
The tRNA act as a vital role in adaptor molecule during the protein synthesis. The tRNAs of M. tarapacana was 1552 bp in length with 62.76% of A + T content, which includes 32.41% A, 30.35% T, 19.72% G and 17.53% C. AT skewness of tRNA of M. tarapacana was 0.03 whereas the GC skewness was 0.06 which was similar with some Mobula species. The rRNA of the M. tarapacana mitochondrial genome was 2661 bp in length and covers 61.33% of A + T content. Here the As (34.87%) are higher than Ts (26.46%) resulting in a positive AT skewness of 0.14 which was lower than other Mobula species. Similarly, Gs (17.06%) was lower than Cs (21.61%) resulting in a negative GC skewness of 0.12 which is similar to M. thurstoni and M. kuhlii (Table 1). There are 22 tRNA molecules predicted in M. tarapacana mitochondrial genome which is about 70–80 nucleotides long and exhibiting a characteristic cloverleaf structure. The Post-transcriptional modifications carried out in rRNA, mRNA, and tRNA molecules leads to a certain stability, translational efficiency, and fidelity of tRNA. The tRNAmod is a tool that is used to identify the modifications carried out in the tRNA structure. Using this tool on M. tarapacana, it was observed that 20 tRNAs were showing the possibility of modifications in their structure, rather 2 of them were not undergoing any modifications (Fig. 4). Codon-anticodon interactions were highly influenced based on the position of modification, which is usually near the wobble position. This property was well preserved in eukaryotes that resulted in regulation of translational efficiency, frameshifting, and maintenance (Ranjan and Rodnina, 2016; Tuorto and Lyko, 2016). The stability of tRNA depends on the changes occurring within the central tRNA structure, which may result in tRNA degradation and pool discrepancy (Lorenz et al., 2017).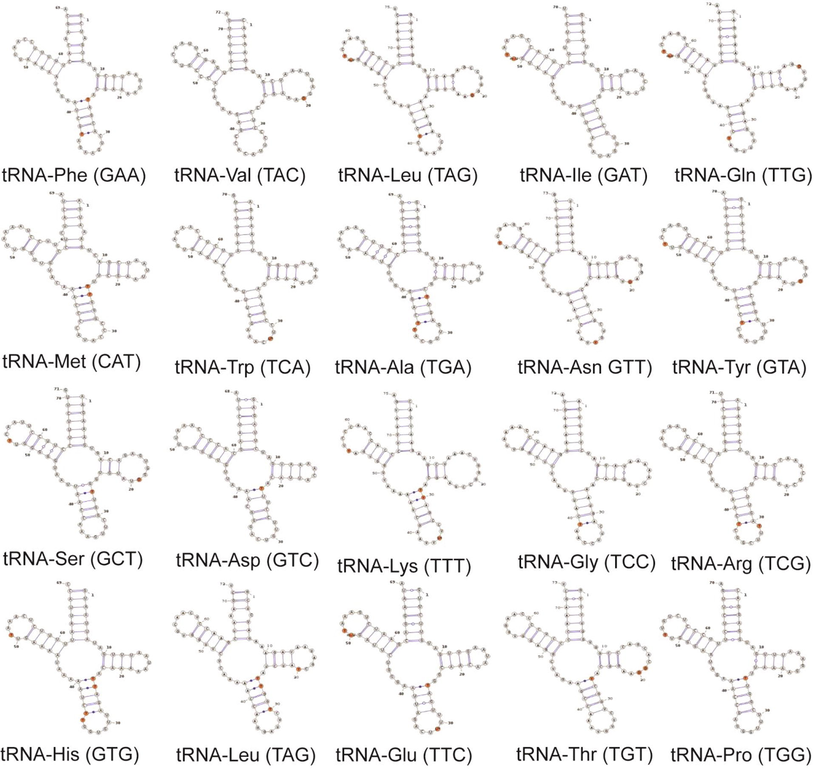
Schematic representation of tRNA modification in mitogenome of M. tarapacana.
3.4 Codon usage bias and the control region
The control region of M. tarapacana, M. eregoodootenkee, M. munkiana, and M. kuhlii were not defined, while a few Mobula species have the control region information of their mitochondrial genome (Table 2). The previous finding revealed, the mitochondrial DNA act as a tool for studying various classes of fish including teleost and elasmobranch. They were focused on the control region (CR) as a marker for studying intraspecific variations. The control region exhibits variation in many vertebrates comprising teleosts (Aquadro & Greenberg, 1983), Humans (Lee et al., 1995), and birds (Wenink et al., 1994). Martin et al. (1992) reported the evolutionary rates of elasmobranchs in mitochondrial genes are minimum compared with other vertebrates. In contrast, it is difficult to find out the difference between diverse populations with commonly used CR sequencing approaches. The present study focused on the mitogenome markers except for the control region for the phylogenetic evaluation of M. tarapacana. The Relative synonymous codon usage concerning amino acid utilization of the mitochondrial genome of M. tarapacana and their closely related species were exhibited in Table 3 and Fig. 5. Relative synonymous codon usage (RSCU) analysis of PCGs in M. tarapacana revealed that the amino acid codons encoding Leu, Pro, Ser, Stp, Lys, Thr, Asn, and Ile were the most recurrent ones and those encoding Asp and Lys were rare. The usage of hydrophobic amino acid codons is comparatively higher in the vertebrate mitogenome than general nuclear genome (Satoh et al., 2010). This indicates that the genomic region closer to CR is highly used, hence exhibiting high translational efficiency. This can result in a favorable translation in the vertebrate mitogenome.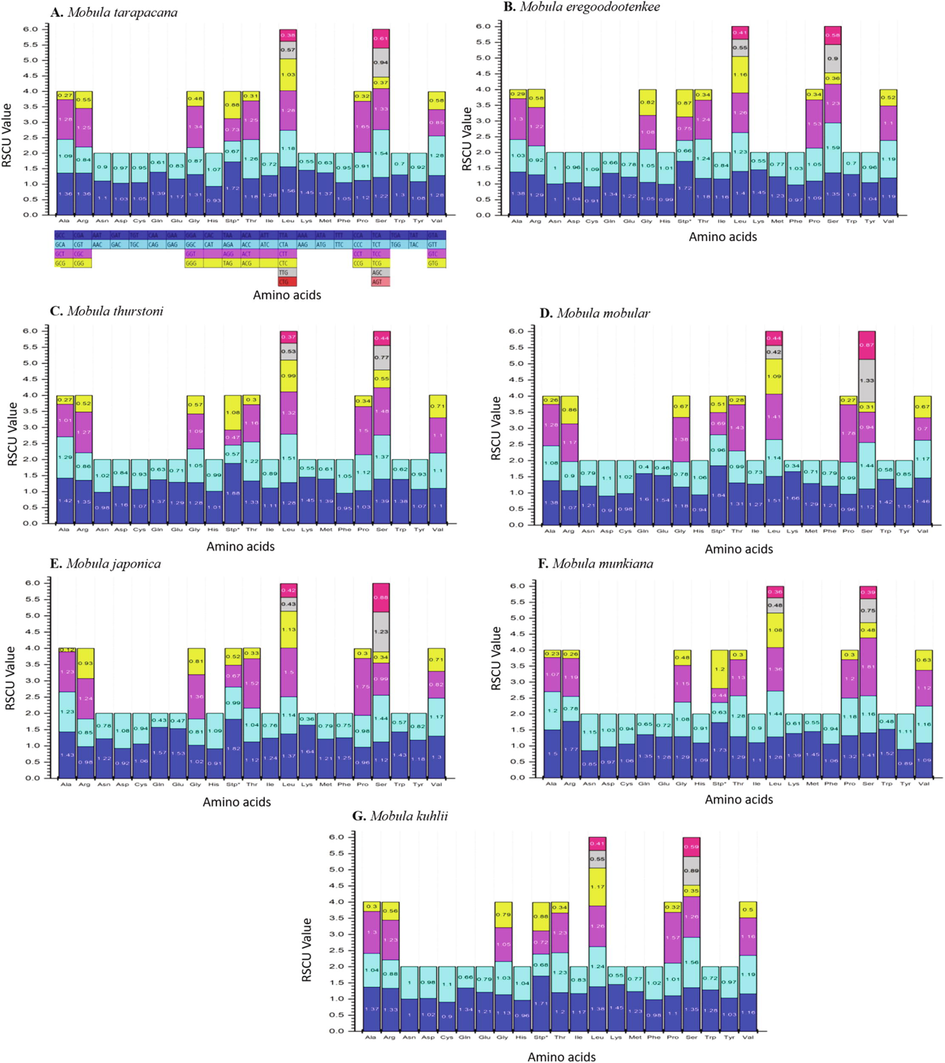
Relative Synonymous Codon Usage (RSCU) of the mitochondrial genome of seven species in the Mobula. Codon families are plotted on the x-axis. Codons indicated above the bar are not present in the mitogenome.
3.5 The nucleotide substitution of PCGs
Two homologous PCGs of closely related species were compared to find out the evolutionary behavior of similar species. The Ka/Ks ratio was the key to evaluate this evolutionary behavior. The Value of Ka = Ma/Na, the number of nonsynonymous substitutions observed divided by the total number of nonsynonymous changes in the entire gene sequences of two species. Similarly, Ks = Ms/Ns, the number of synonymous substitutions observed divided by the total number of synonymous changes in the entire gene sequences of two species. Hence, the Ka/Ks ratio reflects the rate of evolutionary changes that occurred throughout the sequence and also reflects the selective pressure on the evolution of the organism. Ka/Ks > 1, Ka = Ks and Ka/Ks < 1 are the possible cases and correspond to positive, neutral, and negative selection respectively (Li et al., 2015). The sequence divergence of Mobula mtDNA (Mobula mobular, Mobula tarapacana, and Mobula thurstoni) was determined by Ka and Ks substitution rates. The Ka/Ks value of 13 PCGs is varying from 0.008 (COI) to 1.9 (ATPase8) (Fig. 6).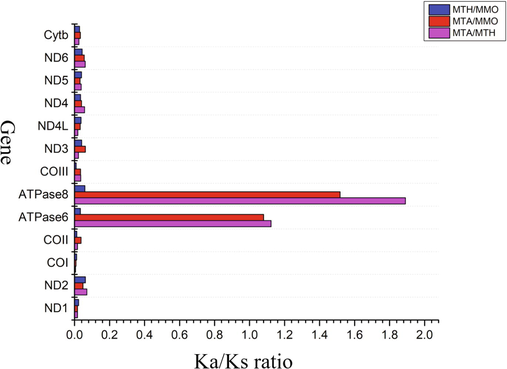
Ka/Ks ratios for the 13 mitochondrial protein-coding genes among the reference Mobula tarapacana, Mobula thurstoni and Mobula mobular.
Here the nonsynonymous substitution rate is faster than the synonymous substitutions taken place. The % ratio of variable sites of MTA/MTH were maximum in ATPase6 and ATPase8 and minimum in the COI gene, signifying that ATPase6 and ATPase8 were broadly distributed and COI was selectively distributed in the mitochondrial proteins. In M. thurstoni and M. mobular, the Ka/Ks ratio was minimum in all 13 protein-coding genes compared to M. tarapacana, indicating that the MMO and MTH had a closer phylogenetic relationship than M. tarapacana.
3.6 Phylogenetic analysis
Phylogenetic investigation of mtDNA is a broadly utilized for outlining the relationship between species (Moritz, 1994) considering its quick pace of succession advancement and fast ancestry arranging comparative with the nuclear genetic material (Avise, 1989). Nevertheless, the data obtained from mtDNA could provide negligible information when small regions are studied. Taxonomy is recognized to be the foundation of the understanding of biodiversity and evolutionary behavior. Phylogenetic analysis on the other hand is used to compare and study the similarities and dissimilarities within a family. Such studies have been challenging due to poor fossil record, misidentification of organism alongside lack of mitochondrial sequence data (Hinojosa-Alvarez et al., 2015). There exist three methods to predict phylogeny, namely maximum parsimony, maximum likelihood, and distance-based phylogenetic methods. Among the three, the maximum likelihood (ML) method yields the closest match and widely accepted among vertebrate genome analysis. The lengthier the branch, causing multiple problems in the Phylogenetic tree due to the nucleotide changes leads to extensive evolutionary patterns (Broughton et al., 2001).
The phylogenetic data from the whole mitochondrial genome data analysis of 21 species and 7 genera in the order: Myliobatiformes. The Maximum likelihood phylogenies of the Mobula species were compatible with the same species. All the clades are in agreement with the bootstrap values and Bayesian posterior probability. There were three clades separated among the Mobula species. The sequence of our strain Mobula tarapacana CK02, MH669414 is closely related to Mobula kuhlii MKU MG10KM364987 and Mobula eregoodootenkee NC 025954. Furthermore, Mobula mobular KT203434 and Mobula japonica JX392983 formed a cluster, and Mobula munkiana MMU MG01KM364990 and Mobula thurstoni NC 037,219 clustered in a separate clade. Given that the sister relationship between Mobula tarapacana CK02MH669414 is closely related to Mobula kuhlii MKU MG10KM364987 based on nucleotide sequence (Fig. 7). Family Mobulidae comprises two genera namely Mobula and Manta. The Mobula genus is holds nine recognized species, whereas the Manta genus has two species. Based on both morphological data and molecular data these species are categorized into 3 clades. The first clade has larger Mobulid species like, M. birostris, M. alfredi, M. tarapacana, M. mobular, and M. japanica. The other two clades include smaller species, three each. M. eregoodootenkee, M. kuhlii, and M. thrustoni belong to the second clade, and M. mukiana, M. hypostoma, and M. rochebrunei belong to the third clade (Muller and Henle, 1841; Aschliman, 2011; Poortvliet and Hoarau, 2013; William et al., 2018).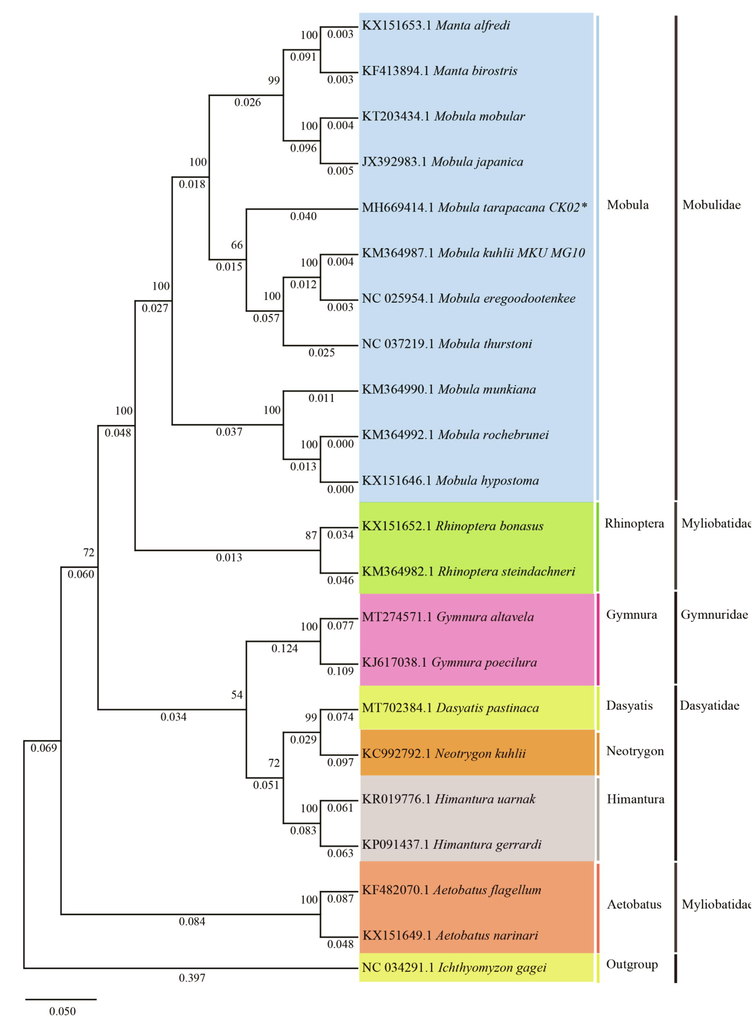
Phylogenetic trees of Mobula tarapacana relationships from the complete genome. The concatenated amino acid datasets and evolutionary history was inferred using the maximum likelihood method. The evolutionary distances were computed using the Poisson correction method and are in the units of the number of amino acid substitutions per site. This analysis involved 21 amino acid sequences. Evolutionary analyses were conducted in MEGA X.
The genetic divergence study reveals genetically indistinguishable pairs in Mobulidae species. Cephalic lode length, tooth morphology, and bronchial filter plate were used as a key to distinguish species of Mobulidae. Morphology along with molecular data analysis shows the indistinguishable nature within a pair of species. M. mobular and M. japanica are morphologically similar except for the difference in tooth morphology, yet further detailed studies revealed the similarities of the species pair at the molecular level (Adnet et al., 2012). M. kuhlii and M. eregoodootenkee share the same evolutionary independent unit based on Phylogenetic analysis (White et al., 2017). Similarly, the molecular data reveals the similarity between M. hypostoma and M. rochebrunei with 100% bootstrap (White et al., 2017). The nuclear exon data reveals a strong link between M. mukiana and M. hypostoma, where the width of the lower tooth band is the only distinguishing morphological features present (William et al., 2018). Morphological features like pectoral fins, tail, and structure beneath and above the first dorsal fin are the key characters to distinguish between interspecies. These morphological studies revealed that these key features remain small in M. tarapacana, compared with M. mobular, M. kuhlii and M. thurstoni (Paig-Tran et al., 2013).
4 Conclusion
The sequencing of the whole mitogenome of Mobula tarapacana reveals the genetic identity and its divergence from closely related species. Ka and Ks substitution rates showing an important observation of selective pressure on different Mobula species. Among 13 PCGs, COX1 shows a low Ka/Ks ratio, while ATPase 6 and ATPase 8 show a higher Ka/Ks ratio. From this observation, we can conclude that the COX1 gene has not been evolved much (Ka/Ks < 1) therefore it could be applied as a tool for evolutionary and phylogenetic analyses. ATPase 6 and ATPase8 genes were much evolved among all PCGs, and play a unique role in interspecies evolution. M. tarapacana shows a much closer relationship with M. kuhlii and M. eregoodootenkee.
Funding
There is no funding involved in this research work from other agencies.
Acknowledgement
The authors are grateful to the management of the Sathyabama Institute of Science and Technology, Chennai for providing necessary facilities to carried out the research work. Funding There is no funding involved in this research work from other agencies.
Declaration of Competing Interest
The authors declare that they have no known competing financial interests or personal relationships that could have appeared to influence the work reported in this paper.
References
- Evolutionary history of the devil rays (Chondrichthyes: Myliobatiformes) from fossil and morphological inference. Zool. J. Linnean Soc.. 2012;166:132-159.
- [Google Scholar]
- Human mitochondrial DNA variation and evolution: analysis of nucleotide sequences from seven individuals. Genetics. 1983;103(2):287-312.
- [Google Scholar]
- The batoid tree of life: recovering the patterns and timing of the evolution of skates, rays and allies. Chondrichthyes: Batoidea; 2011.
- Gene trees and organismal histories: a phylogenetic approach to population biology. Evolution.. 1989;43(6):1192-1208.
- [Google Scholar]
- The complete sequence of the zebrafish (Danio rerio) mitochondrial genome and evolutionary patterns in vertebrate mitochondrial DNA. Genome. Res.. 2001;11(11):1958-1967.
- [Google Scholar]
- Identification of primary transcriptional start sites of mouse mitochondrial DNA: accurate in vitro initiation of both heavy- and light-strand transcripts. Mol. Cell. Biol.. 1986;6(5):1446-1453.
- [Google Scholar]
- An overview of chondrichthyan systematics and biodiversity in Southern Africa. Trans. R. Soc. S. Afr.. 1999;54(1):75-120.
- [CrossRef] [Google Scholar]
- Biology, ecology and conservation of the Mobulidae. J. Fish. Biol.. 2012;80(5):1075-1119.
- [Google Scholar]
- The complete mitochondrial genome of the Giant Manta ray, Manta birostris. Mitochondr. DNA.. 2015;26(5):787-788.
- [Google Scholar]
- MitoFish and MitoAnnotator: a mitochondrial genome database of fish with an accurate and automatic annotation pipeline. Mol. Biol. Evol.. 2013;30(11):2531-2540.
- [Google Scholar]
- The mitochondrial genome of the blowfly Chrysomya chloropyga (Diptera: Calliphoridae) Gene.. 2004;15:7-15. PMID: 15363841
- [CrossRef] [Google Scholar]
- MEGA X: Molecular Evolutionary Genetics Analysis across Computing Platforms. Mol. Biol. Evol.. 2018;35(6):1547-1549.
- [Google Scholar]
- Structure and evolution of teleost mitochondrial control regions. J Mol Evol. 1995;41(1):54-66.
- [Google Scholar]
- Comparative mitochondrial genomics and phylogenetic relationships of the Crossoptilon species (Phasianidae, Galliformes) BMC. Genomics.. 2015;16:42.
- [Google Scholar]
- Complete mitochondrial genome sequence data provides genetic evidence that the brown dog tick Rhipicephalus sanguineus (Acari: Ixodidae) represents a species complex. Int. J. Biol. Sci.. 2013;9(4):361-369.
- [Google Scholar]
- Organellar Genome DRAW a suite of tools for generating physical maps of plastid and mitochondrial genomes and visualizing expression data sets. Nucleic. Acids. Res.. 2013;41(W1):W575-W581.
- [Google Scholar]
- tRNA modifications: Impact on structure and thermal adaptation. Biomolecules.. 2017;7(4):35.
- [CrossRef] [Google Scholar]
- Marshall, A., Barreto, R., Bigman, J.S., Carlson, J., Fernando, D., Fordham, S., Francis, M.P., Herman, K., Jabado, R.W., Liu, K.M., Pardo, S.A., Rigby, C.L., Romanov, E. & Walls, R.H.L. 2019. Mobula tarapacana. The IUCN Red List of Threatened Species 2019: e.T60199A124451161.
- Biology and population ecology of Manta birostris in southern Mozambique. Brisbane, Australia: The University of Queensland; 2009. PhD Thesis
- Rates of mitochondrial DNA evolution in sharks are slow compared with mammals. Nature. 1992;357(6374):153-155.
- [Google Scholar]
- The mitogenomic contributions to molecular phylogenetics and evolution of fishes: a 15-year retrospect. Ichthyol. Res.. 2015;62(1):29-71.
- [Google Scholar]
- Organization of the mitochondrial genome of a deep-sea fish, Gonostoma gracile (Teleostei: Stomiiformes): first example of transfer RNA gene rearrangements in bony fishes. Mar. Biotechnol.. 1999;1(5):416-426.
- [Google Scholar]
- Applications of mitochondrial DNA analysis in conservation: a critical review. Mol. Ecol.. 1994;3(4):401-411.
- [Google Scholar]
- Systematische beschreibung der plagiostomen. Verlag von Veit & Co. 934 Berlin; 1841.
- The filter pads and filtration mechanisms of the devil rays: variation at macro and microscopic scales. J. Morphol.. 2013;274(9):1026-1043.
- [Google Scholar]
- Complete mitochondrial DNA genome of bonnethead shark, Sphyrna tiburo, and phylogenetic relationships among main superorders of modern elasmobranchs, Meta. Gene.. 2016;7:48-55.
- [Google Scholar]
- The complete mitochondrial genome of the Spinetail Devilray, Mobula japanica. Mitochondri. DNA.. 2013;24(1):28-30.
- [Google Scholar]
- Raje, S.G., Sivakami, Mohan Raj, S. Manoj Kumar, G., Raju, P.P. A., Joshi. K.K., 2007. An Atlas on the Elasmobranch fishery resources of India.CMFRI. Sp. Publ., 95, 253.
- tRNA wobble modifications and protein homeostasis. Translation. 2016;4(1):e1143076.
- [CrossRef] [Google Scholar]
- Rozas, J., 2009. DNA sequence polymorphism analysis using DnaSP. In: Posada, D. (Ed.), Bioinformatics for DNA Sequence Analysis Methods in Molecular Biology Series vol. 537. Humana Press, NJ, USA, pp. 337–350.
- Transfer RNA gene arrangement and codon usage in vertebrate mitochondrial genomes: a new insight into gene order conservation. BMC. Genomics.. 2010;11(1)
- [CrossRef] [Google Scholar]
- Mitochondrial genomes of parasitic arthropods: implications for studies of population genetics and evolution. Parasitology.. 2006;134(2):153-167.
- [Google Scholar]
- Characterization of the Complete Mitochondrial Genome of Leucoma salicis (Lepidoptera: Lymantriidae) and Comparison with Other Lepidopteran Insects. Sci. Rep.. 2016;6(1)
- [CrossRef] [Google Scholar]
- MEGA6: molecular evolutionary genetics analysis version 6.0. Mol. Biol. Evol.. 2013;30(12):2725-2729.
- [Google Scholar]
- The complete mitochondrial genome sequence of Schizothorax lissolabiatus (Cypriniformes: Cyprinidae) Mitochondrial DNA Part. A. 2016;27(4):2450-2452.
- [Google Scholar]
- Mitochondrial control-region sequences in two shorebird species, the Turnstone and the Dunlin, and their utility in population genetic studies. Mol Biol Evol. 1994;11(1):22-31.
- [Google Scholar]
- White, W.T., Clark, T.B., Smith, W.D., Bizzarro, J.J., 2006. Mobula japanica. In IUCN Red List of Threatened Species. Version 2013.2, IUCN: Gland: Switzerland.
- Phylogeny of the Manta and Devil Rays (Chondricthyes: Mobulidae), with an update’s taxonomic arrangement for the family. Zool. J. Linn. Soc.. 2017;20:1-26.
- [Google Scholar]
- Phylogeny of the manta and devilrays (Chondrichthyes: mobulidae), with an updated taxonomic arrangement for the family. Zool. J. Linn. Soc.. 2018;182(1):50-75.
- [Google Scholar]


