

Translate this page into:
Comparison of the cytotoxic impact of samsum ant venom (Brachyponera sennaarensis) administration routes on quantitative histological analysis of thymus
⁎Corresponding author. jtamimi@ksu.edu.sa (Jameel Al-Tamimi), jhattamimi@gmail.com (Jameel Al-Tamimi),
-
Received: ,
Accepted: ,
This article was originally published by Elsevier and was migrated to Scientific Scholar after the change of Publisher.
Abstract
Samsum (Brachyponera sennaarensis) ant venom contains several peptides that have an aggressive impact on the architecture of the internal organs including the thymus. The objective of this study was to evaluate the effectiveness of venom with various doses as a toxin insult by examining the histological alterations and measurable biochemical parameters in the thymus. Forty Wistar albino rats separated into seven groups were used.
Data demonstrated statistically significant hyperplasia in the cellular density, shrinkage in cortical thickness, and medullary area in the venom- intraperitoneally treated group compared to the − orally treated group. Additionally, there was a prominent increase in apoptotic cells TGB, the density of lesions, and hemorrhagic cysts effects of the venom on thymic cells. There was a notable higher intensity of pathological features in the thymus.
Results validated the role of SAV in the general thymic atrophy in the histological structure of thymus tissues and acted as a carcinogenic agent. The structural analysis of the thymus revealed that a larger dosage of SAV produced a thymoma in the histoarchitecture. The differences between the low dose of SAV-treated groups orally and (IP) were not statistically significant in some analyses. In terms of the thymus tissue’s structure, the administration of a high dose of (450 µl) intraperitoneally had the worst impact on the health of the thymus.
Keywords
Samsum ant venom
Histomorphometry
Thymus
Routes of administrations
Morphometry measurements

1 Introduction
The thymus is a primary lymphoid organ through its thymopoiesis process and its ability to generate self-tolerance and recognize a wide variety of antigens to survive malignancy (Duah et al., 2021). Thymocytes have high sensitivity and fragility to virus infections, chemotherapy, and any toxic insult (Ramos et al., 2023). The thymic epithelium, macrophages, dendritic fibroblasts, and extracellular matrix with connective tissue constituted the thymic stroma (Shirafkan et al., 2024) which is responsible for the development, maturation, and migration of thymocytes and their functional roles (Reis et al., 2023). Dysfunctions of thymocytes lead to autoimmune diseases (Huang et al., 2022).
In their bites, ants inject secretions that contain a variety of bioactive components that cause inflammation, which is typified by vascular permeability (Agarwal et al., 2022). Brachyponera sennaarensis belongs to the family (Formicidae: Ponerinae) and spread to many regions of Saudi Arabia. Occasionally, it can result in severe allergic reactions, ranging from minor reactions to shock caused by anaphylaxis (Khurana et al., 2017). The venom has piqued the interest of scientists seeking to understand its mechanisms and prospective uses (Sharma and Upadhyay 2021). However, at specific concentrations, the toxin exhibits interesting pharmacological qualities despite its reported deleterious consequences (Santos et al., 2021).
Modifications to the architecture and histology of the thymus are considered especially significant for immunotoxicity screening (Lagou et al., 2024). The majority of toxic insults of ant venom cause severe depletion of thymocytes by apoptosis, release inflammatory mediators such as interferon-γ and tumor necrosis factor-α, and damage the thymic matrix (Xiong et al., 2021). Thymic atrophy is caused by toxins and pro-inflammatory mediators. These substances also have an impact on the thymic immune response (Elwakkad et al., 2024). It is important to note that long-term negative impacts on thymic structure and functions are caused by high doses of ant venom administrated directly into the bloodstream. Consequently, thymic atrophy, disruption of the thymic microenvironment, and chronic thymic insult were considered the normal output of injection of some biological insults directly (Março et al., 2023). Through the histomorphometric analysis, a quantitative assessment of the morphology and form of tissues provides an essential understanding of how biological toxins impact the histology of organs (Yacoub et al., 2020). The histomorphometric studies offered a thorough comprehension of atrophic processes and any adverse effects by studying cellular composition, tissue architecture, and morphological alterations (Börner et al., 2021).
Finally, there was a poorly investigation of the impact of SAV on the thymus from the histological point, therefore the current study explored the influence of direct intraperitoneal (IP) administration or oral administration of SAV and which one of them had a potential impact on the thymus gland by examining the histological changes and measurable parameters in the thymus.
2 Materials and methods
2.1 Collection of the samsum ant
Collected ant’s Samsum colonies from Hotat Bani Tamim Governorate, Riyadh, Kingdom of Saudi Arabia. The containers were used to collect the Samsum ant, which is 30 × 80 cm in size, and the upper interior edges were greased to prevent ants from exiting. A glass tube with a 10 % sugar solution is provided, and food is crushed wheat grains added daily {Al-Tamimi, 2016 #542} {Al-Tamimi, 2016 #542}.
2.2 Dissection of the venom gland
The insect's abdomen was grasped with forceps, grabbing the other machine stinging other forceps, and then quietly removing the separation of the venom gland. The venom glands were homogenized and then centrifuged at 2000 rpm for 1.5 min, and the supernatant was collected in an Eppendorf tube and stored at − 80 °C until use, according to (Al-Tamimi et al., 2016).
2.3 Experimental design
A total of forty male Wistar albino rats weighing between 190 and 210 g were acquired from the Zoology Department of King Saud University, located in Saudi Arabia. The animal husbandry room for experimentation is maintained at a temperature of 22 °C with a tolerance of ± 1°C, a humidity level of 5 %, and a light/dark cycle of 12 h. The research procedure received approval from the Research Ethics Committee of the Department of Zoology, College of Science, King Saud University.
Rats were allocated into five groups, each consisting of an equal number of animals (8 rats per group). Group I served as the negative control, while Group II served as the positive control. In group II, the rats were treated with a single dose of 50 µl/kg SAV in a 1:1 ratio with olive oil through oral injection, following the method previously described by (Ebaid et al., 2012). In group III, the rats were injected with 100 μl of SAV orally for three weeks. Group IV consisted of rats injected with 300 μl of SAV for three weeks orally, following the protocols established by (Ebaid et al., 2014). Secondly, in group V, the rats were injected with 450 μl of SAV for three weeks through intraperitoneal injection. The group VI, the rats were injected with 100 μl of SAV for three weeks intraperitoneally. Finally, the group VII, the rats were injected with 50 μl of SAV for three weeks through intraperitoneal injection following the protocols established by Al-Tamimi et al., (2021).
2.4 Thymus histological study
Thymus samples from each animal were analyzed. The tissue sections were preserved in 10 % neutral buffered formalin and then encased in paraffin. The paraffin sections, measuring 6 μm, were then stained with hematoxylin-eosin (H&E) and processed using the method described by (Bancroft and Layton 2012).
2.5 Statistical analysis
The data was subjected to statistical analysis using SPSS 25 (SPSS Corp., Armonk, NY, USA). A one-way analysis of variance (ANOVA) was used to compare the five subfields, followed by a Bonferroni post hoc test to account for multiple comparisons. The findings were reported as the average value plus or minus the standard deviation (mean ± STD). A probability value (p) below 0.05 was deemed statistically significant.
3 Results
Initially, the control thymus appeared as lymphoid tissue with capsular lobules separated from each other by trabecular, shown in (Fig. 1: a-f).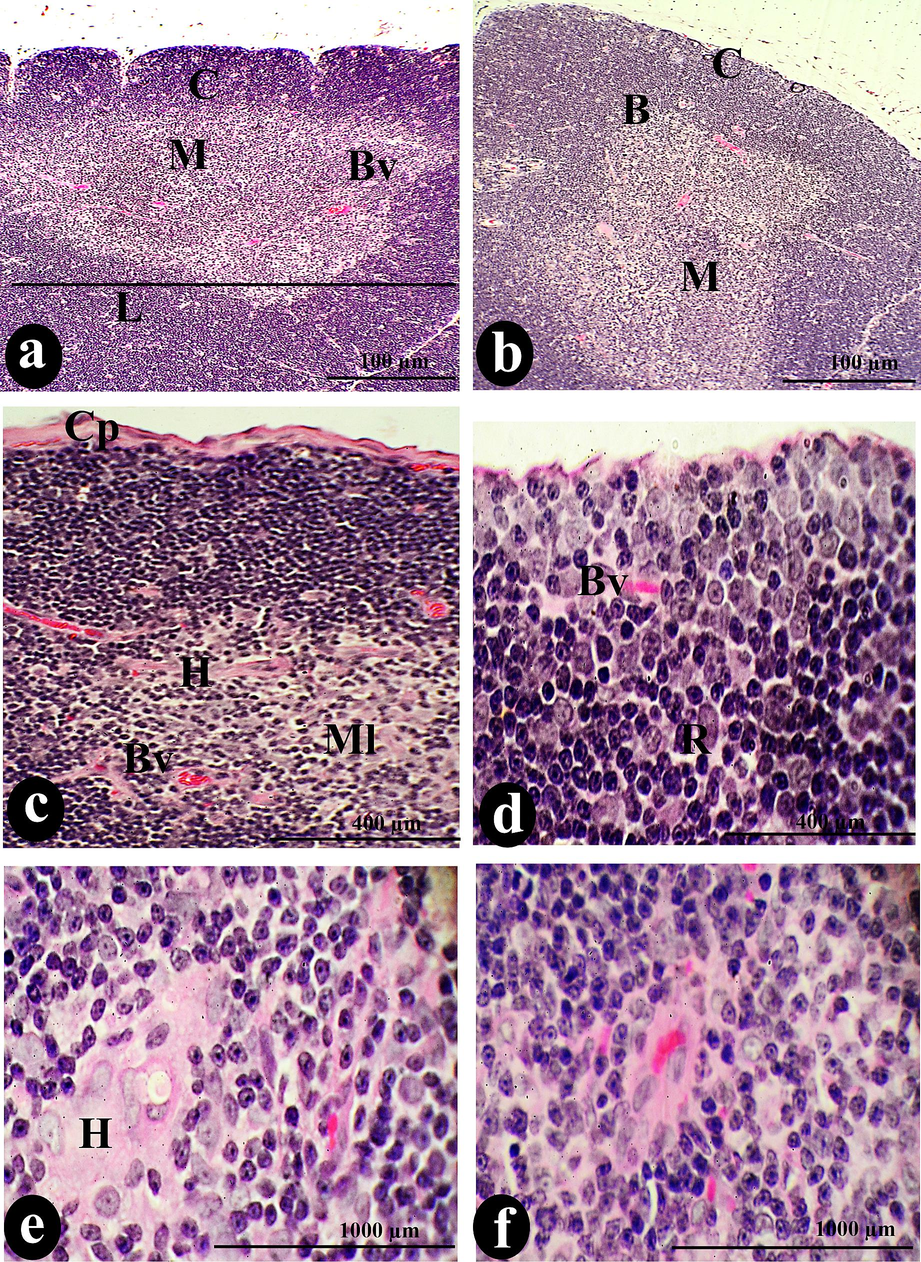
The normal architecture of thymus lobules (L), separated from each other by trabecula (T), is visible in a photomicrograph of a cross-section of the control thymus. The normal constituents of the thymus were the cortex (C) and medulla (M), separated by an identical border (B) and dispersed blood vessels (Bv). Cortical lymphocytes (Cl), reticular cells (R), and tangible apoptotic bodies (TGB) compose the cortical stroma, while the upper capsule (Cp) covers the entire stroma. Conversely, the medullary tissue comprises medullary lymphocytes (Ml), Hessel's corpuscles (H), dendritic (D), endothelial (ED) cells, medullary sinuses (Mds), and medullary cords (Md cor). Scale bars: a, b = 100 µm; c, d = 400 µm; e, f = 1000 µm.
3.1 The effect of orally administrated 50 µl/kg on the histopathological alterations of thymus
Experimentally, it was observed the thymus treated orally with 50 µl/ kg showed atrophy and shrinking in comparison to normal thymus. Oral 50 µl/ kg exhibited relative intensity of fibrosis that appeared in the capsular regions and thymic stroma invaded the trabecular septa forming interlobular fibrosis (Fig. 2: e, k & m).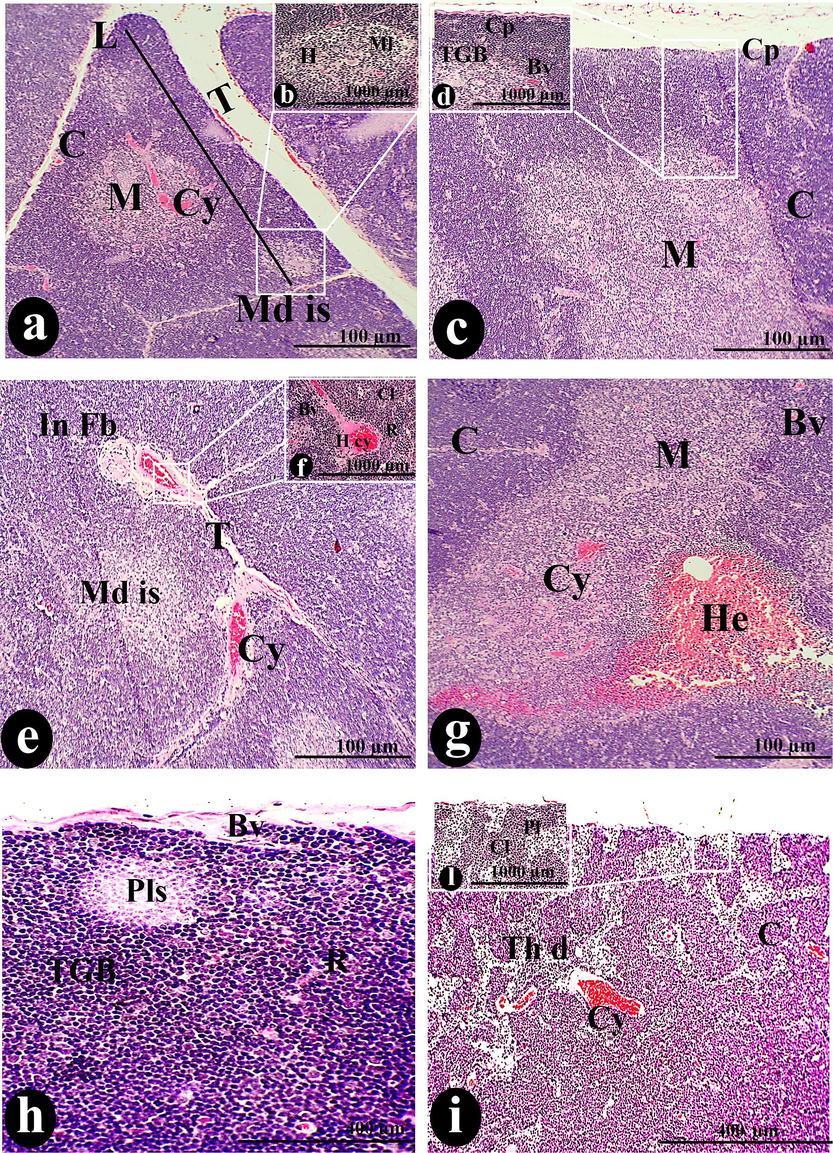
A photomicrograph of a cross-section of the thymus was administered orally with 50 µg/body weight of SAV, showing the L covered by Cp and possessing the C and M. The trabecula (T) separated the lobules from each other. The Cl, R, BV, mc, and TGB compose the cortical stroma. The whole thymus displayed abnormal features, including Md with its normal appearance of H, Cy, H cy, In Fb, F cp, and hemorrhage (He). The cortical region was diffused with thymic dilation (Th d), tumor nests (Tn) containing plasma cells (Pl), and pale lesions (Pls). The accompanying lymphocyte depletion (Ly de) also led to the diffusion of dendritic cells. It was noted that the Md s with His and cords Md cor spread in between Ml. Scale bars: a, c, e, g, h, j, and k = 100 µm; i, l, and m = 400 µm; b, d, f, n, and o = 1000 µm.
There were aberrant features observed in the cortical regions such as thymic dilations that include tumor nests in between (Fig. 2: i). Also, it was noted dispersion of hemorrhage and pale lesions among depleted lymphocytes (Fig. 2: g, h & j). Various cystic lesions were distributed over the whole tissue in the form of simple cysts and hemorrhagic cysts. It was thought that represented dilatation of the thymic tubular structures or remnants of the thyme-pharyngeal duct that in turn indicates thymic atrophy. Also, abnormal hyperplasia of plasma cells and lymphocytes leads to the formation of these cysts (Fig. 2j, a, e & i). Besides, replications of hyperplastic plasma cells and medullary lymphocytes in medullary tissues led to the construction of medullary cords (Fig. 2: l& o) & (Fig. 9: c& d).
Medullary islands represented the first sign of the dispersion of thymoma in the tissue (Fig. 2: a &e) are detected. The tangible apoptotic body density registered an elevation rate (82.82 ± 2.32 TGB/mm2) more than the control ones in (Fig. 2: d & h). There was a significant increase in reticular cell density (2.40 ± 0.22 cell/mm), macrophage (9.75 ± 0.55 cell/mm), and dendritic cells (6.29 ± 0.43 cell/mm) more than normal levels.
Additionally, there were more histiocytes in the treated thymus. Its primary locations were in the paracortical, medullary, or subcapsular sinuses. Intracytoplasmic insoluble particle debris, such as phagocytized test objects, vehicle materials, or colors, may be present in the histiocytes (Fig. 2 n). In addition to the elevation of vascularity density more than in the control group, there was a dispersion of small blood capillaries close to tangible bodies of apoptotic shown in (Fig. 2: d & f) and (Fig. 9 a).
3.2 The effect of orally administrated 100 µl/kg on the histopathological alterations of thymus
Oral 100 µl/ kg body weight of SAV contributed to the conversion of the normal thymic structure into thymoma. Firstly, the spreading of medullary islands is a marker of carcinomic thymus. The medullary island appeared as a faintly stained area surrounded by deep blue-stained cortical lymphocytes as shown in (Fig. 3: c, f & i). On the other hand, the present study clarified the malignancy of this dose due to the significant decline in thymus length and width. It was found that involution was accompanied by simple cystic formation with homogeneous eosinophilic proteinous fluid (Fig. 3: a, f, I & l). Due to the dispersion of necrosis of lymphocytes and fibrotic interlobular space, the activity of the apoptotic process increases with higher registrations of tangible apoptotic bodies and macrophage densities (Fig. 3: k & o).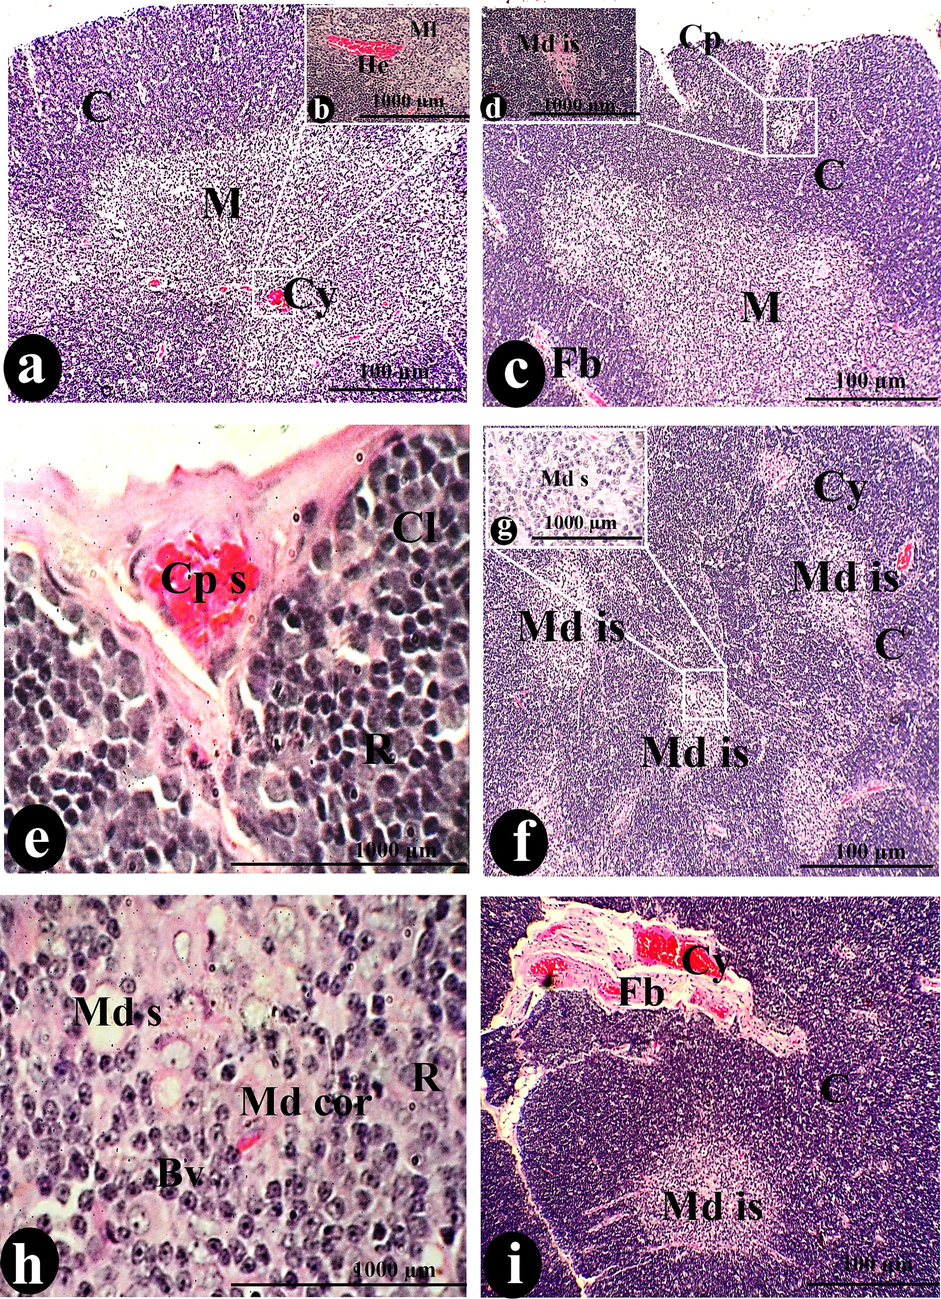
A photomicrograph of a cross-section of the thymus was administered orally with 100 µg/body weight of SAV, showing the Cp covered the C that surrounded the M. The Md is primarily represented by a structure diffused over the entire thymus that is accompanied by hemorrhage (He) and cysts (Cy). Cortical lymphocytes (Cl) and R surrounded the Ts, where SCP with Fb connected. Bv disperses the Md and Md s, while Ml and plasma cells (Pl) exhibit hyperplasia. The marker of this thymus was the dispersion of fibrosis tissue over the whole tissue surrounding the hemorrhagic cyst (H cy). We observed necrosis (Nc), macrophages (mc), DC, and EC. Scale bars: a, c, f, and i = 100 µm; b, d, e, g, h, j, k, m, n, and o = 1000 µm.
The intermediate dose of SAV resulted in the activation of the inflammatory response that in turn increased the rate of cortical reticular densities (10.69 ± 0.94 cell/mm) while the dendritic density conserved with relative elevation like to the previous dose (Fig. 3: e & o). Consequently, hemorrhage and high vascularity are illustrated (Fig. 3: b & o). Plasma cells and medullary lymphocyte hyperplasia resulted in the development of medullary cords (Fig. 3: j, k, n & o).
3.3 The effect of orally administrated 300 µl/kg on the histopathological alterations of thymus
Applying the higher dose orally of SAV on the thymus gland acted on replacing the normal histological picture of the gland and deformations of thymic histoarchitecture. The blurring of normal cortical and medullary demarcation was considered the first signs of these deformations as explained in (Fig. 4: a, j& n).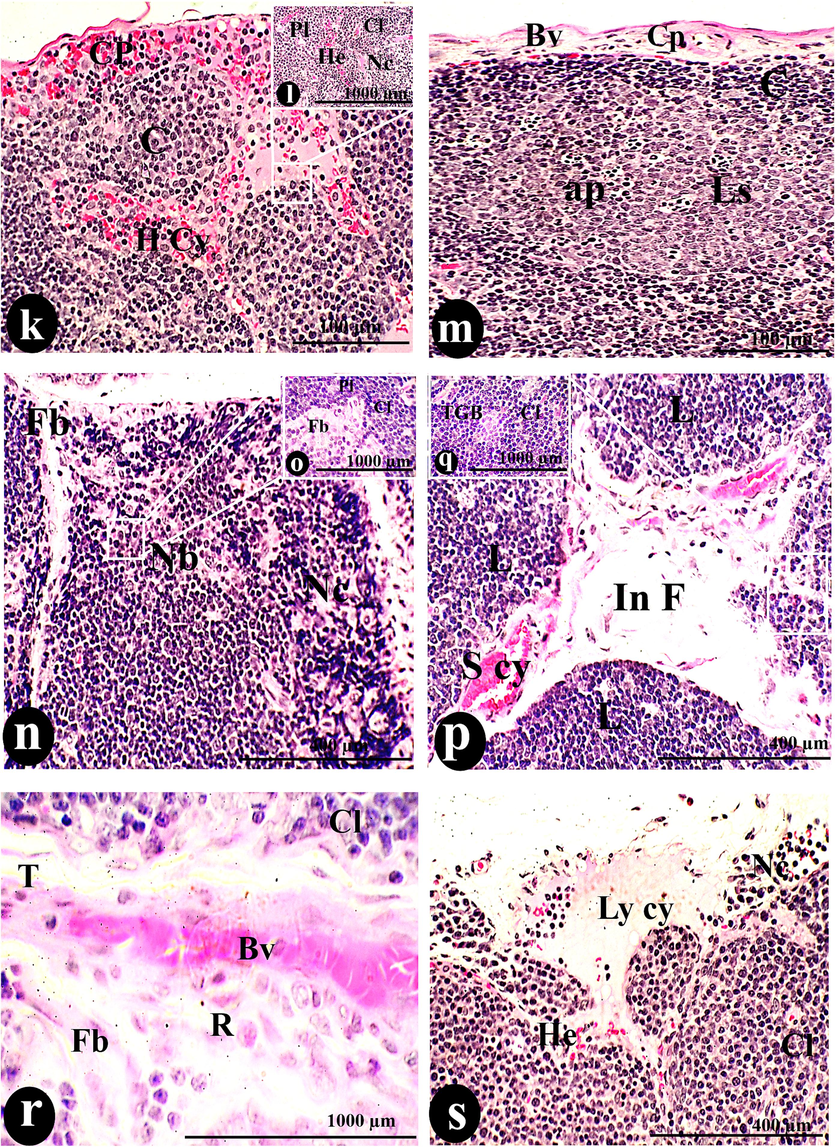
A photomicrograph of a cross-section of the thymus was administered orally with 300 µg/body weight of SAV, showing the thymus had no border (Nb) between the C and M regions. Hemorrhage (He), lymphocyte depletion (de), and epithelial inclusion (E inc) infiltrated the Cp. The thymic cortex was deformed by Th d, Cy, simple cyst (S cy), hyperplasia of plasma cells (Pl), tangible bodies (TGB), Fb, and H cy, side by side of Cl. The Md, consisting of H, Ml, R, and DC, occupied the medullary tissue. The tissue was dotted with small Bv and lesions (Ls) containing apoptotic cells (ap). Necrosis (Nc) and fibrosis throughout the entire tissue, represented by the interlobular fibrotic tissue (in Fb) that occupied the space of the T, were the characteristic signs of this dosage. Cortical hemorrhage (He) coincided with the lymphatic cyst. Scale bars; a, c, e& g = 100 µm; b, d, f, h, I, k, m, n, p & s = 400 µm; j, l, o, q &r = 1000 µm.
An elevation of the cystic densities was recorded in this dose (5.14 ± 0.55 cyst/mm) more than the previous doses. They dispersed in the form of simple cysts, hemorrhagic cysts, lymphatic cysts, and lesions with apoptotic particles as demonstrated in (Fig. 4: h, g, j, k, m,p & s). Also, epithelial inclusion was demonstrated as a primary stage of the epithelial cyst (Fig. 4: i). Conversely, the cystic diameter was inversely proportional to increasing the toxicity of the dose and registered (0.07 ± 0.00 mm2). Among the whole cysts, the necrosis of the lymphocytes widely speeded was described in (Fig. 4: l & n). The vigorous inflammatory process and intensive shrinkage of thymus length (6.35 ± 0.28 mm) and width (4.14 ± 0.25 mm) resulted in the highest intensity of tangible apoptotic bodies (136.54 ± 14.58 TGB/mm) among the injected doses, macrophage (21.52 ± 2.62 cell/mm), dendritic cells (11.75 ± 0.99 cell/mm), and reticular cells (11.45 ± 0.66 cell/mm) in comparable of all doses. Also, due to the inflammation process, plasma cells and lymphocyte hyperplasia were observed and considered the spark of medullary cord construction with a smaller diameter (0.05 ± 0.00 mm) than the rest doses.
3.4 The effect of intraperitoneally administrated 450 µl/kg of SAV on the histopathological alterations of thymus
The 450 µl/ kg of SAV exhibited various carcinoid symptoms such as dispersion of thymomas that constituted the medullary island as a main feature and complete absence of the borders between cortical and medullary lymphocytes (Fig. 5: a & b). Moreover, several necrotic regions were observed in the accompanying hemorrhagic and lymphatic cysts that were surrounded by depleted lymphocytes (Fig. 5: h, i, k& l). Also, the spreading of histocytes and the congestion of blood vessels in the cortical and medullary areas were noted (Fig. 5: f, g& h). The intensity and the size of Hessel corpuscles were affected (Fig. 5: e& f). Whereas the density of these corpuscles registered a significant decrease (p < 0.05) than all doses of SAV either orally or intraperitoneally. On the contrary, their size elevated significantly (p < 0.05) more than others (Fig. 10 a & b).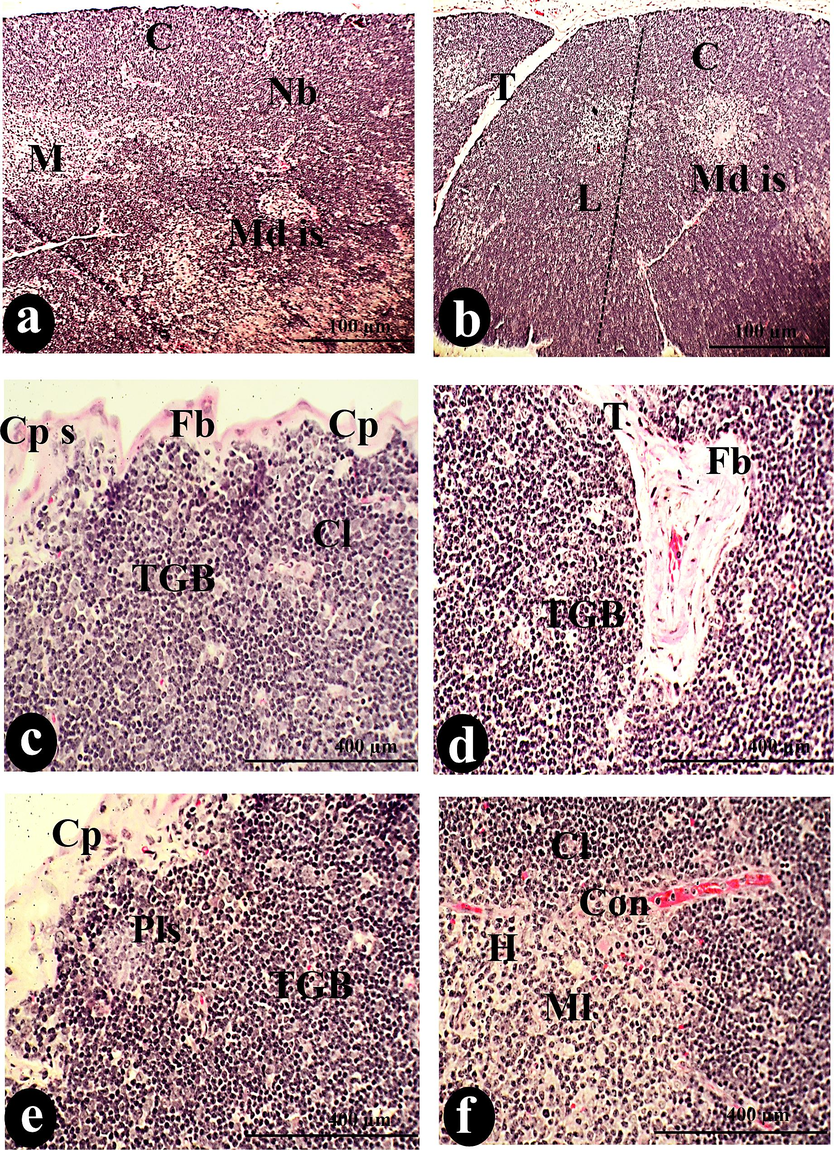
A photomicrograph of a cross-section of the thymus was administered intraperitoneally with (450 µg/body weight) of SAV, showing the thymic lobule (L) lack of the border (Nb) between the C and M. The fibrosis (Fb) invaded the Cp, Cps, and T. The MD was spreading over all the tissue, accompanied by congestion of the blood vessels (Con). There were tangible apoptotic bodies (TGB), Cy)of two types H cy and Ly cy, and pale lesions (Pls), which represented abnormal features distributed among Cl and Ml. Reticular cells (R) and MC constitute the cortical stroma. Histocyte dispersion (His) and Nc were the distinguishing signs of this thymus. Bv and Md cor occupied the medullary island. Scale bars: a, b, g = 100 µm; c, d, e, f, i, j &l = 400 µm; h &k = 1000 µm.
Morphometrically, the thymus suffered from significant shrinkage. As well as the disturbance in the thickness of the cortex and medulla led to a decrease in the cortical-medullary ratio during the injection of this dose (p<0.05) less than the normal ratio (Fig. 9b). Microscopically, the thymoma cellular structure was composed of uniformly medium-sized cells with a round nucleus in the acidophilic medium represented by cortical and medullary lymphocytes. On the other hand, the intensity of macrophages, dendritic cells, reticular cells, and tangible apoptotic bodies elevated more in comparison to control (Fig. 10: c, d, e & f).
3.5 The effect of intraperitoneally administrated 100 µl/kg of SAV on the histopathological alterations of thymus
Many atrophic signs were exhibited in the thymus of this group, fibrotic capsule, and trabeculae, loss of cortico-medullary demarcation (Fig. 6: a, b, c, f& l), and scattering the pale lesions and cysts which lead to thymoma (Fig. 6: a, f& c). Necrosis was expressed by shrinkage of the cell wall and fragmentation of the nucleus which resulted in the depletion of lymphocytes. This was accompanied by tangible apoptotic bodies (Fig. 6: a, e, f, h, I & l).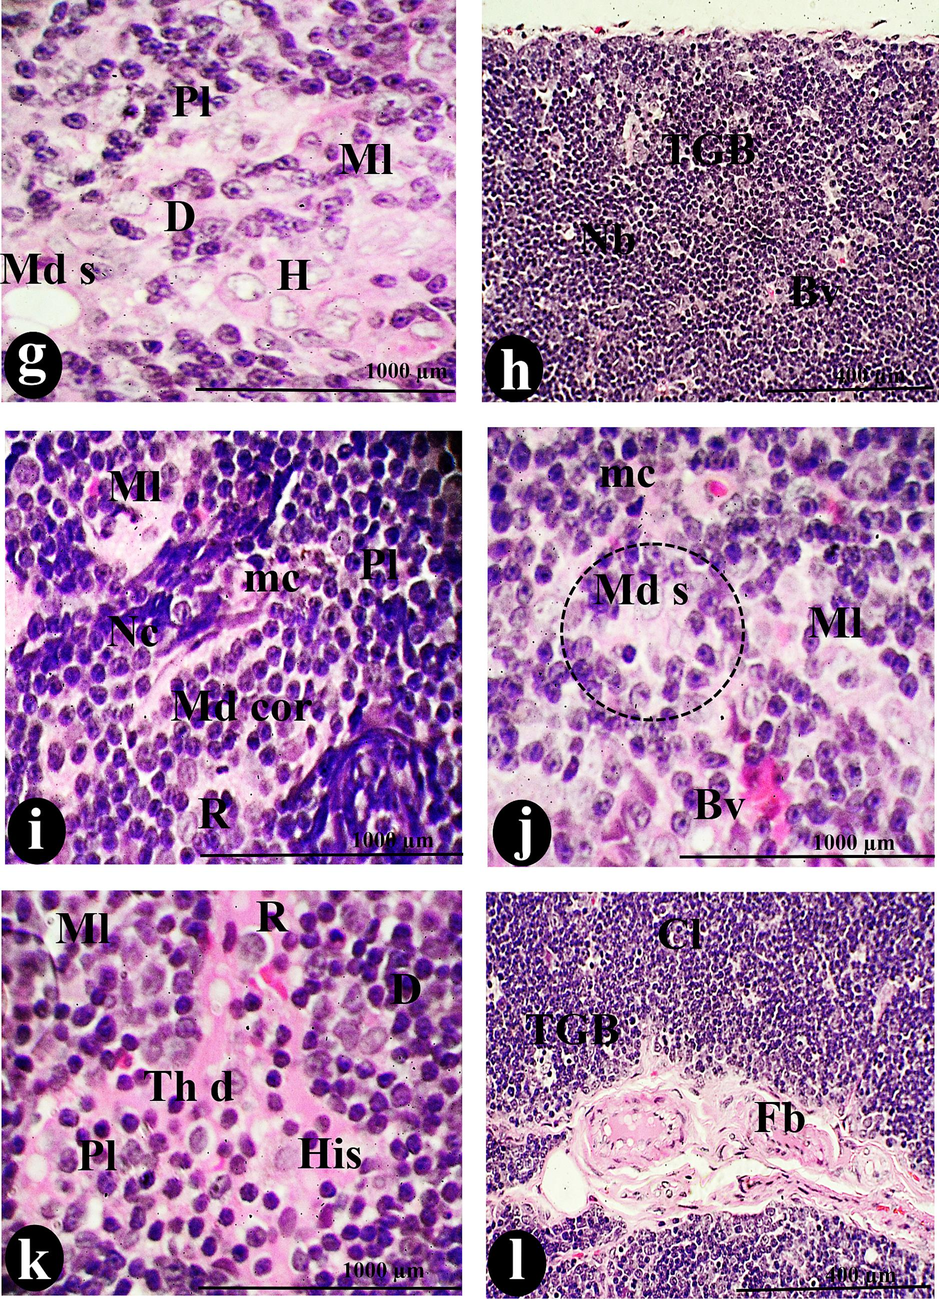
A photomicrograph of a cross-section of the thymus was administered intraperitoneally with 100 µg/body weight of SAV, showing the L with Fb in the Cp, T, and penetrating the Cl. Tangible bodies (TGB), Pls, and Cy constituted an aberrant picture of thymic structure. Macrophages (mc), R, dendritic cells (D), and Bv invade the cortical stroma. Depleted lymphocytes (de) fill the cortical sinus (S). Thymic hyperplasia (Pl), Th d, His, and Nc are all signs of the tumor that has spread all over the thymus The Ml disperses the Md cor, and Md s. Scale bars: a, b, g = 100 µm; c, d, e, f, i, j &l = 400 µm; h & k = 1000 µm.
The morphometric analysis showed a little shrinkage, with the ratio of cortex and medulla declining (0.19 ± 0.01 mm). Deficiency resulted from the reduction of the internal structure such as medullary cords (0.06 ± 0.00 mm) and medullary sinus (0.06 ± 0.00 mm) less than control diameters (Fig. 9 c& d). At the same time, cellular constituents exhibited an increase in the density of TGB, macrophage, dendritic cell, and reticular more than control conditions. The number of blood vessels proliferated during this injection more than in control conditions (Fig. 9a).
3.6 The effect of intraperitoneally administrated 50 µl/kg of SAV on the histopathological alterations of thymus
Accumulation of medullary islands and different types of cysts (Fig. 7: a, d, e, f, g, h & j) in this group. Many lesions and cysts have been exhibited in the current thymus including hemorrhagic cysts, fibrotic cysts, and simple cysts, that were expressed at a lower intensity. Correspondingly, the cortico-medullary junction wasn’t apparent (Fig. 7a). SAV 50 µl caused little elevation in the cellular density of each tangible apoptotic body, macrophages, dendritic cells, reticular cells), and also blood vessel density. Similarly, medullary cellularity revealed some microscopic alterations such as a lower density of Hessel’s corpuscles (8.10 ± 0.39H/mm2) than typical ones, however, displayed a larger size (0.08 ± 0.00 mm2) than the original particles. Otherwise, the morphometric analysis brought out a slight decline in the size of the thymus and its lobules during the administration of this lower dose of SAV. Even though the ratio of cortex and medulla displayed a higher value due to the increase in the thickness of the cortex and diameter of the medulla (Fig. 8: e& f). Spreading the hyperplasia of plasma cells over the whole tissues was observed (Fig. 9: c& d). Accordingly, the appearance of necrotic areas and multiple histocytes with congenital blood vessels was considered significant markers for cellular inflammation and lymphocytic infiltration (Fig. 7: j, k & l).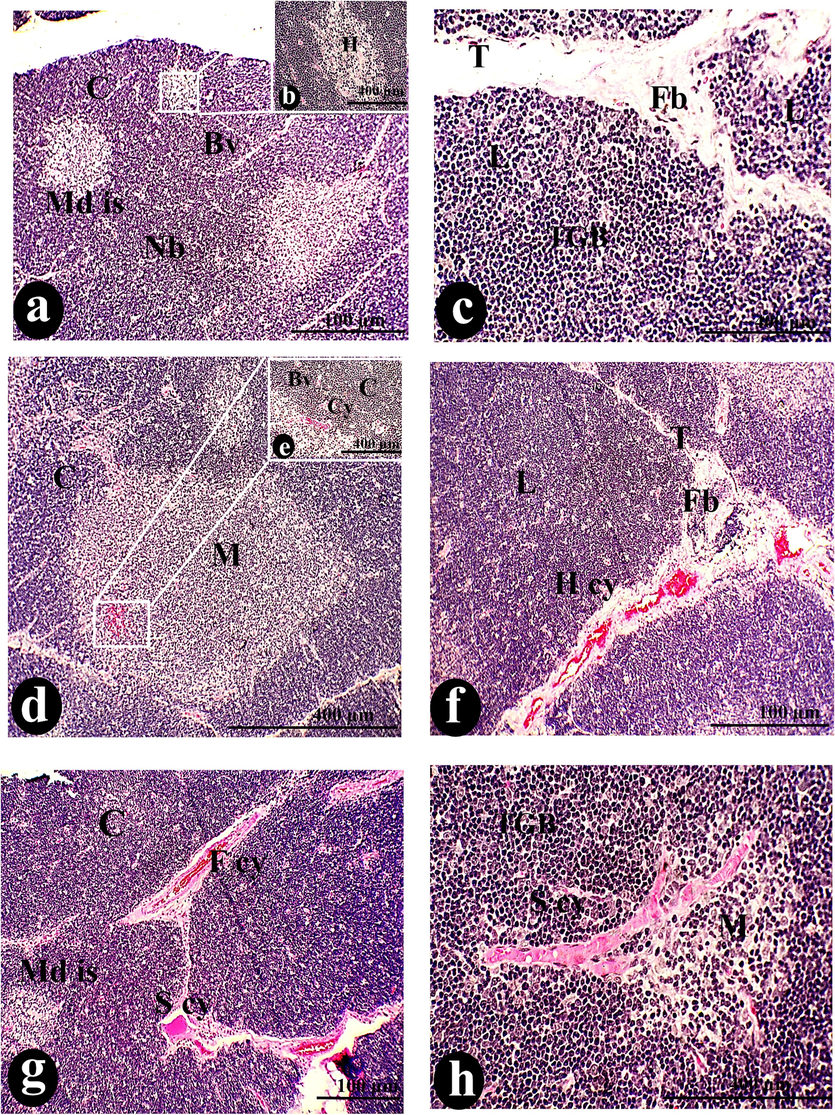
A photomicrograph of a cross-section of the thymus was taken after 50 µg/body weight of SAV was injected intraperitoneally. It showed that there was no border junction (Nb) between the C and its Cl and the M and its Ml. The Md appeared with the normal appearance of Hessel's corpuscles (H), accompanied by Bv. Fibrosis (Fb) covered the T that separated the thymic L. Thymoma markers included H cy, TGB, and a variety of Cy, including F cy, S cy, congested blood vessels (con), Nc, and hyperplasia of plasma cells (Pl). Reticulated cells (R), MC, Dc, ED, and His condense on the medullary island, in addition to Md s and cords Md cor. Scale bars: a, f, g, i, and j = 100 µm; b, c, d, e, and h = 400 µm; k, l, m, and n = 1000 µm.
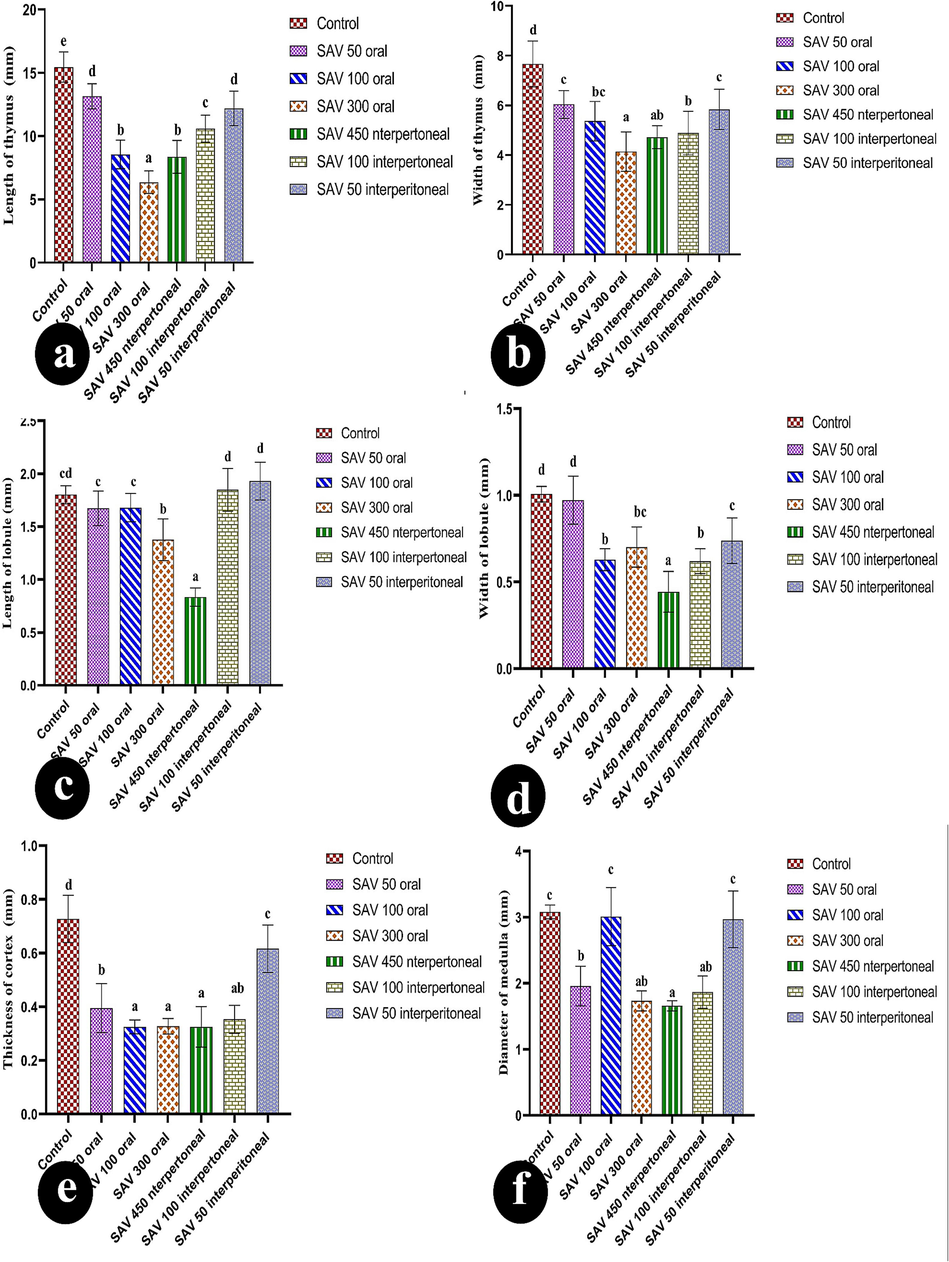
The bars show how the length and width of the thymus, the length and width of the lobule, the thickness of the cortex, and the diameter of the medullary changed in six groups: control; an oral dose of 50 µg/BW; an oral dose of 100 µg/body weight (BW); an oral dose of 300 µg/BW; an intraperitoneal (IP) dose of 50 µg/BW; an intraperitoneal dose of 100 µg/BW; and an IP dose of 450 µg/BW. Values are represented as mean ± SEM and n = 10 animals. Means within the same parameter and not sharing a common superscript symbol(s) differ significantly at p < 0.05, and values that are recorded with a non-significance difference (n. s.).
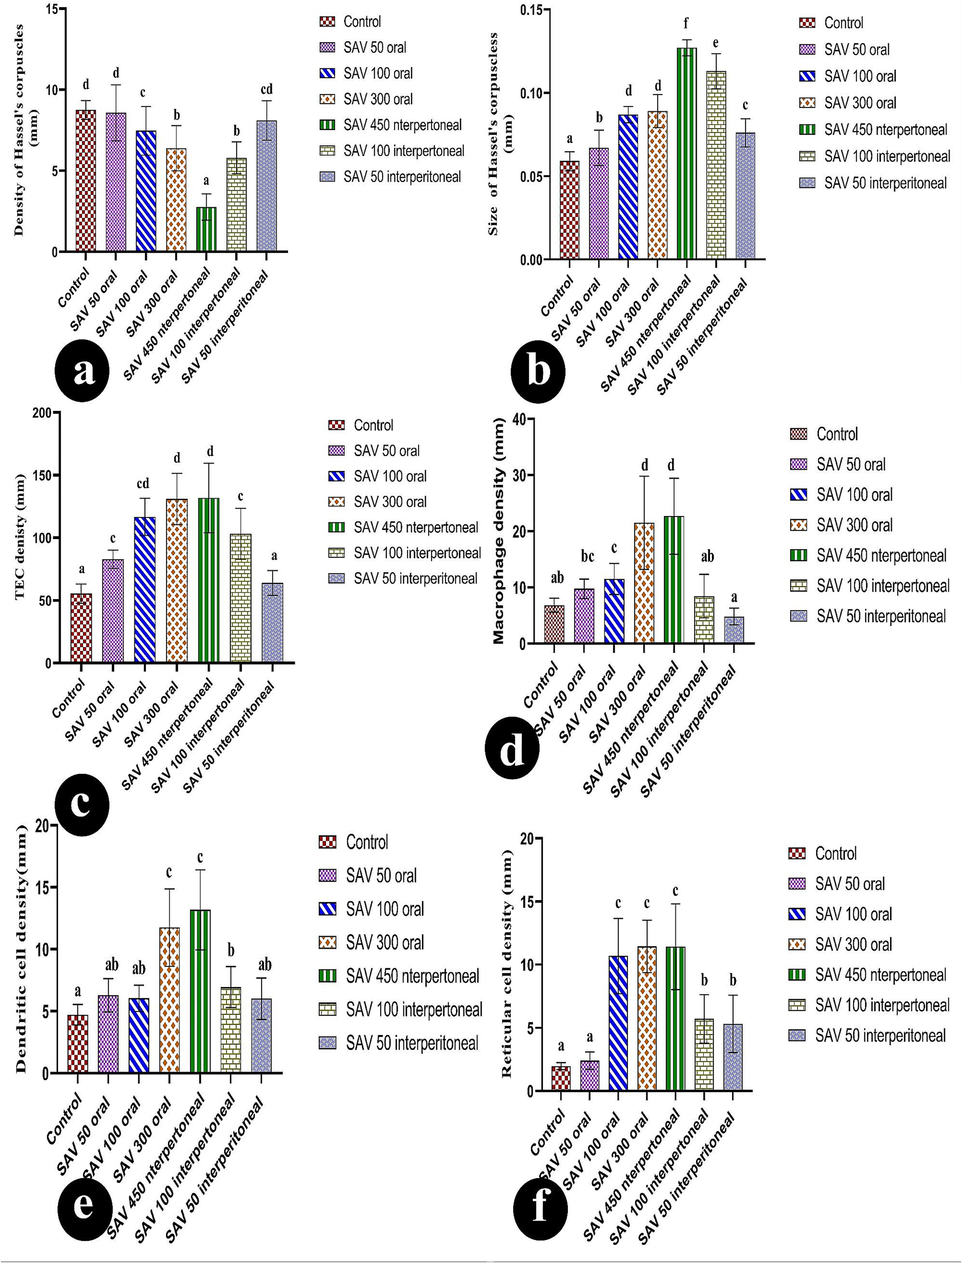
They used bar charts to show changes in six groups: the control group; an oral dose of (50 µg/BW); an oral dose of (100 µg/BW); an oral dose of (300 µg/BW); an IP dose of (50 µg/BW); an IP dose of (100 µg/BW); and an IP dose of (450 µg/BW). The changes in these factors were TEC density, TEC density, macrophage density, reticular cell density, and dendritic cell density. Values are represented as mean ± SEM and n = 10 animals.
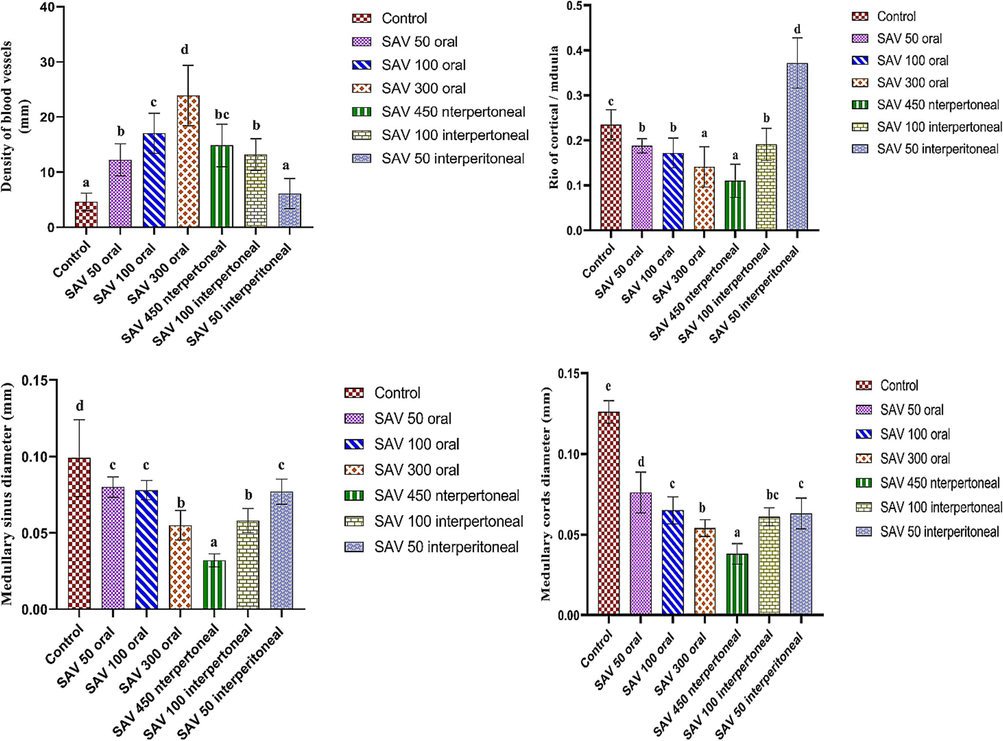
A: The number of blood vessels, B: the ratio of the cortex to the medulla, C: the size of the lesion, D: the size of the thymic cyst, E: the size of the medullary sinus, and F.the size of the medullary cord. The six groups controlled, an oral dose of 50 µg/BW, an oral dose of 100 µg/BW, an oral dose of 300 µg/BW, an IP dose of 50 µg/BW, an IP dose of 100 µg/BW, and an IP dose of 450 µg/BW.
4 Discussion
Ants inject secretions with various bioactive components in their bites, which cause inflammation by increasing the permeability of blood vessels and the migration of neutrophils (Ebaid et al., 2019). The majority of ants bite sharing strong toxic venoms. Whereas, they were formed of a complicated cocktail of toxins (Robinson et al., 2023). Referring to the immunological studies (Schendel et al., 2019) illustrated the cytolytic activity of the ant venom peptides in the deformation of the cellular constitution besides rapid immobilization. The current investigation was designated to explore the impact of SAV administration as a powerful ant venom on the histomorphometric features of thymus through two different routes of administration.
Eventually, the control thymus has a powerful immune activity in the body and enjoys instant histological features among various species. A study by (Ibrahim and Waheed 2022) described a similar structure in the female albino rat. Each lobule consisted of two different sections separated by an obvious junction. The top portion was represented by a heavily stained cortical region, whereas the other area was a light medullary stroma. Comparatively, this lobulation was reported by (Krishna 2020) in the adult thymus. Histologically, many investigators considered the thymus as an epithelial organ. It was characterized by a vast framework of principle lymphocytes, less B. lymphocytes, plasma cells, neuroendocrine cells, and macrophage cells, as well as the average intensity of reticular cells. The relative cellular composition was stated by (Börner et al., 2021) in the pig thymus.
Through the histological analysis of the other six groups that were provided by SAV, they had comparable atrophic indicators such as necrosis characteristics that developed in the thymic dilatation regions, along medullary cords and sinuses, and also around the invasion of fibrotic fibers. On the contrary, the current analysis of the study revealed some significant variations between orally injected rats and intraperitoneal ones. Whereas, oral doses exhibited a moderate harmful impact on the cellular construction of the thymus less than in the intraperitoneal doses. Equally, observations were recorded in albino rat liver that was exposed to oral administration of Naja naja venom (Hosseini et al., 2017). They referred to the moderating impact of venom toxicity due to the alteration of protein metabolism during the digestion and absorption process. In addition (Aly et al., 2024) added that the digestive enzymes and gastric enzymes were sheared in the degradation of the proteinous component of the venom before reaching the bloodstream.
Also, gradual degeneration was registered obviously in between the oral doses which the low dosage of SAV showed significantly decreased alteration in the thickness and width of the thymus gland and its lobule less than the normal ones, besides higher density of blood vessels, intensity fibrosis, necrosis, cyst formation and density of immune cells infiltration. Similarly, the higher oral potion caused more severe cellular damage than the lower previous dose. A study by (Al-Sadoon et al., 2012) demonstrated the deleterious influence of venom on the internal organs and organelles of albino rats to the alteration of enzymatic activity of the body through libration of particular enzymes acted on the organelle's destruction by inhibiting or acting the enzymatic activity. Frequently, the analogous demonstration was reported in scorpion venom in the liver of rabbits (Resiere et al., 2022). Furthermore, (Ajisebiola et al., 2021) pointed to the toxic impact of venom as considered the primary reason for raising the vascular permeability which in turn led to hypoproteinemia.
The current investigation revealed strong destruction to the thymic construction through intraperitoneal injection more than oral administration. The present data exhibited a significant rise in the level of vascular permeability, infiltration of immune cells, and intensity of cyst formation in the thymus of intraperitoneally injected rats more than those injected orally. A study by (Ağan and Hayretdağ 2017) explained the severe damage of intraperitoneal injection to the direct effect on the systematic inflammatory response of the body and cause direct damage to internal body organs. Cellular necrosis, swelling, and pyknosis, besides hemorrhage and bleeding in sinusoids had been registered in the hepatocytes after administration with the venom of Cerastes cerastes (Helden et al., 2019).
5 Conclusion
To summarize the current findings, the SAV played an aggressive role against the primary lymphoid organs like the thymus. The administration of SAV directly through the intraperitoneal route deformed the normal histological picture of the thymus more than the oral route. As data analysis illustrated there was a decrease in the outline of the gland and its lobules. Additionally, the cellular infiltration of immune cells and apoptotic bodies elevated suddenly, more than the orally injected thymus. On the other hand, all doses of SAV with both routes exhibited severe atrophic signs such as cysts, lesions, necrosis, and fibrosis. Several studies illustrated the beneficial uses of SAV through its microbial activity and protective capacity against harmful substances.
Financial disclosure
This work was supported by Researchers Supporting Project number (RSP2024R366), King Saud University, Riyadh, Saudi Arabia.
CRediT authorship contribution statement
Jameel Al-Tamimi: Methodology, Funding acquisition, Formal analysis, Data curation. Hossam Ebaid: Writing – original draft, Data curation, Conceptualization. Iftekhar Hassan: Formal analysis, Data curation. Ibrahim M. Alhazza: Writing – review & editing, Project administration.
Acknowledgments
This work was supported by Researchers Supporting Project number (RSP2024R366), King Saud University, Riyadh, Saudi Arabia.
Authors' contributions
HE, JT, and IMH collaborated on the design of this research and were responsible for drafting the introduction and discussion sections, as well as preparing the paper for submission. In this study, IMH, JT, and IH conducted the histology research, prepared the findings and methods, conducted the animal model, and completed the statistical analysis. JT contributed to the development of the study's design. The final text was reviewed and approved by all writers.
Declaration of competing interest
The authors declare that they have no known competing financial interests or personal relationships that could have appeared to influence the work reported in this paper.
References
- Pharmacological potential of ants and their symbionts–a review. Entomol. Exp. Appl.. 2022;170(12):1032-1048.
- [Google Scholar]
- Neutralization of Bitis arietans venom-induced pathophysiological disorder, biological activities and genetic alterations by Moringa oleifera leaves. Toxin Rev.. 2021;40(4):847-858.
- [Google Scholar]
- The effects of LD50 of Walterinnesia aegyptia crude venom on blood parameters of male rats. Afr. J. Microbiol. Res.. 2012;6(3):653-659.
- [Google Scholar]
- Potential effects of samsum ant, Brachyponera sennaarensis, venom on TNF-α/NF-κB mediated inflammation in CCL4-toxicity in vivo. Lipids Health Dis.. 2016;15:1-11.
- [Google Scholar]
- Samsum ant venom protects against carbon tetrachloride–induced acute spleen toxicity in vivo. Environ. Sci. Pollut. Res.. 2021;28:31138-31150.
- [Google Scholar]
- Aly, S. H., M. El-Shazly, Eldahshan, O.A., 2024. Antidotes to reptile toxins chemical composition of snake venoms; toxic effects of snake venom. Antidotes to Toxins and Drugs, Elsevier: 71-97.
- The hematoxylins and eosin. Bancroft’s Theory and Practice of Histological Techniques.. 2012;7:173-186.
- [Google Scholar]
- Anatomical structures, cell types and biomarkers of the human reference atlas. Nat. Cell Biol.. 2021;23(11):1117-1128.
- [Google Scholar]
- Bioactivity of Samsum ant (Pachycondyla sennaarensis) venom against lipopolysaccharides through antioxidant and upregulation of Akt1 signaling in rats. Lipids Health Dis.. 2012;11:1-10.
- [Google Scholar]
- Samsum ant venom modulates the immune response and redox status at the acute toxic dose in vivo. J. Venomous Anim. Toxins Incl. Trop. Dis.. 2019;25:e20190020.
- [Google Scholar]
- Ebaid, H., Al-Tamimi, J., Hassan, I., et al., 2014. Antioxidant bioactivity of Samsum ant (Pachycondyla sennaarensis) venom protects against CCL 4-induced nephrotoxicity in mice. Oxidative Med. Cell. Longevity. 2014.
- Apoptosis as a therapeutic strategy for breast cancer: the role of Thymax, a gross thymic extract, in modulating cell death pathways. Egypt. Pharmaceut. J.. 2024;23(2):184-198.
- [Google Scholar]
- Helden, D.F.v., Dosen, P.J., O’Leary, M.A., et al., 2019. Two pathways for venom toxin entry consequent to injection of an Australian elapid snake venom. Scientific Reports. 9 (1) 8595.
- Oral absorption of Mesobuthus eupeus scorpion venom in mice. Iran. J. Toxicol.. 2017;11(2):15-19.
- [Google Scholar]
- Lymphocyte subpopulations associated with neutralizing antibody levels of SARS-CoV-2 for COVID-19 vaccination. Vaccines.. 2022;10(9):1550.
- [Google Scholar]
- Histopathological effects of phytoestrogrn (Genistein) on thymus gland of adult and post-natal female albino mice. Sci. J. University of Zakho.. 2022;10(2):29-34.
- [Google Scholar]
- Allergenic extracts to diagnose and treat sensitivity to insect venoms and inhaled allergens. Ann. Allergy Asthma Immunol.. 2017;118(5):531-536.
- [Google Scholar]
- A study of gross and histological structure of thymus gland in fetuses and adolescent. Ind. J. Clin. Anatomy Physiol.. 2020;7(2):230-237.
- [Google Scholar]
- Lagou, M. K., Argyris, D.G., Vodopyanov, S., et al., 2024. Morphometric analysis of the thymic epithelial cell (TEC) network using integrated and orthogonal digital pathology approaches. bioRxiv. 2024.2003. 2011.584509.
- Thymic alterations resulting from experimental visceral leishmaniasis in a Syrian hamster (Mesocricetus auratus) Vet. Immunol. Immunopathol.. 2023;257:110558
- [Google Scholar]
- Generation of functional Thymusoids from human pluripotent stem cells. Stem Cell Rep.. 2023;18(4):829-840.
- [Google Scholar]
- Reis, M.D.d.S., Veneziani, L.P., Porto, F.L., et al., 2023. Intrathymic somatotropic circuitry: consequences upon thymus involution. Front. Immunol. 14 1108630.
- Inflammation and oxidative stress in snakebite envenomation: a brief descriptive review and clinical implications. Toxins.. 2022;14(11):802.
- [Google Scholar]
- Ant venoms contain vertebrate-selective pain-causing sodium channel toxins. Nat. Commun.. 2023;14(1):2977.
- [Google Scholar]
- Santos, A.T.d., Cruz, G.S., Baptista, G.R., 2021. Anti-inflammatory activities of arthropod peptides: a systematic review. J. Venomous Anim. Toxins including Trop. Diseases. 27.
- The diversity of venom: the importance of behavior and venom system morphology in understanding its ecology and evolution. Toxins.. 2019;11(11):666.
- [Google Scholar]
- Toxic and immune allergic responses of ant venom toxins: a review. Int. J. Pharm. Pharm. Sci. 2021
- [Google Scholar]
- Immune tolerance and the prevention of autoimmune diseases essentially depend on thymus. Homeostasis. Front. Immunol.. 2024;15 1339714
- [Google Scholar]
- Neutrophils in cancer carcinogenesis and metastasis. J. Hematol. Oncol.. 2021;14:1-17.
- [Google Scholar]


