

Translate this page into:
Comparative assessment of polyphenolics’ content, free radicals’ scavenging and cellular antioxidant potential in apricot fruit
⁎Corresponding author at: Department of Environmental Sciences, COMSATS University Islamabad, Abbottabad Campus 22060, Pakistan. amabbasi@cuiatd.edu.pk (Arshad Mehmood Abbasi)
-
Received: ,
Accepted: ,
This article was originally published by Elsevier and was migrated to Scientific Scholar after the change of Publisher.
Peer review under responsibility of King Saud University.
Abstract
Abstract
Natural antioxidants possess health beneficial properties and are being substantially used in foods, cosmetics and pharmaceutical products. Polyphenolics content, antioxidant activity and HepG2 liver cancer cells’ inhibition potential were determined and compared in the fruit of apricot cultivars collected from lower Himalayan region of Pakistan using standard analytical procedures. Comparatively, fruit of AP3 cultivar had highest levels of total phenolics and total flavonoids contents (220.5 ± 15.9 mgGAE/100 g and 382.0 ± 18.0 mgQE/100 g, respectively) on fresh weight basis. Fruit of the same cultivar had maximum DPPH scvenging potential (94.24 ± 4.55%), oxygen radicals absorbance capacity at 4.71 ± 0.12 mMolTE/100 g and inhibition of HepG2 cancer cells (45.80 ± 4.01 µMolQE/100 g). Though, fruit of AP4 cultivar was rich in vanillic acid, caffeic acid, vanillin, epi-catechin and quercetin, but had relatively low antioxidant and anticancer potential. Disparities in the phytochemical composition and properties of apricot fruit are attributed to genetic differences and growing conditions. Total phenolics, total flavonoids and caffic acid depicted highly significant positive association (˃90%) with ORAC, CAA and FRAP. Our findings suggest that being a rich source of health beneficial secondary metabolites, apricot fruit of Himalayan region of Pakistan could contribute considerably in socio-economic development of the local communities and as a functional food in regional and global markets.
Keywords
Fruit
Polyphenolics
HepG2
CAA
ORAC
Apricot
Himalayas

1 Introduction
Various stress conditions such as temperature, light intensity, pathogenesis, nutritional deficiency, pests and herbivores attacks enhance the production of secondary metabolites particularly the phenolics compounds in plants (Yan et al., 2020). Natural antioxidants viz. phenolics, flavonoids, vitamins and metals (Se, Mg, Mn) etc. have substantially been used in foods, cosmetics and pharmaceutical products (Hrelia and Angeloni, 2020). Polyphenolics possess anti-carcinogenic, antioxidant and anti-inflammatory properties and have abilities to prevent oxidative stress (Albuquerque et al., 2021). Average requirement of polyphenolics by human is 1 g/day, which are mainly provided by tea, coffee, seeds, fresh fruits and vegetables etc. (Scalbert and Williamson, 2000). Phenolic acids are present in bound soluble form with organic acids or sugar molecules as a component of complex structures like hydrolysable tennins and lignins (Shahidi et al., 2019) and have antioxidant, anti-mutagenic, antimicrobial, anti-carcinogenic and anti-inflammatory properties (Albuquerque et al., 2021). Flavonoids are mainly present in flowers, fruits, leaves, and produce striking colors in these parts. They are further classified in to flavanones, flavones, flavonols, anthocyanins, quercetin, rutin, catechin and kaempferol that possess health beneficial properties (Rupasinghe, 2020).
Apricot (Prunus armeniaca L.), belongs to family Rosaceae. Its fruit is yellowish to orange red in color containing sweet and edible kernels except few cultivars having bitter and non-edible kernels (Chen et al., 2020). Central Asia, Afghanistan, Iran, Turkey and Western China are the main apricot growing regions (Leccese et al., 2007). Currently, Turkey is the world’s top apricot producing country, followed by Iran and Uzbekistan, whereas Pakistan is ranked at 6th position with annual production over 177,630 tones (FAOSTAT, 2016). Being a rich source of health beneficial nutrients and phytochemicals, apricot has become a product of great interest (Wani et al., 2017). Apricot fruit is enriched in polyphenols such as catechin, epicatechin, chlorogenic acid, p-coumaric acid, kaempferol, quercetin, rutin, ferulic acid carotenoids and minerals (Kan et al., 2014). Antioxidant, anticancer, antimicrobial, anti-mutagenic, cardio-protective, hepato-protective and anti-inflammatory properties of apricot are due to these bioactive compounds (Gautam et al., 2020). In addition, apricot fruit also contains high concentration of beta-carotene, vitamin A and C, which help immune system to fight against cancer, heart diseases and vision problem (Campbell et al., 2013). In Pakistan, different cultivars of apricot are grown in Northern areas, Hazara, Swat, Balochistan and Kashmir. However, comparative assessment of polyphenolics composition and bioactivities in the fruit of these cultivars have rarely been reported. Therefore, present study was intended with the aim to compare polyphenolics content, free radical scavenging potential and cellular antioxidant activity against HepG2 liver cancer cells in the fruit of apricot cultivars grown in lower Himalayan region of Pakistan.
2 Material and methods
2.1 Sampling and extraction
Fresh apricot fruit of seven cultivars were collected in small baskets from different localities of lower Himalayan region of north Pakistan including Abbottabad, Murree and Haripur (Fig. 1). Samples were identified by expert taxonomist and with the help of Flora of Pakistan published by Ali and Qaiser, 1993-2018. Samples were submitted in the herbarium at COMSATS University Islamabad, Abbottabad Campus for voucher number (CUHA-73). Composite samples were washed with distilled water and stored at −4 °C till further analysis.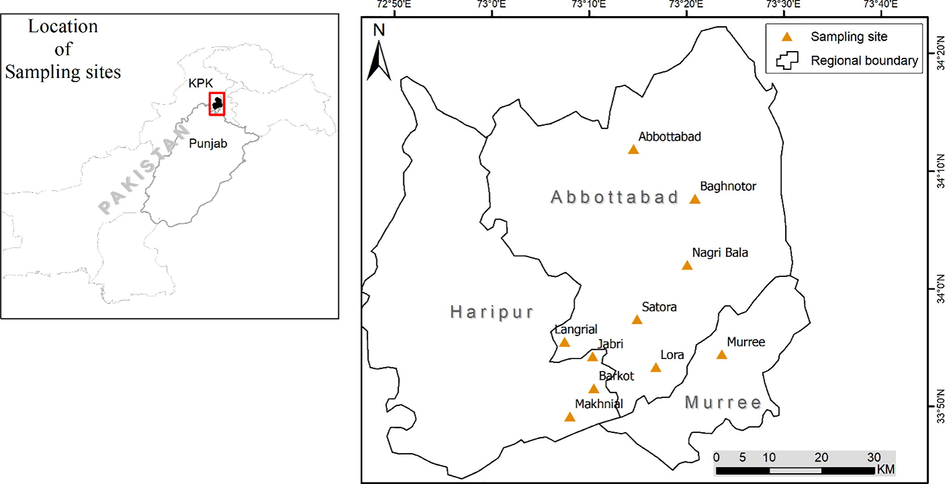
Map showing apricot sampling sites.
Polyphenolics were extracted, following the procedure as described earlier (Abbasi et al., 2015). In brief, fresh homogenised pulp of apricot fruit (1.700 g) was extracted using methanol solvent in an ultrasonic bath at 25 °C for 45 min. Afterwards extract was centrifuged at 12000 rmp for 15 min and supernatant was collected. Extraction was repeated thrice and supernatants were pooled and stored at −20 °C.
2.2 Determination of total phenolics and flavonoids contents
Folin Ciocalteu calorimetric method (Adom and Liu, 2002), was adopted to determine total phenolics content (TPC), and measured levels were expressed as mg GAE/100 g FW. Whereas, total flavonoids content (TFC) was estimated following the protocol of He et al. (2008). Final values were presented as mg RtE/100 g. All samples were analyzed in triplicates and final values expressed as mean ± SD on fresh weight basis.
2.3 HPLC analysis
The HPLC analysis were performed following the method of Abbasi et al. (2015). Extracts were filtered using 0.45 µm polyamide membrane syringe filter and Gallic acid was added as internal standard prior to injecting. The separation of polyphenolics was achieved by reversed-phase column (C18, 5 µm particle size, 250 mm length × 4.6 mm ID, Supelco USA). The solvent-A was water and formic acid (0.1%), solvent-B was methanol with formic acid (0.1%), while in gradient system of mobile phase was first solvent-B (10%) and solvent-A (90%) were run isocratic for 6 min, then proportion of B was increased from 10 to 60% in next 30 min. with an increasing rate of 10% after 6 min. interval. The injection volume and flow rate were 20.0 µL and 1 mL/min, respectively, while data were acquired at 280 nm and analysed using Perkin Elmer®’s TotalChrom® Chromatography Data System software. Polyphenolics were identified by comparing retention time with standards, while quantification was done with respect to the peak area relative to internal standard as demonstrated in Fig. S1.
2.4 DPPH radical scavenging activity
DPPH scavenging was determined using modified method of Tang et al. (2020). Briefly, 5 mL of DPPH (0.1 mM) solution was mixed with 2 mL extract and vortex vigorously. This mixture was incubated for 30 min at room temperature and absorbance was taken at 517 nm against blank. Percentage inhibition of DPPH was estimated by formula:
2.5 Hydrogen peroxide scavenging assay
The H2O2 scavenging activity was estimated using modified method of Gyesi et al. (2019). In short, H2O2 and extract (2 mL of each), were mixed and kept in incubator for 10 min at 25 °C. Blank was prepared using a phosphate buffer without H2O2 and absorbance was measured at 230 nm. The percentage H2O2 scavenging activity was determined using formula:
2.6 Ferric ion reducing antioxidant power (FRAP)
FRAP was determined using the method of Hazra et al. (2008). Concisely, 2 mL of each potassium ferricyanides (0.1%), fruit extract and phosphate buffer (0.2 M/pH 6.6) were mixed and incubated at 50 °C for 20 min. Then 2 mL of trichloroacetic acid (10%) was added and supernatant (2 mL) was mixed with distilled water and 0.01% ferric chloride (2 mL), before taking absorbance at 700 nm. Gallic acid was used as standard and final values were expressed µM GAE/100 g on fresh weigh basis.
2.7 Phosphomolybdenum complex assay
Phosphomolybdenum complex assay was performed using the procedure of Prieto et al., (1999). Shortly, sodium phosphate, ammonium molybdate and sulphuric acid were added in fruit extract and mixture was incubated at room temperature for 90 min. Absorbance was measured at 695 nm against blank and final values were expressed as mM AAE/100 g.
2.8 Oxygen radical absorbance scavenging capacity (ORAC) assay
ORAC assay as performed as explained earlier (Huang et al., 2002), using Trolox as standard. Fruit extracts were diluted with phosphate buffer (75 mM). Afterward, 20 μL of each: sample mixture, blank and standard in triplicate was added in each well of the 96 well plate, and was kept at 37 °C for 20 min. after mixing 200 µL of fluorescein (0.96 µM) in each well, while keeping outer wells empty to avoid variations in calculations. Finally, 20 μL of 2,2′-Azobis(2-methylpropionamidine) dihydrochloride (AAPH) was added and fluorescence intensity was determined using micro-plate reader (Sunnyvale, CA-USA), on regular intervals. Measured levels of ORAC were expressed as uMTE/g and data were presented as mean ± SD.
2.9 Cellular antioxidant activity (CAA) assay
CAA, was performed to check the human hepatocellular carcinoma (HepG2, ATCC HB-8065), obtained from “American Type Culture Collection-ATCC (Rockville, MD, U.S.A.). HepG2 cells inhibition capacity of apricot fruit was determined following the method of Wolfe and Liu (2007). Qurectin was used as standard, while Dichlorofluorescin diacetate (DCFH-DA) and AAPH were used as fluorescence probe and free radical donor, respectively. In a nutshell, HepG2 cells (6 × 10⁴), were seeded in each well of 96-wellplate containing 100 μL of the growth media and incubated for 24 h. Growth media was removed and wells were washed with ‘phosphate buffered saline’ (PBS). Then HepG2 cells were treated with 100 uL of treatment medium containing sample extracts (100 μL) and DCHF-DA (25 μM/100 μL), followed by the addition of 600 μL of ABAP in 100uL HBSS. Subsequently, 96 well plates were kept in a molecular device (Sunnyvale, CA-USA) and fluorescence intensity was determined at excitation (485 nm) and emission (535 nm), recorded every 5 min. for 1 h. CAA was calculated as umol QE/100 g, on fresh weight basis and data were reported as mean ± SD for triplicate analysis.
2.10 Statistical analysis
Difference between mean values of all parameters were determined by Tukey’s multiple comparison test using SPSS-13.0 software (SPSS Inc., Chicago, IL, USA). SigmaPlot 12.1 and GraphPad Prism 8.0.1.244 were used for graphical presentation.
3 Results and discussion
3.1 Total phenolics and flavonoids in apricot fruit
As mentioned in Fig. 2, fruit of AP3, had highest TPC (220.5 ± 15.9 mg GAE/100 g) and TFC 382.0 ± 18.0 mg QE/100 g) on fresh wait basis (p < 0.05). Comparatively, these values higher than reported in apricot fruit from Kashmir (Hussain et al., 2013), India (Wani et al., 2017), Czech Republic (Sochor et al., 2010), Turkey (Esra Capanoglu, 2014), and China (Fan et al., 2018). However, TPC and TFC in the fruit of other apricot cultivars from Northern areas of Pakistan and Serbia (Ali et al., 2011; Miletic et al., 2014), were relatively higher than our samples.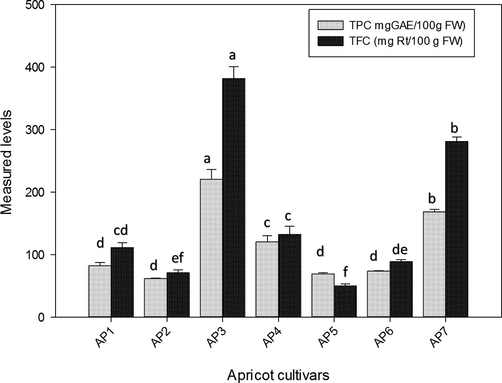
Comparative assessment of total phenolics and total flavonoids in apricot fruit of different cultivars.
3.2 Phenolic acids and flavonoids composition of apricot fruit
Chlorogenic, ferulic and p-coumaric acids were present in the fruits of all cultivars (Table 1). Comparatively, AP4 fruit contains maximum vanillic acid, followed by AP6 and AP5 (31.67 ± 2.15, 21.32 ± 1.84 and 7.420 ± 0.67 μg/g, respectively), on fresh weight basis (p < 0.05). Therefore, fruits of these cultivars may possess significant anticancer and anti-inflammatory source (Vetrano et al., 2005). In addition, vanillic acid in our samples was higher than reported in the fruits apricot reported from India and Czech Republic (Wani et al., 2017; Sochor et al., 2010). Measured levels of chlorogenic acid ranged from 0.495 ± 0.01 to 21.37 ± 1.55 μg/g FW, in AP1 and AP7, respectively. These values for relatively higher than reported previously (Dragovic-Uzelac et al., 2005) in apricot fruit at different maturity stages. In addition, consumption of apricot fruit with high chlorogenic acid could significantly induces fat loss in our body (Greenberg et al., 2008). Syringic acid was higher in the fruits of AP6 and AP5 (0.954 ± 0.10 and 0.871 ± 0.16 μg/g FW, respectively). Ascending order of ferulic acid in the fruits of all cultivars was: AP3 < AP4 < AP5 < AP2 < AP7 < AP6 < AP1. Likewise, AP5 and AP4 fruit had maximum p-coumaric acid (29.42 ± 1.21 and 27.44 ± 3.01 μg/g, respectively), whereas, caffeic acid was below the detection limit in majority of the samples. Relatively, p-coumaric acid, ferulic acid and caffeic acid contents in our samples were higher than previous report (Sultana et al., 2012). AP. Apricot varieties, VA. vanillic acid, CA. chlorogenic acid, SA. syringic acid, FA. ferulic acid, p-CA. p-coumaric acid, CfA. caffeic acid, Bdl. Below the detection limit. Letters (a-d) indicating significant difference in values at p < 0.05.
Cultivars
VA
CA
SA
FA
p-CA
CFA
AP1
Bdl
0.495 ± 0.01d
0.398 ± 0.33ab
16.05 ± 2.54a
5.726 ± 1.49b
Bdl
AP2
2.168 ± 0.12d
3.107 ± 0.00bc
0.243 ± 0.16ab
3.650 ± 0.51b
0.299 ± 0.24c
Bdl
AP3
2.380 ± 0.39d
3.873 ± 0.11b
0.063 ± 0.03b
0.768 ± 0.18b
0.347 ± 0.26c
Bdl
AP4
31.67 ± 2.15a
3.524 ± 0.17bc
Bdl
1.929 ± 0.15b
27.44 ± 3.01a
0.116 ± 0.03a
AP5
7.420 ± 0.67c
1.263 ± 0.09 cd
0.871 ± 0.16a
2.589 ± 0.60b
29.42 ± 1.21a
0.007 ± 0.00b
AP6
21.32 ± 1.84b
4.828 ± 0.19b
0.954 ± 0.10a
12.70 ± 1.85a
2.956 ± 0.44b
Bdl
AP7
1.832 ± 0.26d
21.37 ± 1.55a
Bdl
3.757 ± 0.53b
0.317 ± 0.30c
0.008 ± 0.00b
Among flavonoids, AP4 fruit contains maximum vanallin, epi-catechin and querctin contents (Table 2), whereas catechin was higher in AP1 (18.07 ± 1.81 μg/g FW). However, catechin was relatively lower than previous reports (Dragovic-Uzelac et al., 2005; Madrau, et al., 2009). Vanillin concentration was: AP4˃AP1˃AP6˃AP5˃AP7˃AP2˃AP3 in studied samples. Though, epi-catechin was highest in AP2, but was below the detection limit in AP1, AP3, AP4 and AP6. Likewsie, epi-catechin in our samples was lower than earlier reports (Madrau, et al., 2009). Quercetin was highest in AP4 and AP5 (7.623 ± 1.97 and 5.301 ± 3.16 μg/g), while descending order of rutin was: AP4˃AP6˃AP7˃AP1˃AP3˃AP5˃AP5. And rutin concentration in our samples was comparable to apricot reported from Turkey (Ozsahin & Yılmaz 2010). Trilobatin content was highest in AP2 (1.436 ± 0.03 μg/g FW), followed by AP1, AP4 and AP7. Concentration of catechin, vanillin, epicatechin, quercetin and rutin were comparable with apricot fruit from China, India, Serbia, Turkey and Czech Republic (Fan et al., 2018; Wani et al., 2017, Miletic et al., Kan et al., 2014; Sochor et al., 2010). In general, catechin was highest in our samples, followed by epi-catechin and rutin and these variations in the measured levels of polyphenolics in our samples compare to reported before may be due to diverse growing conditions, genetic variation, harvesting time and analytical techniques used (Kan et al., 2014), and such disparities could be beneficial as chemotaxonomic markers in differentiation at species or variety level (Gazdik et al., 2008). AP. Apricot varieties, CTC. Catechin, VN. Vanillin, E-CTC. Epicatechin, QT. Quercetin, RT. Rutin, Tbt. Trilobatin, Bdl. Below the detection limit. Letters (a-e) indicating significant difference in values at p < 0.05.
Cultivars
CTC
VN
E-CTC
QT
RT
Tbt
AP1
18.07 ± 1.81a
1.630 ± 0.54ab
Bdl
0.398 ± 0.36c
6.916 ± 0.05c
1.272 ± 0.02b
AP2
Bdl
0.052 ± 0.06c
1.992 ± 0.53a
0.044 ± 0.01d
0.495 ± 0.01e
1.436 ± 0.03a
AP3
0.236 ± 0.07c
0.050 ± 0.02c
Bdl
0.608 ± 0.40b
5.183 ± 0.12 cd
Bdl
AP4
16.09 ± 1.74a
3.110 ± 1.40a
Bdl
7.623 ± 1.97a
9.817 ± 0.11a
1.107 ± 0.01c
AP5
0.239 ± 0.17c
0.821 ± 0.23ab
0.594 ± 0.52b
5.301 ± 3.16ab
3.618 ± 0.03d
Bdl
AP6
14.33 ± 1.85b
0.905 ± 0.16ab
Bdl
0.912 ± 0.20b
9.361 ± 0.03a
Bdl
AP7
0.763 ± 0.29c
0.561 ± 0.47c
0.583 ± 0.57b
0.103 ± 0.03c
8.091 ± 0.05b
1.040 ± 0.02c
Heat maps showing hierarchal clustering of phenolic acids and flavonoids were generated using BioVinci 1.1.5 (Fig. 3a and b). Different colours in the rectangles indicates concentration of phenolic acids and flavonoids in apricot fruit. Based on the concentration of phenolic acids all cultivars were categorized into two main clusters that are further constitute four sub clusters (Fig. 3a). In first cluster, AP7 and AP3 were closely associated, followed by AP2 in second cluster, which showed some association with AP7 and AP3. Third cluster comprises of AP1 and AP6, while AP4 and AP5 were in the fourth. Colour scheme in heat map revealed that AP4 variety had highest concentration of vanillic and caffeic acid, whereas AP7, AP6, AP1 and AP4 exhibited highest concentrations of chlorogenic acid, syringic acid, ferulic acid and p-coumaric acid, respectively. Similarly, based on flavonoids, all cultivars assembled into two main clusters (Fig. 3b). First cluster includes AP1, AP2, AP4 and AP6, whereby AP6 and AP1 showing more relevancy, but AP2 was more close to AP4. Second cluster comprises of AP7 and AP3 cultivars. Though, AP5 was in separate group but showing relevancy with AP7 and AP3. Different colours in heat map indicating concentration of different flavonoids in the fruit of apricot. Fruits of AP4 were rich in vanillin, epi-catechin, quercetin and rutin. However, catechin was more in AP1 whereas AP2 fruit was rich in trilobatin.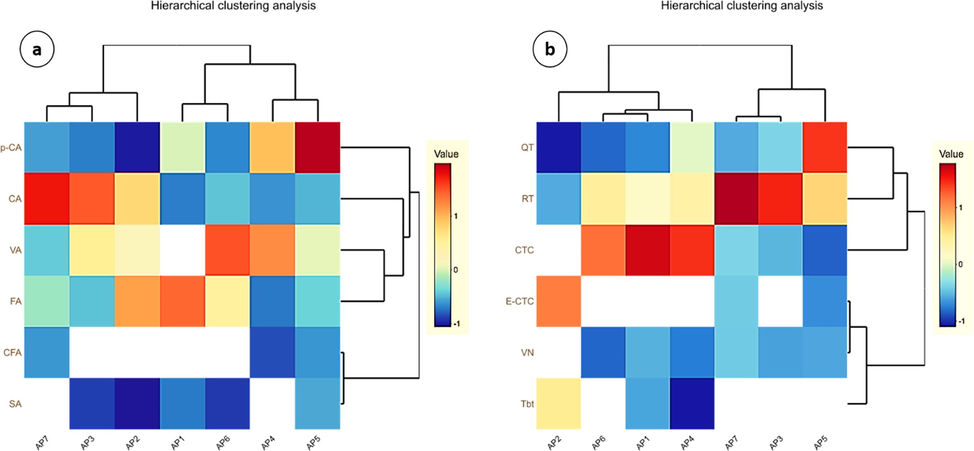
Hierarchal clustering analysis and heat map of phenolic acids (a) and flavonoids (b). VA. vanillic acid, CA. chlorogenic acid, SA. syringic acid, FA. ferulic acid, p-CA. p-coumaric acid, CfA. caffeic acid, CTC. Catechin, VN. Vanillin, E-CTC. Epicatechin, QT. Quercetin, RT. Rutin, Tbt. Trilobatin.
3.3 Free radical scavenging capacity
Overall, AP3 depicted highest DPPH radical scavenging potential (94.24 ± 4.55%), followed by AP6 and AP4 (Table 3). These values were relatively higher compared to reported earlier in apricot fruits from Kashmir and Northern areas of Pakistan (Hussain et al., 2013; Ali et al., 2011), India (Wani et al., 2017), and Czech Republic (Sochor et al., 2010). The H2O2 radical scavenging activity in studied samples varied from 16.85 ± 2.49 to 60.97 ± 2.87% (Table 3), whereby AP5, AP4 and AP2 were among the top three cultivars while, AP3 depicted lowest potential. Comparatively, H2O2 scavenging potential in studied samples was more than earlier report (Touati et al., 2014). Fruit of AP4 cultivar had the highest phosphomolybdenium complex inhibition potential (379.1 ± 75.7 mg AAE/100 g), followed by AP2 and AP5 (Table 3). AP6 fruit had high Fe+3 reducing potential (265.6 ± 33.5 mg GAE/100 g FW), followed by AP3 and AP7. And these values were relatively higher than reported in the fruit of Czech Republic and Turkish apricot varieties (Sochor et al., 2010; Esra Capanoglu, 2014). AP. Apricot varieties, DPPH. ‘2,2-diphenyl-1-picrylhydrazy’, H2O2. Hydrogen peroxide, PMA. Phosphomolybdenium complex assay, FRAP. Ferric ion reducing antioxidant power, AAE. Ascorbic acid equivalent, GAE. Gallic acid equivalent, TE. Trolox equivalent. Different letters (a–d) indicate values are significantly different at p < 0.05.
Cultivars
DPPH (%)
H2O2 (%)
PMA (mg AAE/100 g)
FRAP (mg GAE/100 g)
ORAC (mMol TE/100 g)
AP1
59.62 ± 0.82d
36.05 ± 2.58b
169.7 ± 3.40c
197.9 ± 5.53abc
1.653 ± 0.11c
AP2
51.74 ± 6.81d
55.54 ± 0.29a
312.8 ± 13.8ab
176.8 ± 5.68c
1.163 ± 0.12c
AP3
94.25 ± 4.55a
16.86 ± 2.50c
163.0 ± 23.4c
253.8 ± 42.6ab
4.707 ± 0.12a
AP4
88.14 ± 0.62abc
58.49 ± 8.74a
379.2 ± 75.8a
187.8 ± 31.6bc
1.910 ± 0.06c
AP5
78.92 ± 8.59bc
60.97 ± 2.88a
303.0 ± 25.5ab
178.9 ± 19.8c
1.018 ± 0.09c
AP6
90.28 ± 5.38ab
36.01 ± 1.00b
222.9 ± 27.5bc
265.6 ± 33.5b
1.590 ± 0.01c
AP7
75.30 ± 1.49c
52.37 ± 6.84a
249.7 ± 16.7bc
238.0 ± 21.9abc
3.545 ± 0.16b
Antioxidant potential in apricot fruit was determined for the first time using ORAC assay, which is comparatively low cost technique (Huang et al., 2002), and provides exceptional accuracy (Ou et al., 2001). As shown in Table 3, reasonably, AP3 fruit is leading with highest ORAC value (4.71 ± 0.12 mMol TE/100 g) on fresh weight basis, followed by AP7 and AP4 (3.55 ± 0.16 and 1.91 ± 0.06 mMol TE/100 g FW, respectively) and these values were significantly different (p < 0.05).
3.4 Cellular antioxidant activity
Although, many in vitro assays are in practice to evaluate free radical scavenging potential of natural antioxidants, but on the whole their efficacy is still under discussion (Schaich et al., 2015), because of significant fluctuation in their results, specifically in living systems and under non-physiological conditions. Moreover, to protect cells from oxidative stress by scavenging of free radical species is not the sole criteria, because antioxidant compounds may also control gene expressions, cell singling and stimulate antioxidant enzymes (Lopez-Alarcon and Denicola, 2013). Consequently, cell based antioxidant assays are more appropriate methods and assist as an important connection between in vitro and in vivo trials. In this context, “cellular antioxidant activity (CAA) assay” introduced by Wolfe and Liu (2007) is valuable to address uptake, distribution, and metabolism of phytochemicals and dietary supplements present in food and medicinal plant species for potential biological activity (Kelletta et al., 2018).
Cellular antioxidant activity against HepG2 cancer cell line was studied for the first time in the fruit of apricot. Overall, all cultivars exhibited sound potential against HepG2 cell line ranged from 10.74 ± 0.83 to 45.80 ± 4.01 μmol QE/100 g FW (Fig. 4). Methanolic extract of AP3 and AP7 fruit showed maximum inhibition of HepG2 cells (45.80 ± 4.01 and 36.02 ± 4.17 μmol QE/100 g, respectively) on fresh weight basis with significant difference at p < 0.05. Though, AP4 showed considerable potential (21.40 ± 1.22 μmol QE/100 g FW) to inhibit HepG2 cells, but was not significantly different from other cultivars except AP3 and AP7.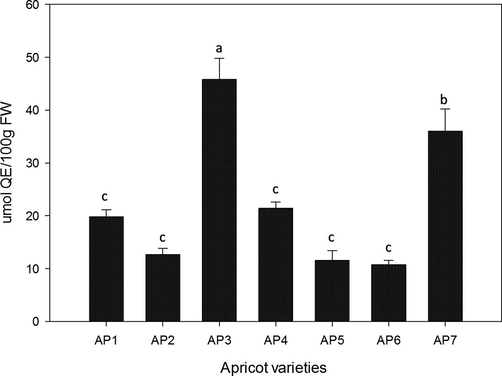
Cellular antioxidant activity against HepG2 cancer cell line in the fruit of apricot.
Results of hierarchal clustering (Fig. 5), revealed that except AP3 that exhibited significant potential in ORAC and CAA assays, all cultivars were categorized into two main clusters. Such as first cluster includes AP7, AP1 and AP6 cultivars, where AP7 and AP1 were closely associated. Second cluster exposed strong association between AP5 and AP2 along with AP4. However, colour scheme in heat map couldn’t compare precisely the antioxidant potential in different cultivars because of different measuring units. Furthermore, these findings confirm that there is no single most consistent method to study the antioxidant potential of food and medicinal plants.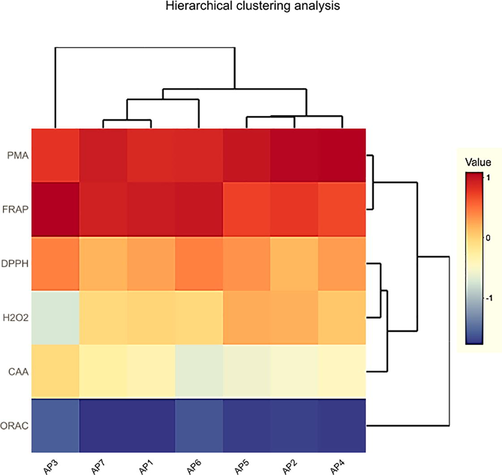
Hierarchal clustering based on antioxidant potential in apricot fruit.
Antioxidant capacity of apricot fruit assessed by aforementioned assays revealed diverse trends. Such as AP3 variety depicted over 90% scavenging of DPPH, oxygen radicals and significant inhibition of HepG2 cells. However, same variety was ranked at lowest position in H2O2 radical scavenging and phosphomolybdenium complex inhibition activities. Such a diverse behavior demonstrating disparity in the genetic makeup, particularly genes’ expression levels associated with the polyphenolics pathways in these cultivars and variation in the growing conditions. Certainly, diversity in the concentration of secondary metabolites contributes significantly in the antioxidant potential of apricot fruit more specifically and other food and medicinal plants in general. Our findings confirm that because of genetic variations in apricot grown in lower Himalayan region of Pakistan, concentration of natural antioxidants varies considerably and had a great impact on the bioactivities of fruit. Moreover, such variations may also be attributed to agro-climatic conditions, harvesting time and analytical techniques used.
3.5 Multivariate analysis
Highly significant positive associations (p < 0.01) were noted between TFC-ORAC (r = 0.999), followed by CfA-FRAP, TFC-CAA, TPC-ORAC, TPC-CAA, CfA-DPPH (r = 0.988, r = 0.987, r = 0.984, r = 0.982, r = 0.960, respectively) assed by Person correlation coefficient method (Table 4). Likewise, more than 50% positive correlations were found in TPC-PMA, TFC-PMA and p-CA-H2O2. Measured levels of polyphenolics and antioxidant activities were further evaluated by PCA using Varimex rotation with Kaiser Normalization to find out their compositional pattern in the fruit of apricot cultivars. All data were grouped in to five principle components (PCs) with Eigen value >1, exhibiting more than 90% of total variance of the data set (Table 5). First component contributes 33.37% variance of the total variation. In this component PMA assay, p-coumaric acid, H2O2 assay, quercetin and vanillin showed maximum loading percentage at 0.766, 0.745, 0.737, 0.716 and 0.669 respectively. Second component contributes 26.62% of the total variance with maximum loading value for DPPH, rutin, vanillic acid, caffeic acid, total phenolics, ORAC and FRAP (0.870, 0.798, 0.704, 0.668, 0.493, 0.392 and 0.383%, respectively). PC3 contribution was 17.80%, with highest loading values at 0.921% for ferulic acid, followed by 0.775% for catechin and 0.477% for syringic acid. Fourth component contributed 12.11% of the total variance and had elevated levels of Trilobatin, total flavonoids content and cellular antioxidant activity (0.695, 0.583, and 0.403%, respectively). Whereas in fifth component chlorogenic acid was dominating with 0.794% loading. Maximum loading values of above mentioned polyphenolics and antioxidant activities in different components indicating strong associations between them. And confirmed the contribution of secondary metabolites in free radical scavenging and antioxidant potential of apricot fruit. **Correlation is significant at the 0.01 level (2-tailed). *Correlation is significant at the 0.05 level (2-tailed). (a). Cannot be computed because at least one of the variables is constant.
Variables
TPC
TFC
VA
CA
SA
FA
p-CA
CfA
Ctc
Vn
E-ctc
Qt
Rt
Tb
DPPH
H2O2
PMA
FRAP
ORAC
CAA
TPC
1.000
TFC
0.985**
1.000
VA
−0.270
−0.377
1.000
CA
0.456
0.486
−0.308
1.000
SA
−0.614
−0.661
0.810
0.015
1.000
FA
−0.474
−0.385
0.316
−0.211
0.340
1.000
p-CA
−0.294
−0.448
0.535
−0.365
0.582
−0.284
1.000
CfA
0.025
−0.156
0.983
−0.401
.(a)
−0.771
0.439
1.000
Ctc
−0.532
−0.523
0.961**
−0.416
0.196
0.692
0.077
1.00*
1.000
Vn
−0.182
−0.304
0.900*
−0.210
0.476
0.155
0.642
0.995
0.735
1.000
E-ctc
−0.560
−0.433
−0.447
−0.433
−1.00**
0.421
−0.495
−1.00**
−1.00**
−0.941
1.000
Qt
−0.152
−0.322
0.692
−0.302
0.594
−0.381
0.954**
0.732
0.149
0.735
−0.503
1.000
Rt
0.233
0.175
0.693
0.301
0.449
0.309
0.131
0.721
0.655
0.640
−0.814
0.265
1.000
Tb
−0.946
−0.834
−0.348
−0.661
−1.00**
0.256
−0.376
1.00**
0.791
−0.449
1.00**
−0.403
−0.896
1.000
DPPH
0.530
0.441
0.463
0.077
0.258
−0.288
0.244
0.960**
−0.261
0.187
−0.992
0.380
0.583
−0.870
1.000
H2O2
−0.539
−0.614
0.196
0.136
0.452
−0.267
0.590
0.229
0.008
0.332
−0.143
0.535
−0.139
−0.169
−0.353
1.000
PMA
0.544
0.604
−0.048
0.405
0.064
0.177
−0.575
−0.366
−0.168
−0.321
−0.531
−0.472
0.485
−0.745
0.609
−0.712
1.000
FRAP
0.644
0.573
0.360
0.114
0.050
−0.378
0.072
0.988**
−0.291
0.057
−0.994
0.247
0.484
−0.819
0.968**
−0.453
0.668
1.000
ORAC
0.984**
0.999**
−0.356
0.483
−0.623
−0.369
−0.449
−0.160
−0.521
−0.304
−0.461
−0.320
0.202
−0.847
0.477
−0.633
0.640
0.605
1.000
CAA
0.982**
0.987**
−0.373
0.467
−0.722
−0.401
−0.376
−0.103
−0.504
−0.227
−0.470
−0.261
0.160
−0.877
0.373
−0.553
0.486
0.494
0.979**
1.000
Variables
Principle components
PC1
PC2
PC3
PC4
PC5
Eigen value
6.675
5.325
3.561
2.422
1.367
% Total Variance
33.37
26.62
17.80
12.11
6.837
% Cumulative Variance
33.37
59.99
77.80
89.91
96.75
TPC
−0.747
0.493
−0.288
0.306
−0.144
TFC
0.171
−0.679
0.355
0.583
−0.204
VA
0.562
0.704
0.121
−0.095
0.100
CA
−0.472
0.211
−0.355
−0.010
0.749
SA
0.258
−0.195
0.477
−0.808
−0.118
FA
0.074
−0.267
0.921
0.025
0.241
pCA
0.745
0.407
−0.205
−0.183
−0.322
CfA
0.589
0.668
−0.210
0.382
0.030
Ctc
0.433
0.311
0.775
0.314
0.127
Vn
0.669
0.581
0.239
0.367
0.063
Ectc
0.155
−0.744
−0.565
−0.045
0.194
Qt
0.716
0.582
−0.247
−0.060
−0.267
Rt
0.011
0.798
0.453
0.093
0.375
Tbt
0.551
−0.416
0.069
0.695
0.018
DPPH
−0.248
0.870
0.051
−0.318
−0.234
H2O2
0.737
−0.083
−0.496
−0.148
0.373
PMA
0.766
0.181
−0.563
−0.038
0.184
FRAP
−0.759
0.383
0.355
−0.240
0.188
ORAC
−0.850
0.392
−0.202
0.270
−0.096
CAA
−0.780
0.358
−0.265
0.403
−0.125
4 Conclusion
Genetic variation and agro-climatic conditions in apricot cultivated areas of Pakistan, effect considerably on secondary metabolites’ levels and bioactivities of its fruit. At large, fruit of apricot cultivated in the lower Himalayan region is rich in polyphenolics and possess significant in vitro antioxidant and HepG2 cell inhibition potential, specifically the AP3. Moreover, polyphenolics content in apricot fruit depicted strong association with antioxidant and HepG2 cell inhibition potential that were confirmed by multivariate analysis. We suggest that apricot cultivars grown in lower Himalayan region of Pakistan could contribute significantly in socio-economic development of the local communities being a valuable addition as functional foods and nutraceuticals in regional and global markets.
Acknowledgements
The authors extend their appreciation to the researchers supporting project number (RSP-2021/173), King Saud University, Riydah, Saudi Arabia. Special thanks to School of Food Science, SCUT China and CUI, Abbottabad-Pakistan for lab facilities.
Authors’ contribution
IS designed study, preformed experiments and prepared initial draft, XG and MA helped in sample analysis, BZ, ZA and LY involved in data analysis, proof reading, MSE, MSA, provided financial assistance and help in proof reading, AMA supervised project and prepared final draft.
Declaration of Competing Interest
The authors declare that they have no known competing financial interests or personal relationships that could have appeared to influence the work reported in this paper.
References
- Comparative assessment of phenolic content and in vitro antioxidant capacity in the pulp and peel of mango cultivars. Int. J. Mol. Sci.. 2015;16:13507-13527.
- [Google Scholar]
- Phenolic compounds: current industrial applications, limitations and future challenges. Food Funct.. 2021;12:14-29.
- [Google Scholar]
- Physico-chemical characteristics of apricot (Prunus armeniaca L.) grown in Northern Areas of Pakistan. Sci. Hortic.. 2011;130:386-392.
- [Google Scholar]
- New mechanisms of action of natural antioxidants in health and disease. Antioxidants. 2020;9:344.
- [Google Scholar]
- Characterization and the effect of maturity at harvest on the phenolic and carotenoid content of northeast USA apricot (Prunus armeniaca) Varieties. J. Agric. Food Chem.. 2013;61:12700-12710.
- [Google Scholar]
- Investigating the antioxidant potential of turkish dried fruits. Int. J. Food Prop.. 2014;17:690-702.
- [Google Scholar]
- Phytochemical profiling, antioxidant and HepG2 cancer Cells’ antiproliferation potential in the kernels of apricot cultivars. Saudi J. Bio. Sci.. 2020;27:163-172.
- [Google Scholar]
- Phenolic profiles of raw apricots, pumpkins, and their purees in the evaluation of apricot nectar and jam authenticity. J. Agric. Food Chem.. 2005;53:4836-4842.
- [Google Scholar]
- Polyphenol composition and antioxidant capacity in pulp and peel of apricot fruits of various varieties and maturity stages at harvest. Int. J. Food Sci. Technol.. 2018;53:327-336.
- [Google Scholar]
- FAOSTAT, 2016. Food and Agriculture Organization of the United State: Climate change, agriculture and food security. http://www.fao.org/publications/sofa/2016/en/.
- In-vitro antioxidant, antimutagenic and cancer cell growth inhibition activities of Rhododendron arboreum leaves and flowers. Saudi J. Biol. Sci.. 2020;27:1788-1796.
- [Google Scholar]
- Use of liquid chromatography with electrochemical detection for the determination of antioxidants in less common fruits. Molecule. 2008;13:2823-2836.
- [Google Scholar]
- Naturally occurring phenolic antibacterial compounds show effectiveness against oral bacteria by a quantitative structure-activity relationship study. J. Agric. Food Chem.. 2008;56:11151-11156.
- [Google Scholar]
- Chemical composition, total phenolic content, and antioxidant activities of the essential oils of the leaves and fruit pulp of Annona muricata L. (Soursop) from Ghana. Biochem. Res. Int. 2019:1-9.
- [Google Scholar]
- Antioxidant and free radical scavenging activity of Spondias pinnata. BMC Comp. Alter. Med.. 2008;8:63.
- [Google Scholar]
- Sodium borohydride/chloranil-based assay for quantifying total flavonoids. J. Agric. Food Chem.. 2008;56:9337-9344.
- [Google Scholar]
- Development and validation of oxygen radical absorbance capacity assay for lipophilic antioxidants using randomly methylated β-cyclodextrin as the solubility enhancer. J. Agric. Food Chem.. 2002;50:1815-1821.
- [Google Scholar]
- Bioactive compounds and antioxidant activity of gamma irradiated sun dried apricots (Prunus armeniaca L.) J. Food Com. Anal.. 2013;30:59-66.
- [Google Scholar]
- Phenolic compounds and vitamins in wild and cultivated apricot (Prunus armeniaca L.) fruits grown in irrigated and dry farming conditions. Biol. Res.. 2014;47:46.
- [Google Scholar]
- Modification of the cellular antioxidant activity (CAA) assay to study phenolic antioxidants in a Caco-2 cell line. Food Chem.. 2018;244:359-363.
- [Google Scholar]
- Total antioxidant capacity and phenolics content in apricot fruit. Int. J. Fruit Sci.. 2007;7:3-16.
- [Google Scholar]
- Evaluating the antioxidant capacity of natural products: a review on chemical and cellular-based assays. Anal. Chim. Act.. 2013;763:1-10.
- [Google Scholar]
- Effect of drying temperature on polyphenolics content and antioxidant activity of apricots. Eur. Food Technol.. 2009;228:441.
- [Google Scholar]
- Phenolic compounds and antioxidant capacity of dried and candied fruits commonly consumed in Serbia Czech. J. Food Sci.. 2014;32:360-368.
- [Google Scholar]
- Development and validation of an improved oxygen radical absorbance capacity assay using fluorescein as the fluorescent probe. J. Agric. Food Chem.. 2001;49:4619-4626.
- [Google Scholar]
- Fruit Sugar, Flavonoid and Phytosterol Contents of Apricot Fruits (Prunus armeniaca L. cv. Kabaasi) and Antioxidant Effects in The Free Radicals Environment. Asian Journal of Chemistry.. 2010;22:6403.
- [Google Scholar]
- Spectrophotometric quantitation of antioxidant capacity through the formation of a phosphomolybdenum complex: specific application to the determination of vitamin E. Analy. Biochem.. 1999;269:337-341.
- [Google Scholar]
- Flavonoids and their disease prevention and treatment potential”: Recent advances and future perspectives. Molecule. 2020;25:4746.
- [Google Scholar]
- Hurdles and pitfalls in measuring antioxidant efficacy: a critical evaluation of ABTS, DPPH, and ORAC assays. J. Fun. Foods. 2015;14:111-125.
- [Google Scholar]
- Phenolic compounds in agri-food by-products, their bioavailability and health effects. J. Food Bioact.. 2019;5:57-119.
- [Google Scholar]
- Content of phenolic compounds and antioxidant capacity in fruits of apricot genotypes. Molecule. 2010;15:6285-6305.
- [Google Scholar]
- Effect of drying techniques on the total phenolic contents and antioxidant activity of selected fruits. J. Med. Plants Res.. 2012;6:161-167.
- [Google Scholar]
- Lc-esi-qtof/ms characterization of phenolic compounds from medicinal plants (hops and juniper berries) and their antioxidant activity. Foods. 2020;9:7.
- [Google Scholar]
- Effect of storage time and temperature on the physicochemical and sensory characteristics of commercial apricot jam. Food Chemistry.. 2014;145:23-27.
- [Google Scholar]
- Characterization of the oxidase activity in mammalian catalase. J. Bio. Chem.. 2005;280:35372-35381.
- [Google Scholar]
- Evaluation of the composition of bioactive compounds and antioxidant activity in fourteen apricot varieties of North India. J. Agri. Sci.. 2017;9:66.
- [Google Scholar]
- Cellular antioxidant activity (CAA) assay for assessing antioxidants, foods, and dietary supplements. J. Agric. Food Chem.. 2007;55:8896-8907.
- [Google Scholar]
- Antioxidant mechanism of tea polyphenols and its impact on health benefits. Author links open overlay panel. Anim. Nut.. 2020;6:115-123.
- [Google Scholar]
Appendix A
Supplementary data
Supplementary data to this article can be found online at https://doi.org/10.1016/j.jksus.2021.101459.
Appendix A
Supplementary data
The following are the Supplementary data to this article:


