Translate this page into:
Combined effect of unsaturated soil condition and soil heterogeneity on methylene blue adsorption/desorption and transport in fixed bed column: Experimental and modeling analysis
⁎Corresponding author. sanadardouri_en@yahoo.fr (Dardouri Sana),
-
Received: ,
Accepted: ,
This article was originally published by Elsevier and was migrated to Scientific Scholar after the change of Publisher.
Peer review under responsibility of King Saud University.
Abstract
Several series of batch and fixed bed column experiments have been carried out to study the methylene blue sorption and transport in sandy and clay soil under different experimental conditions. The non linear forms of the pseudo-second order kinetic model and the Freundlich and Langmuir isotherm models were used to quantify the maximum adsorption capacity of the used materials. The effects of several experimental factors (flow rate, initial concentration, saturation condition of soil and soil heterogeneity) on the breakthrough curves have been undertaken. Experimental data revealed that the breakthrough curves depend on flow rate, methylene blue inlet concentration, saturation condition of soil and soil heterogeneity. A two dimensional model based on Richards equation and advection–dispersion equation coupled with adsorption model was developed. A comparative analysis between this model and Thomas model showed the effectiveness of advection–dispersion model to describe the experimental breakthrough curves and particularly in an unsaturated heterogeneous medium. The advection dispersion model reproduces perfectly the transfer mechanisms in porous media and seems to be a useful tool to better understanding the physical processes and the effect of capillary barrier of methylene blue transport in unsaturated heterogeneous soil. The result shows also that the soil heterogeneity has a significant effect on methylene blue adsorption through unsaturated layered media. Furthermore, in the interface between two layers with different hydrodynamic proprieties, the adsorption capacity increases with a decrease in kinetic adsorption rate caused by the decrease in pore water velocity.
Keywords
Methylene blue
Adsorption/desorption
Transport
Unsaturated heterogeneous soil
Breakthrough curve modeling
1 Introduction
With the fast development in industrial scale, the problem of water and soil pollution has become more serious. The use of organic dyes in many industrial products may threaten the water systems. For instance, the methylene blue (MB) is a cationic dye which is found in many industrial effluents (textile, cosmetic industries, paper and plastic). It is an important contaminant in soil and water bodies and it may induce health problems (Xing et al., 2010). Hence, the removal of MB is fundamental to ensure the non contaminated water supplies. Several adsorbents were used to remove the MB such as the activated carbons (Yang and Qiu, 2010; Foo and Hameed, 2011), Kapok fiber (Liu et al., 2012), chitosan clay composite (Auta and Hameed, 2014), modified bamboo powders (Guo et al., 2014), Natural zeolite (Wang et al., 2006), sludge (Mitrogiannis et al., 2015), swelling clay (Li et al., 2011), char (Makrigianni et al., 2015) and organo-illite/smectite clay (Wang et al., 2013). The activated carbon is the most used adsorbent for dye removal, but it is costly. As an alternative solution, many low cost adsorbents are examined to replace activated carbons. These adsorbents should be easily available and could be regenerated. Sand is used as an adsorbent in removing dyes (Rauf et al., 2008) and the removal of methylene blue (Bukallah et al., 2007; Dotto et al., 2015). Also, the clay minerals are a good adsorbent with low cost which are still receiving attention because of the various applications in industrial scale due to their attractive adsorption proprieties. The adsorption capacities of these clay minerals for dyes depend on the clay proprieties, the adsorbate and the experimental conditions (Şahin et al., 2015). The sorption to subsurface materials is one of the major processes that dominate the dye transport in soil. This process can be performed using batch and column experiments (Auta and Hameed, 2014; Zhang et al., 2011; Hamdaoui, 2006), but the dynamic adsorption systems (column experiments) are preferred because they describe well the dye adsorption capacity (Reza and Ahmaruzzaman, 2015). Sorption is also one of the most important processes which reduce the chemical infiltration in soils, but it isn’t the only dominating process that controls the MB migration in continuous fixed bed column. The MB particles move in the pore space of the medium due to advection by the fluid flow and it is dispersed according to the transport process. Therefore, the mass transfer which occurs along the continuous fixed bed column during MB migration includes three processes: (i) fluid flow, (ii) mass transport and (iii) physical and chemical adsorption. Several experimental factors influence the MB infiltration into the soil. Therefore, the breakthrough curves (BTCs) depend on the fixed bed configuration, flow rate, feed concentration, pH, temperature, adsorbent density, and other variables (Reza and Ahmaruzzaman, 2015). Besides these influencing factors, the soil heterogeneity plays an important role in reducing chemical product infiltration. The presence of capillary barrier influences the transfer of both water and pollutant (Winiarski et al., 2013). The adsorption in the vicinity of the capillary barrier increases and the interface between both porous media became an ideal area for particle detention (Prédélus et al., 2015). In unsaturated medium the transport process is more sophistical than saturated medium due to the presence of air in poral space. This can cause more retention in unsaturated soil (Tian et al., 2011). The high retention capacity in unsaturated soil causes retardation in breakthrough curve profile. The retardation factor increases in soil under dry conditions compared to the porous media under moist conditions (Sadasivam and Reddy, 2015). Indeed, the presence of moisture in soil results in an important decrease in the equilibrium adsorption capacity of soil. Moreover, the increase in moisture content in porous media may also decelerate the transport processes of air phase existing in the pore volume because molecular diffusion in water is slower than in air. The modeling of these breakthrough curves is essential to predict the adsorption behavior using parameters obtained from experimental studies. In fact, several models have been proposed for the correlation of breakthrough curve data obtained in dynamic adsorption process. For example, Thomas model (Thomas, 1944) is one among these several models used to describe the solute adsorption in fixed bed column. It was successfully used for the prediction of breakthrough curves and provides good agreement between experimental and calculated data (Uddin et al., 2009). It has been proved that Thomas model is the most suitable one to describe MB adsorption in column experiment on to modified straw adsorbent (Zhang et al., 2011), Leaf powder (Han et al., 2009), jackfruit leaf powder (Uddin et al., 2009) and natural zeolite (Han et al., 2007). However to model the transport in column adsorption, the advection dispersion model was chosen (Sadasivam and Reddy, 2015) to fit the experimental breakthrough curves obtained under different moisture conditions. In this work, a comparative numerical analysis of two models for breakthrough curves modeling has been studied using experimental data. To model the MB transfer in porous media, it is prerequisite to know the hydrodynamics and solute transport parameters. These parameters have been determined by characterizing the porous media used in this study. The advantage of the advection–dispersion compared to the Thomas model is that the different physical processes can be coupled and solved simultaneously. Furthermore, this model coupled with Richard equation and adsorption kinetic equation can be applied to a variety of materials and takes into account the porous media characteristics, the hydrodynamics and the solute proprieties. Another advantage of this model is the capabilities to study the desorption experiments and to evaluate the adsorbed concentration in solid phase.
The main goal of this study is (i) to study the adsorption–desorption and transport behavior of MB in two soils with different properties (sand and clay) using batch and column experiments; and (ii) to test the capabilities of both models to simulate non equilibrium sorption and transport of MB in soils under different experimental conditions.
2 Materials and methods
2.1 Soil and solutions
Both samples (sand and clay) used in this study were collected from an industrial zone in the region of Sousse in Tunisia. The particle size distribution of sand and clay and the exchange capacity (CEC) of clay were measured by laser diffraction particle size analyzer (Microtrac S3500) and by the Metson method (AFNOR NF X31-130), respectively. The mineralogy of the sand and clay samples was established by X-ray diffractometer (XPert PRO PANalytical). The reactive dye methylene blue used as adsorbate (basic blue 9, CI 52015) is a cationic dye with a molecular formula C16H18CIN3S·3H2O and a molar mass of 373.9 gmol−1. The wavelength of maximum absorbance for MB is 663 nm (see Table 1).
Exp A
Exp B
Exp C
Exp D
Exp E
Exp F
Exp G
Exp H
Saturation condition
Saturated
Saturated
Saturated
Saturated
Saturated
Unsaturated (S = 14.25%)
Unsaturated (S = 72.45%)
Unsaturated (S = 72.45%)
Composition
Homogeneous sand
Homogeneous sand
Homogeneous sand
Homogeneous sand
Homogeneous sand
Homogeneous sand
Homogeneous sand
Heterogeneous layered medium
C0 (mg L−1)
100
100
100
50
200
100
1000
1000
υ (mL min−1)
4.6
8.5
3.2
8.5
8.5
8.5
30
30
H (cm)
10
10
10
10
10
10
25
25
DL (m2/s)
204 · 10−5
378 · 10−5
145 · 10−5
378 · 10−5
378 · 10−5
4,45 · 10−5
32 · 10−4
1,36 · 10−4
2.2 Batch experiment
Adsorption isotherms and adsorption kinetics experiments were performed to evaluate the adsorption capacity of MB in two materials.
2.2.1 Sorption isotherms
The adsorption isotherms were performed in a set of glass flasks (60 ml) containing 25 ml of MB solutions with different initial concentrations (0, 5, 6, 10, 14, 20, 25, 40 mg/l) and a 0.5 g of adsorbent added to each solution. These MB solutions were kept under a stirring speed of 450 rpm for 48 h, to ensure that sorption equilibrium was reached. Then the supernatants were fitted and centrifuged before the measurement of its absorbance. The absorbance was measured using a UV–Vis spectrophotometer (SpectroFlex6100) by monitoring the absorbance changes at wavelength of maximum absorbance (663 nm). The MB concentrations were estimated using a calibration curve obtained by plotting the absorbance against the concentration of the MB solution. The amount of dye adsorbed per unit weight of sample (sand or clay) at equilibrium, qe (mg g−1) was calculated as follow:
Freundlich model:
Langmuir model:
2.2.2 Sorption kinetics
For the sorption kinetics experiments, vials containing 1 g of sample and 20 ml of MB solutions with 150 mg L−1 initial concentration were shaken at 450 rpm for 90 min. At the end of the predetermined time interval, the vials were filtered then centrifuged at 2500 tr/min. The supernatant solution was analyzed using UV–Vis spectrophotometer (SpectroFlex6100) to determine the dye concentration. Each experiment was replicated 3 times to verify the reproducibility of the experience.
The adsorption capacity, qt (mg g−1) was calculated as:
2.3 Column experiment
A series of fixed bed column experiments have been performed to determine the MB behavior in saturated and unsaturated soil and to study the effect of heterogeneity on MB transfer. The column used in the experiments was made with glass and has a dimension of 3.5 cm in diameter and 25 cm in length. The fixed bed column used is 10 cm. The column experiments were conducted at constant flow rate (Q = 8.5 mL min−1) and the initial MB concentration (C0 = 100 mg L−1) under saturated or unsaturated flow conditions. Then the MB was eluted from the column by rainwater flushing. During the experiment, the effluent samples were collected at the column outlet and measured for MB concentration immediately after sampling. The MB concentrations in the column effluents were determined using UV–Vis spectrophotometer. The MB breakthrough curves (BTC) were obtained by plotting relative concentrations (C/C0) versus time (t).
3 Breakthrough curves modeling
The breakthrough curves modeling allows the evaluation of fixed bed column performance. In this study two approaches have been investigated for data fitting of MB breakthrough curves on and clay materials. These models include Thomas and convection dispersion equations.
3.1 Thomas model
The Thomas model assumes that a Langmuir isotherm and second order kinetic fitted well the experimental data. It was also assumed that adsorption is limited by mass transfer and no axial dispersion is derived with adsorption. It allows the calculation of the adsorption rate constant. The equation of Thomas model can be described as:
The Thomas rate constant (kth), adsorption capacity (q0), and the correlation coefficient (R2) in different operations conditions were calculated by non linear regression analysis (see Table 2). In this table, the kth values decrease with the increase in influent MB concentration. The values of kth decreased due to the high driving force for adsorption caused by the concentration gradient. The maximum adsorption capacity q0 increases with the increase in initial MB concentration. The correlation coefficient values ranging from 0.875 to 0.988 indicate a good agreement between the experimental data and the fitted data generated using Thomas model. It is clear also from Table 3 that in the heterogeneous soil(Exp H), the equilibrium adsorption capacity (q0) found to be the higher value compared to homogeneous soil. This is due to the soil heterogeneity and the presence of clay layer with high cationic exchange capacity with MB in the bed column.
kth (ml min−1 mg−1)*10−4
q0 (mg g−1)*103
R2
Exp A
5.54
0.59
0.972
Exp B
4.01
0.56
0.988
Exp C
2.58
0.50
0.969
Exp D
4.03
0.74
0.918
Exp E
1.82
1.13
0.972
Exp F
4.01
0.56
0.986
Exp G
0.0553
2.74
0.9535
Exp H
0.075
32.17
0.877
Parameters
Sand
Clay
θs
0.31
0.508
θr
0.06
0.258
KS (ms−1)
225 · 10−5
336 · 10−7
α (cm−1)
0.0259
0.044
n
2.8
2.002
ρb (g cm−3)
1.34
1.45
3.2 Advection–dispersion model
A general transport and adsorption model for a porous medium was used to predict dynamic adsorption breakthrough. This model is based on convection dispersion equation (Eq. (7)) for two dimensional flows through a porous bed.
The rate of accumulation in the solid phase term
was accounted for the following equation:
Severe incorporation of Richard equation (Eq. (9)) is to describe the Darcy flow through porous media was coupled with advection dispersion-equation. This coupling is through Darcy velocity equation (Eq. (10)). The Richard equation is expressed as follows:
The initial and boundary condition for two dimensional problems used for solving this model are:
4 Results and discussion
4.1 Samples characterizations
The results of X-ray spectroscopy show the presence of smectite clay. The smectite clay is characterized by its cationic exchange capacity in the interlayer spaces. The value of this CEC is found to be equal to 90 meq/100 g of clay.
The X-ray diffraction pattern (Fig. 1a) had three significant reflections at 15.6°A, 3.34°A and 1.45°A. The two reflection distances of 3.31°A and 1.45°A indicated the presence of silice and that the clay is a dioctahedral smectite, respectively. The isomorphic cationic exchange in the interlayer spaces caused by the substitution of Al+3 by Mg+2 provides a deficit in charge. This negative charge is obviously compensated by an equal number of cations. Also, this mineral clay has the ability to swell in the presence of water. So the smectite clay fixes the water by adsorption to its surface and increases in volume by swelling, however this swelling decreases with the increase in layer charges. The reflection distance of 15.6°A proves that the clay is calcic clay. The particle size analysis of sand and clay samples shows that the fifty percent passing particle size (d50) was calculated as 317 μm and 11.69 μm based on sieve sizing for sand and clay, respectively (Fig. 1b).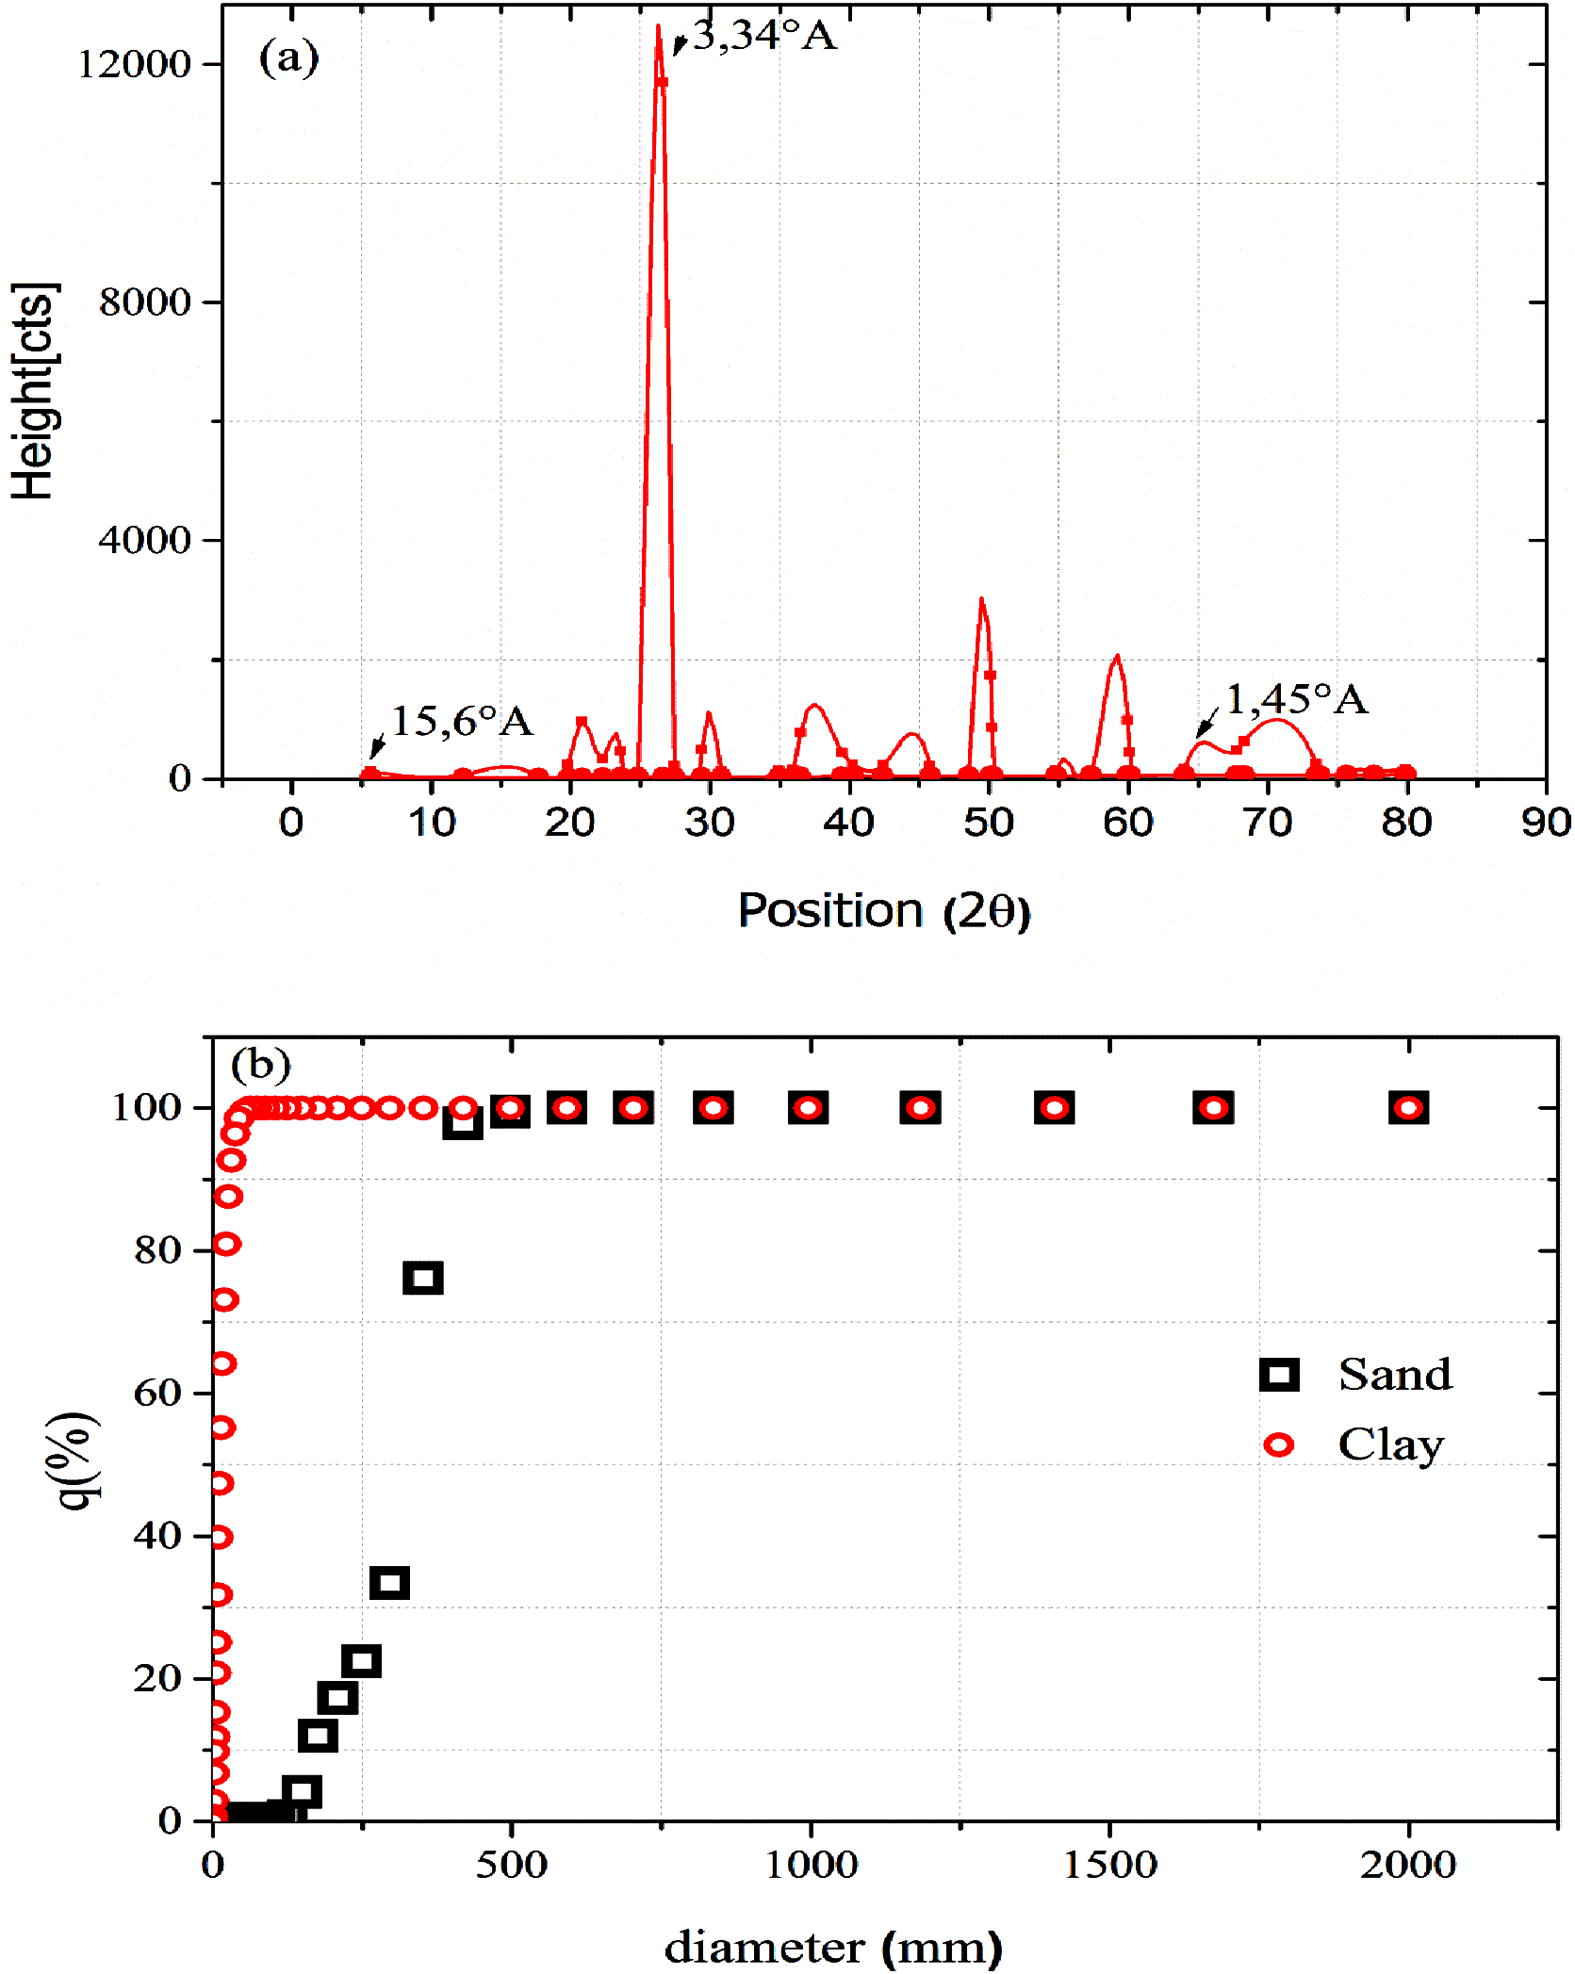
(a) XRD diagram of smectite clay and (b) particle size distribution of Sand and clay.
4.2 Adsorption models
The sorption behavior of MB in clay and sand was tested using non linear fitting. The good fitting of the model with experimental data is represented by a high value of correlation coefficient. For the clay, the Freundlich model provides a better fit in the MB adsorption isotherm (Fig. 2a). The Freundlich isotherms model predicts multilayer adsorption and describes equilibrium on heterogeneous surfaces. The applicability of Langmuir isotherm for sand material implies that monolayer adsorption exist under the experimental conditions. The prediction of kinetics adsorption is needed to evaluate the adsorption efficiency using two models. The pseudo first order equation represented very shabbily the kinetic data of MB in sand and clay. The best regression of experimental data for both sand and clay is using the type 1 of pseudo second order kinetic equation (Fig. 2b). The parameters of isotherms and kinetic adsorption models are presented in Table 4.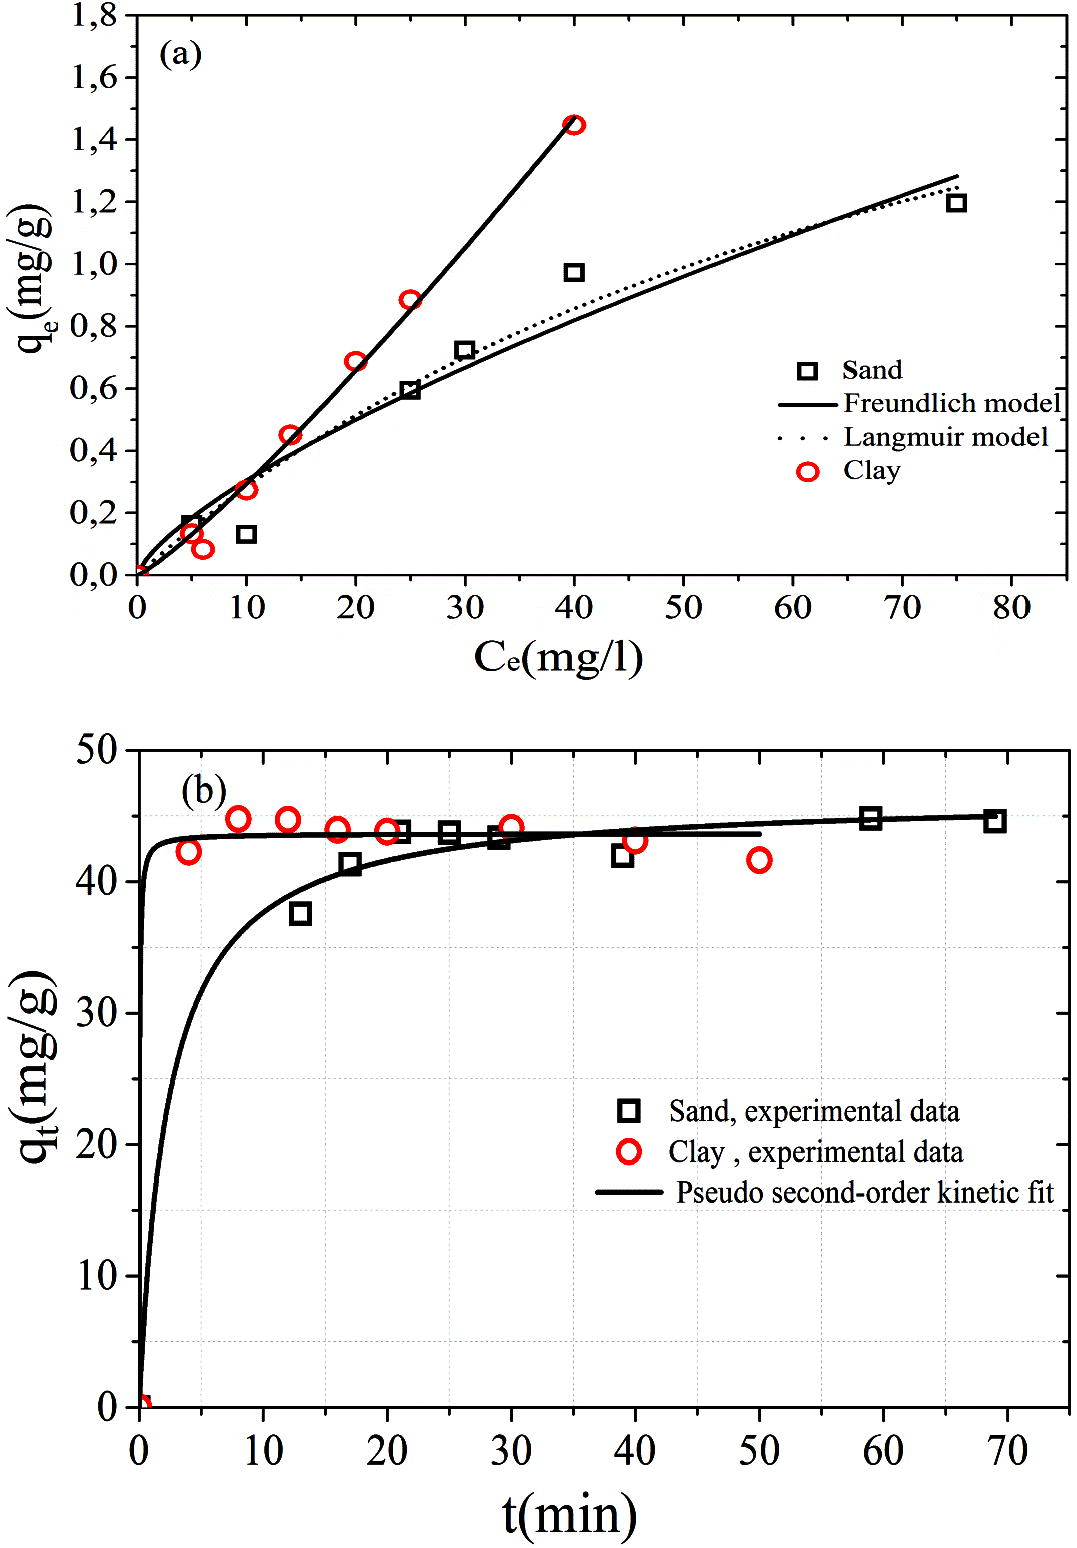
(a) Langmuir and Freundlich adsorption isotherms of MB and (b) pseudo second-order kinetic adsorption of MB.
Models
Freundlich
Langmuir
Pseudo-second order kinetic
Materials
Sand
kF = 0.0639
b = 0.0117
qe = 46.49
n = 1.36
qmax = 3.117
k2 = 0.00916
R2 = 0.845
R2 = 0.874
R2 = 0.9912
Clay
kF = 0.0136
b = 0.00224
qe = 43.65
n = 0.826
qmax = 13.72
k2 = 0.711
R2 = 0.995
R2 = 0.97893
R2 = 0.994
4.3 Column experiments
4.3.1 Effect of flow rate on BTC
The effect of flow rate on MB adsorption has been studied at three flow rates (3.2, 4.6 and 8.5 mL min−1). The initial MB concentration was 100 mg L−1 and the bed height was 10 cm (Exp A, Exp B and Exp C). Breakthrough curves obtained on MB adsorption by sand at three flow rates are presented in figure (Fig. 3a). It is clear from this figure that the breakthrough time decreases with the increasing flow rate. As the flow rate increased from 3.2 to 8.5 mL min−1, the breakthrough time decreased from 114 to 27 min. This increase of the flow rate reduced the contacting time of the MB with the adsorbent in the column and limited by the diffusion of the MB into the pores of the materials. This insufficient residence time of the MB in column reduces the adsorption capacity (Uddin et al., 2009).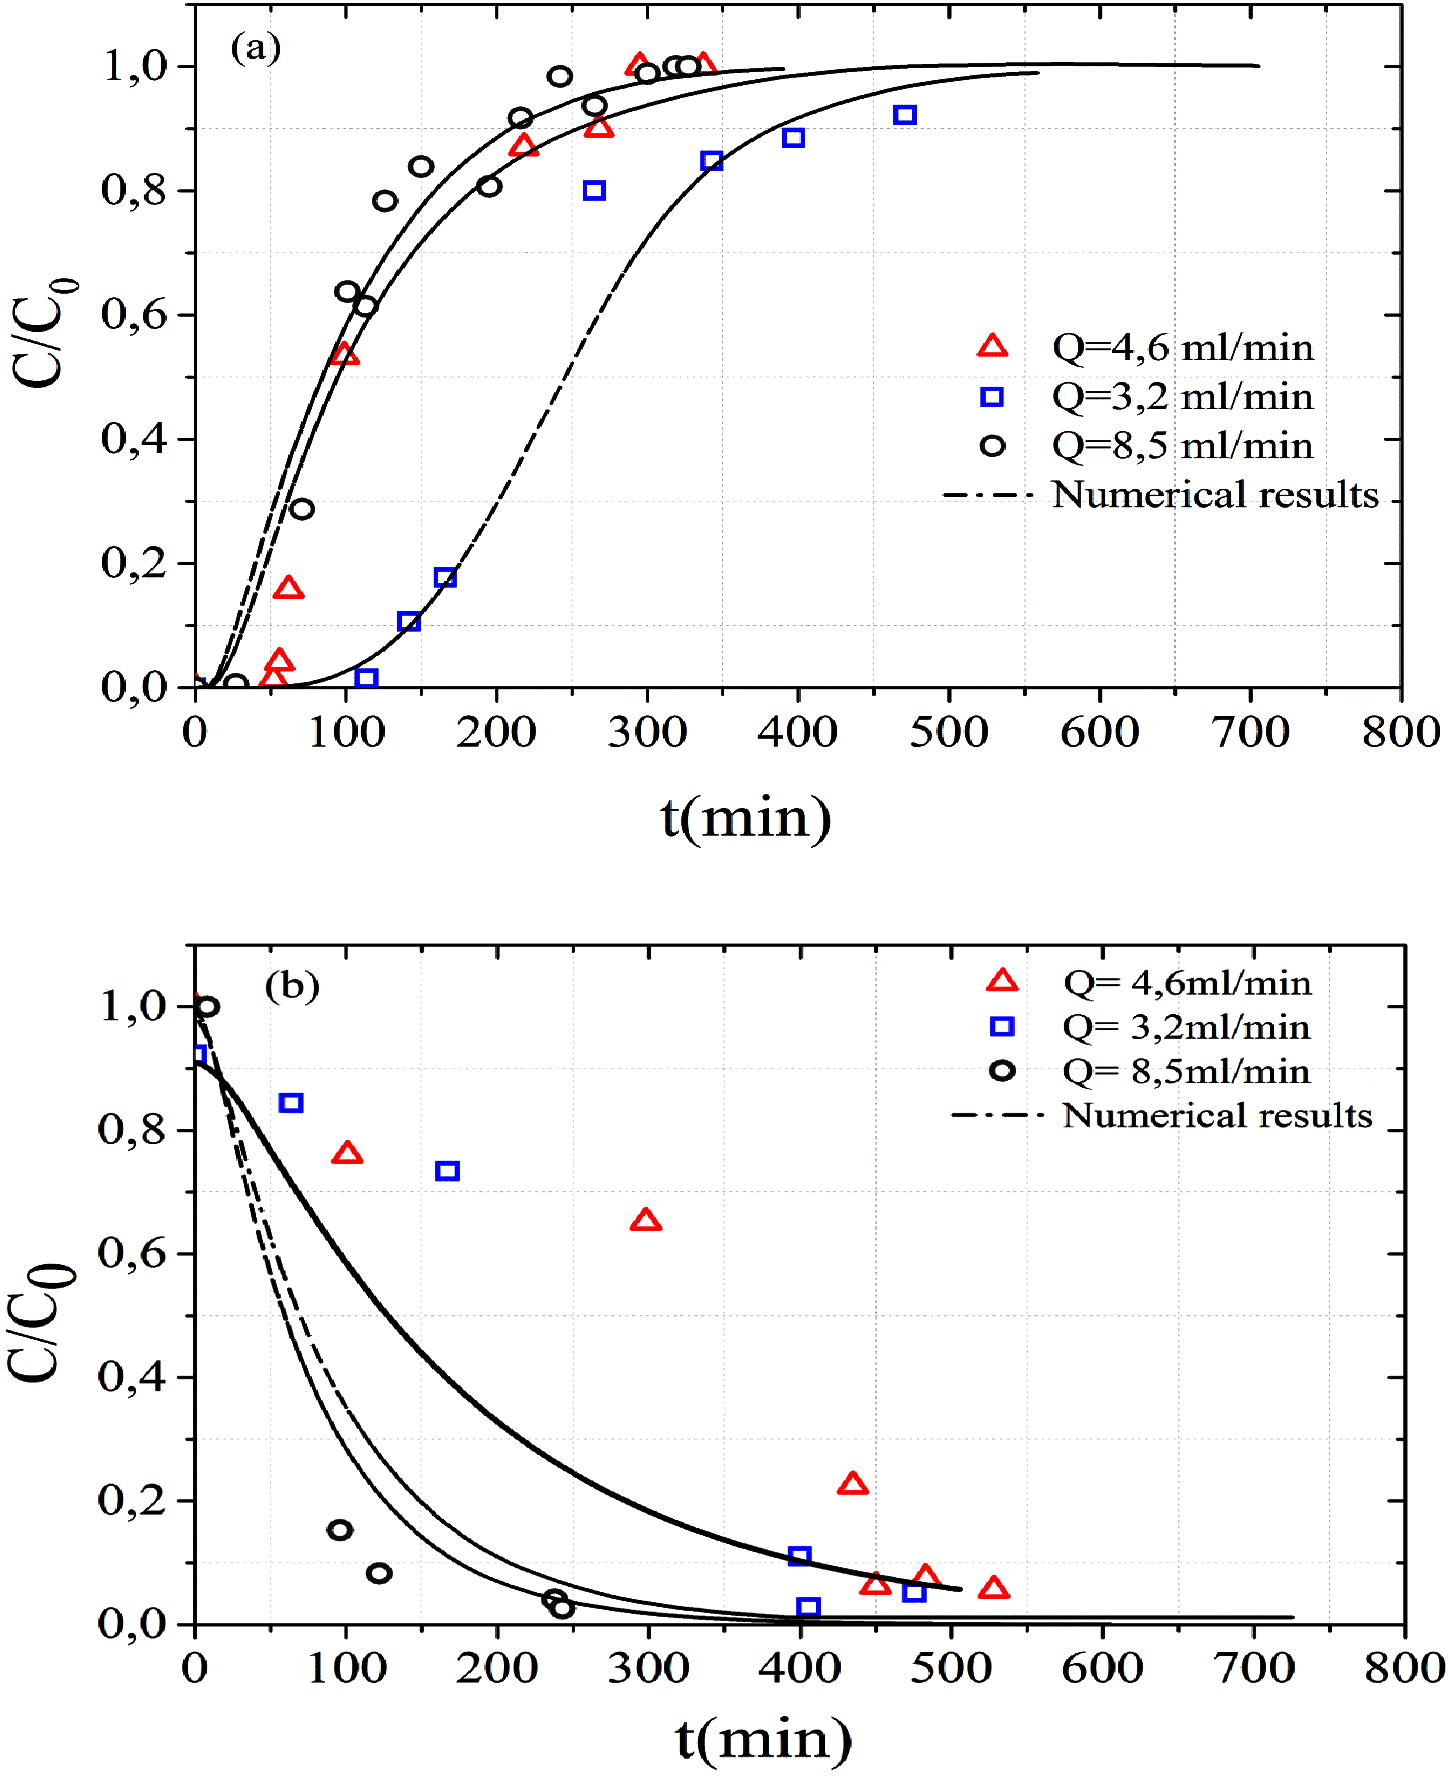
Effect of flow rate on the (a) MB adsorption and (b) MB desorption.
4.3.2 Effect of initial MB concentration on BTC
The effects of initial MB concentration have been investigated at 50 mg L−1 and 200 mg L−1 (Exp D and Exp E). The flow rate was fixed at 8.5 mL min−1 and the bed height was 10 cm. Breakthrough curves obtained on MB adsorption by sand at two initial concentrations are presented in Fig. 4. It was obvious that as the influent concentration increased the breakthrough curves became sharper and the breakthrough time decreased (Zhang et al., 2011). They indicate that with an increase in the initial MB concentration, the adsorption sites were occupied much faster and MB solution took less time to reach the saturation time.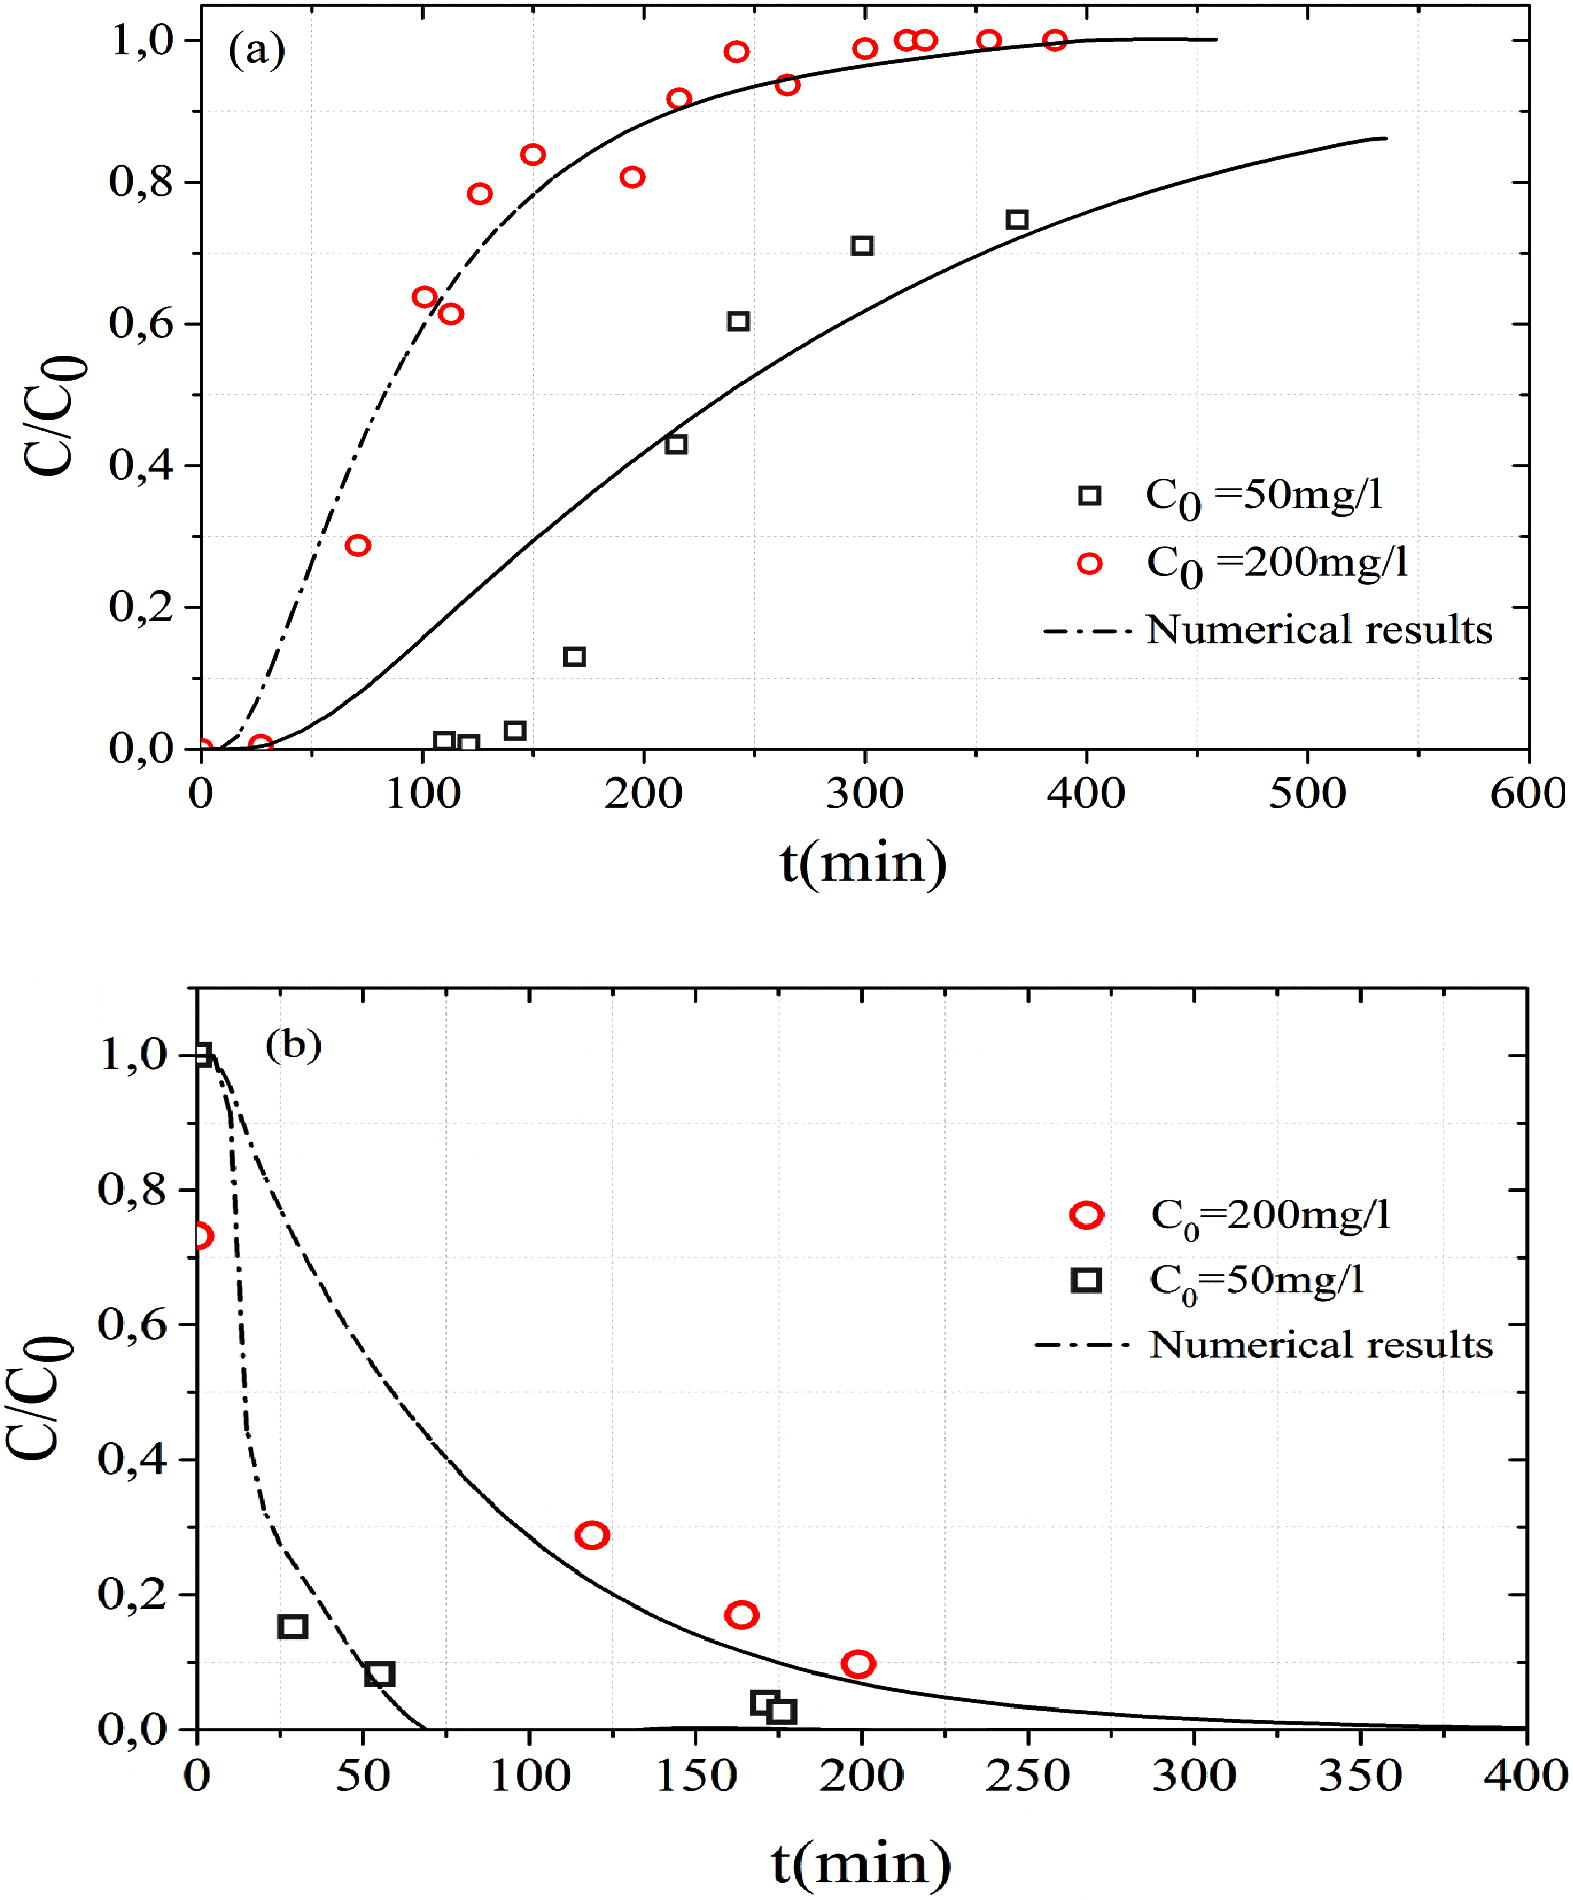
Effect of initial concentrations on the (a) MB adsorption and (b) MB desorption.
4.3.3 Effect of initial saturation condition of soil on BTC
The saturation condition of soil affects the BTC (Fig. 5a). In both experiments (Exp B and Exp F), the bed length is 10 cm, the initial concentration is 100 mg L−1 and the flow rate is 8.5 mL min−1. In the unsaturated media, the pores are partially filled with water. The MB transport in unsaturated medium causes an increase in the MB dispersion (spreading of BTC) and a faster output of effluent from the column. This fast transport reduces the breakthrough time and increases effluent tailing. Fig. 5(c) represents the spatial evolution of adsorbed concentration in solid phase. At the beginning (after 50 min of MB injection) and in the middle (after 150 min of MB injection) of experience (Exp F), the retention (adsorption) rate in unsaturated soil is higher than in saturated soil. The increase of moisture content in porous media decreases the amount of particles adsorbed onto substances, the adsorption capacity and the kinetic rate (Fig. 5c). This decrease is in agreement with the second order kinetic model hypothesis that the adsorption only depends on the surface sites (Liu, 2008). In addition, the water molecule has a diameter lower than the MB molecule, which makes it more difficult for MB solution to penetrate through the pore space of the medium in unsaturated medium. The methylene blue solution wets the dry grain and simultaneously adsorbed on the external surface of grain. This coupled action between wetting and adsorption phenomena causes a strong fixation of methylene blue particles on the solid phase which prevents their release during leaching. This may be the reason that the methylene blue desorption in the unsaturated medium is slower than the saturated soil (Fig. 5b).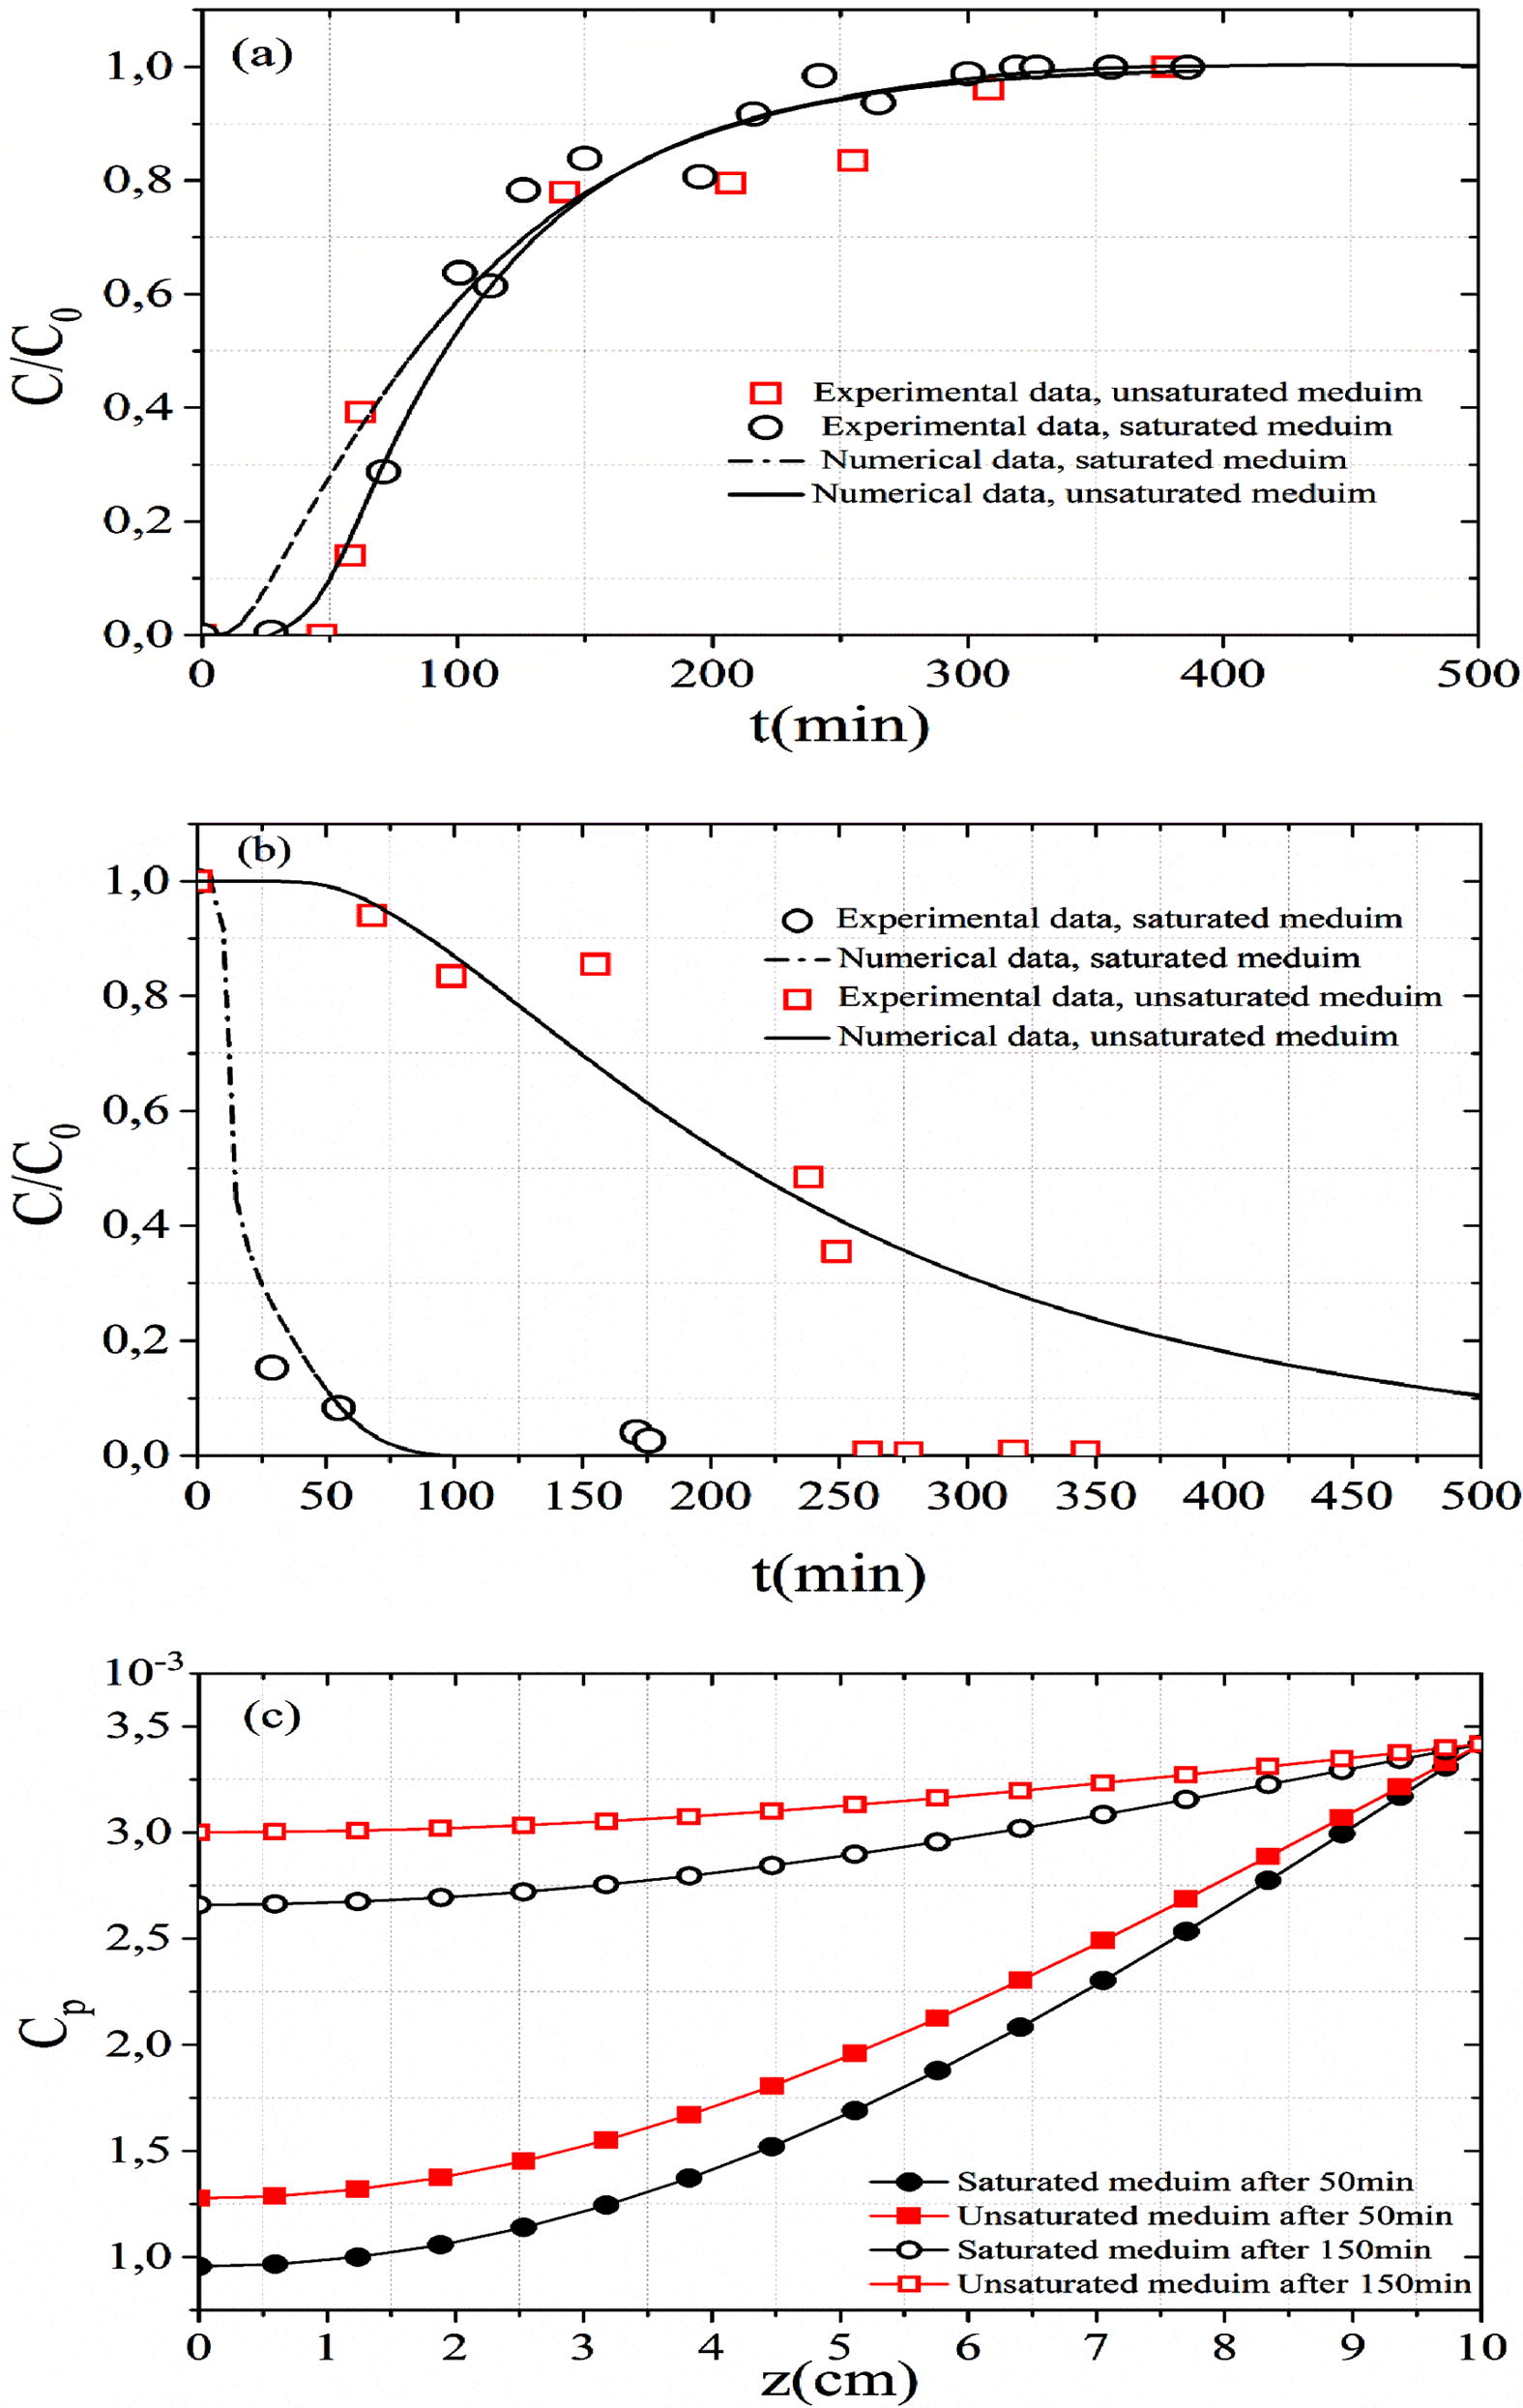
Effects of saturation condition on the (a) MB adsorption, (b) MB desorption and (c) adsorbed concentration in solid phase along with fixed bed column.
4.3.4 Effect of the soil heterogeneity on BTC
Fig. 6(a) shows the influence of soil heterogeneity in BTC. The fixed bed length is 25 cm and the MB inlet concentration is 1000 mg L−1 and the flow rate of Q = 8.5 mL min−1. The difference in the MB behavior between its infiltration into a homogeneous and heterogeneous unsaturated porous medium is clear. The heterogeneous soil consists of two layers. The first part comprises a layer of sand (20 cm, in thick) placed above a layer of clay (5 cm, in thick) to create a capillary barrier at the interface between the sand and the clay material.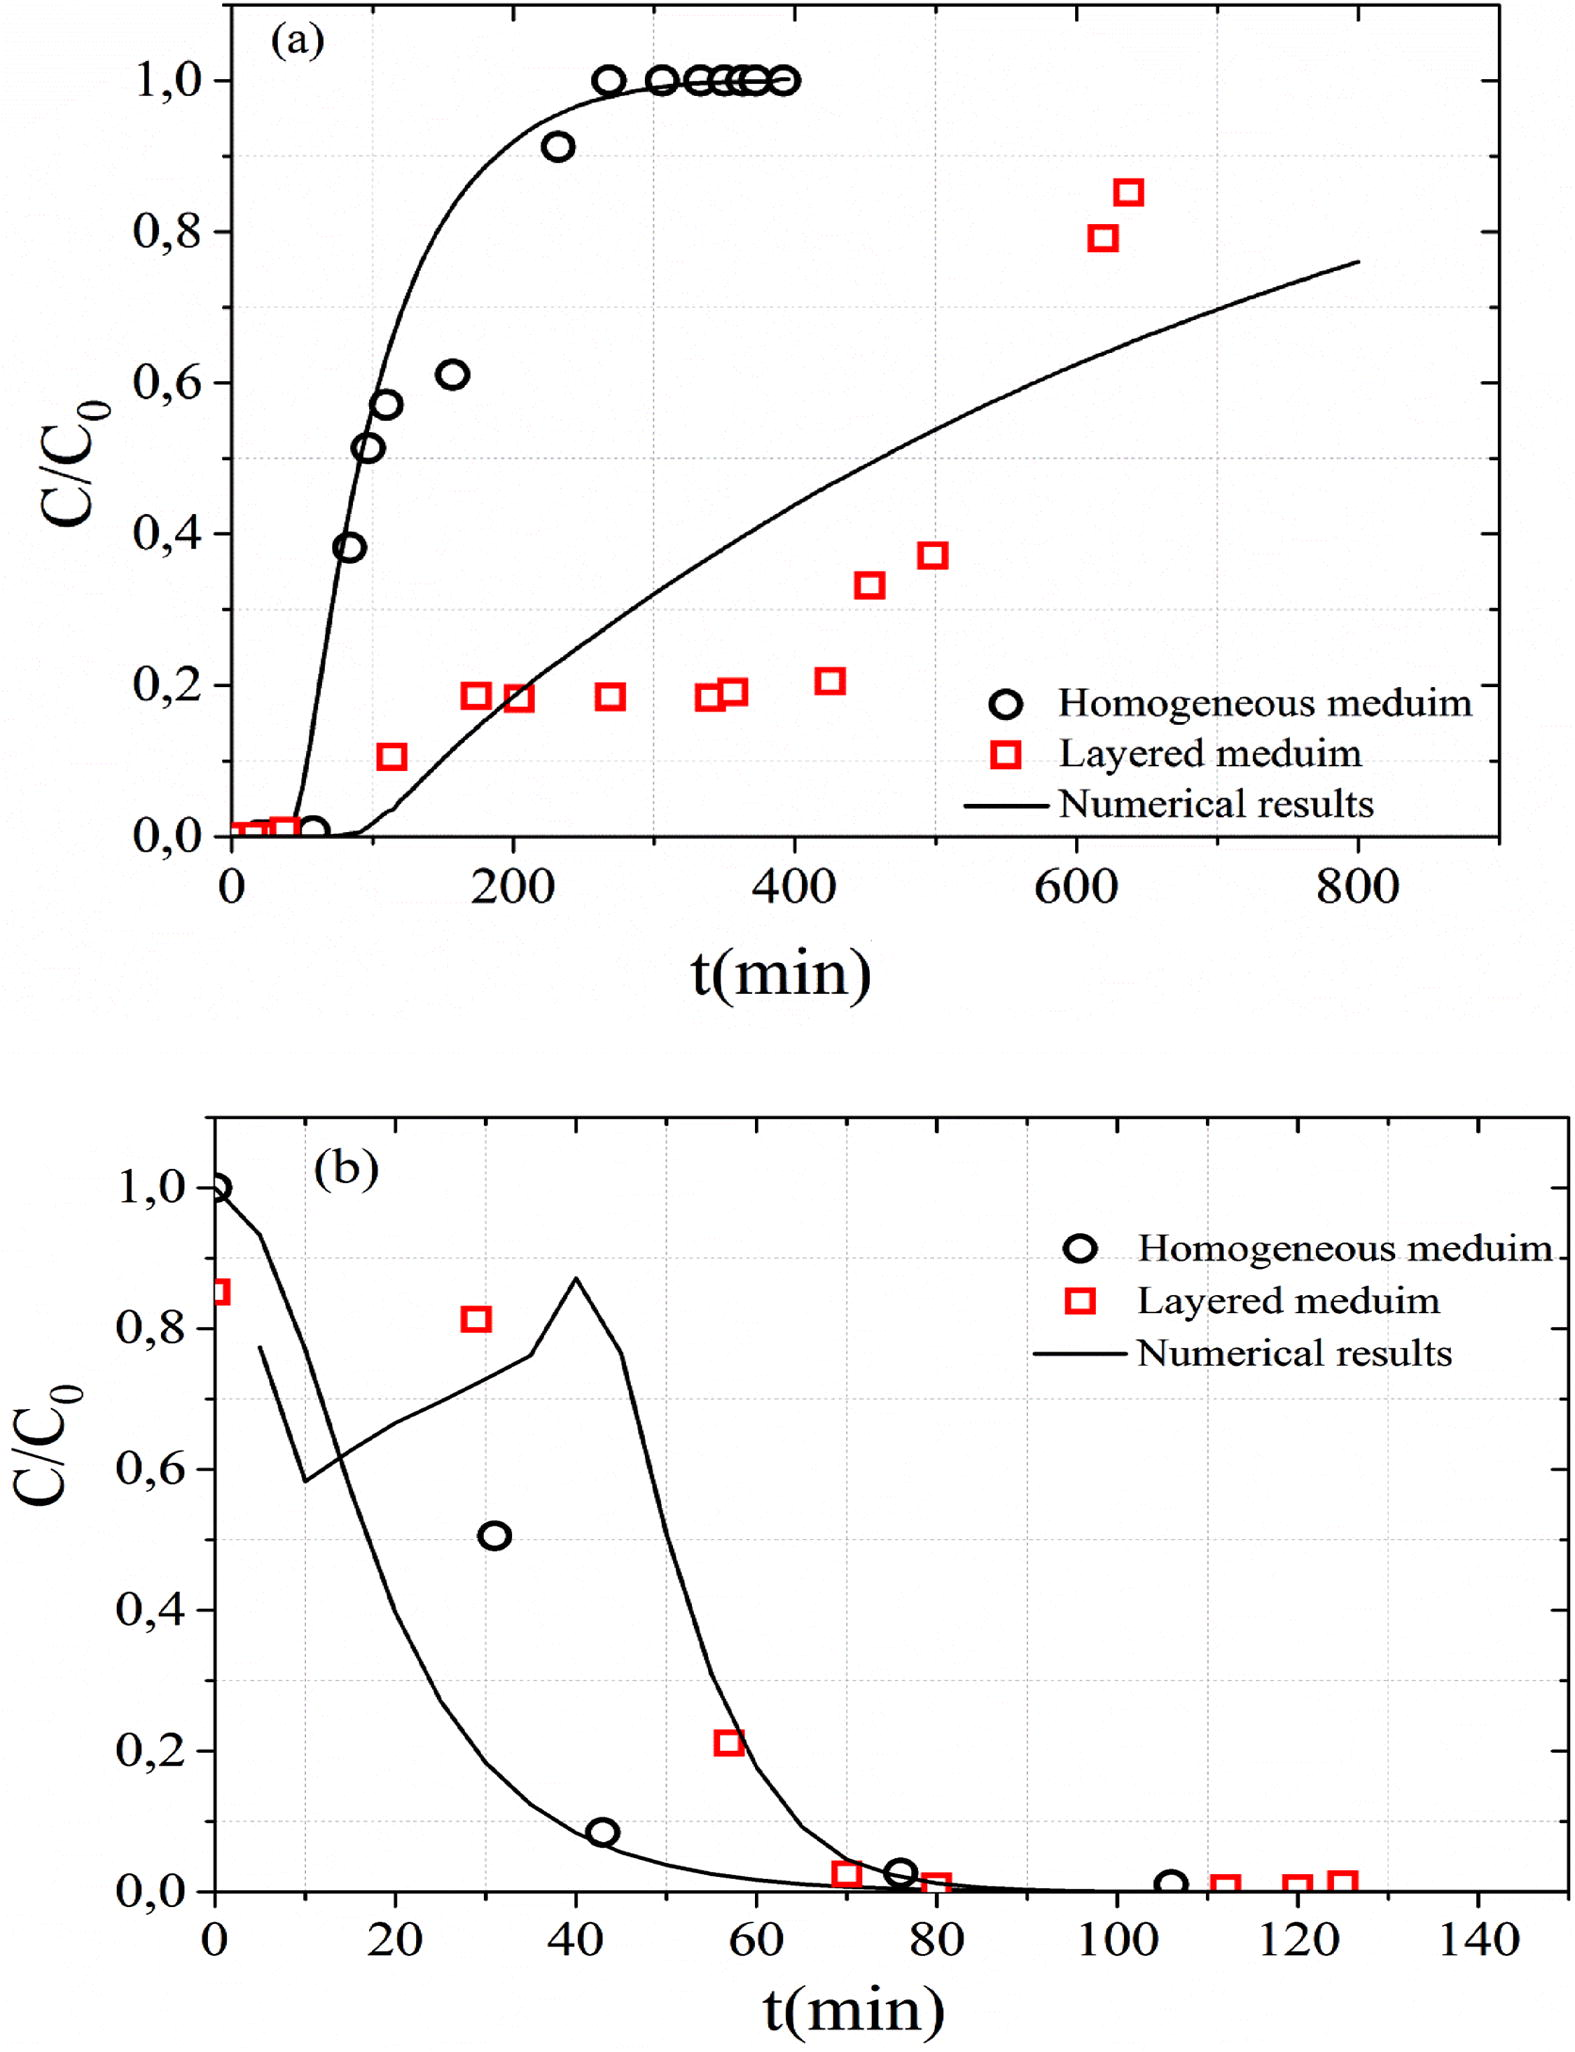
Effects of soil heterogeneity on the (a) MB adsorption and (b) MB desorption.
The peaks of the MB breakthrough curves for heterogeneous medium is of order 0.88 (C/C0 = 0.88) while that of homogeneous medium is higher (Fig. 6a). In the unsaturated heterogeneous layered medium, the hydrodynamic proprieties of the two materials caused the prevention of water and flow through the interface and forced the water accumulation at the interface until water pressure head is enough to permit it to penetrate (Li et al., 2013). The increase in water pressure head associated with water accumulation at the interface of two materials shows a capillary barrier effect. In this interface the retention is more important (Prédélus et al., 2015). After 100 min, the gradient of MB adsorbed concentration in z = 5 cm (interface between sand and clay materials) is more important compared to homogeneous medium. This increase of retention capacity in this interface results from an increase in the water content and the decrease in pore water velocity improves the MB solution entrapment (Torkzaban et al., 2008). Indeed, the decrease in pore water velocity is accompanied with a decrease in kinetic adsorption rate at the interface.
4.4 Advection–dispersion model effectiveness
The experimental MB adsorption data are fitted using the proposed models. The average error (E (%)) of used models which are reported in Table 4 were calculated using
In all experiments for the advection–dispersion model the fitting errors are lower than those of Thomas model. Consequently, it might be provided that the Thomas model can fail for breakthrough curve data correlation because this model considers an adsorption–desorption process with negligible axial dispersion (see Table 5).
Model
Error (%)
Exp A
Exp B
Exp C
Exp D
Exp E
Exp F
Exp G
Exp H
Thomas model
33.36
14.33
27.42
49.36
17.54
20.23
29.5
69.41
Advection–dispersion model
32.19
12.44
17.11
47.14
12.9
14.98
17.12
44.75
The contrast between the errors of Thomas model and those of advection dispersion model becomes huge in the unsaturated heterogeneous porous media. This confirms that the advection dispersion model makes a good reproduction of mechanisms of transfer in porous media and seems to be a useful tool to better understanding the physical processes and the effect of capillary barrier of MB transport in unsaturated heterogeneous soil (Fig. 7).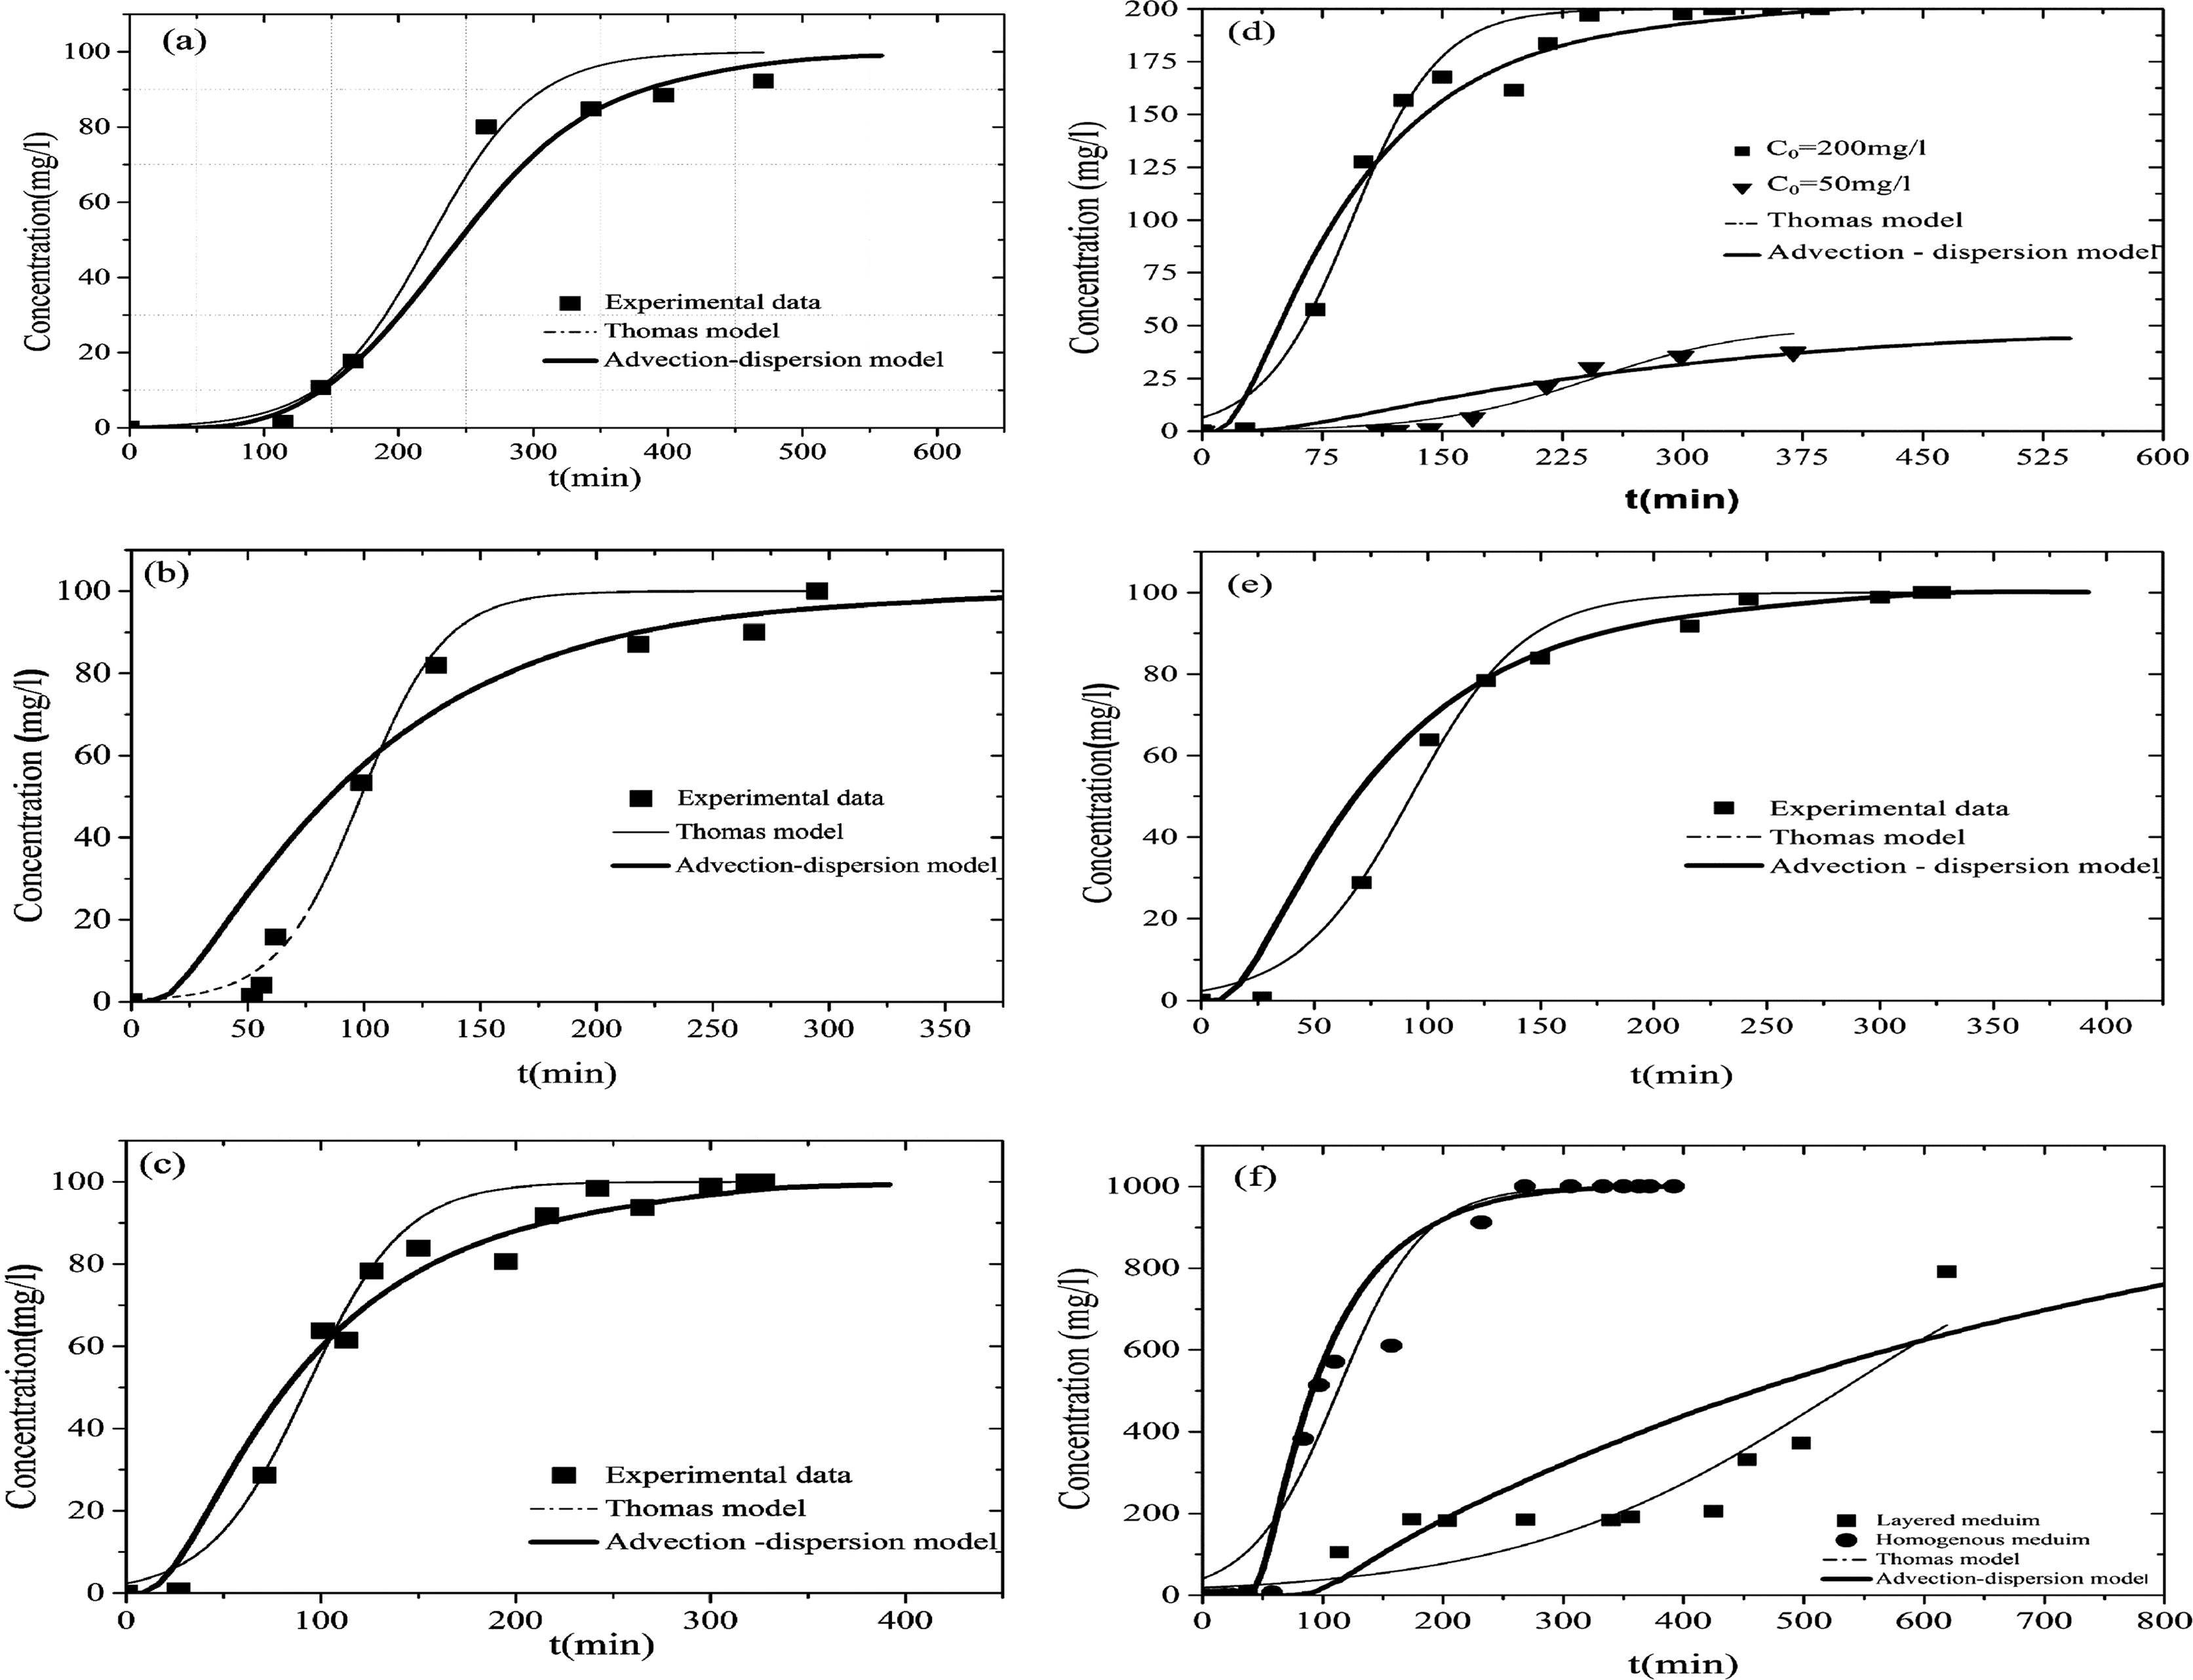
Experimental and predicted breakthrough curves for MB adsorption. (a) Exp A, (b) Exp C, (c) Exp B, (d) Exp D and Exp E, (e) Exp F and (f) Exp G and Exp H.
4.5 Desorption studies
The study of MB release from soil is important for understanding MB movement in the soil. Desorption is followed immediately after MB adsorption. Column desorption experiments were performed using rain water. The predicted relative concentration of desorption experiments were calculated using advection dispersion model. The determination coefficient of this model ranging from 0.903 to 0.99 (Fig. 8a–c) indicated that advection–dispersion model provided the best description of MB desorption behavior in soil.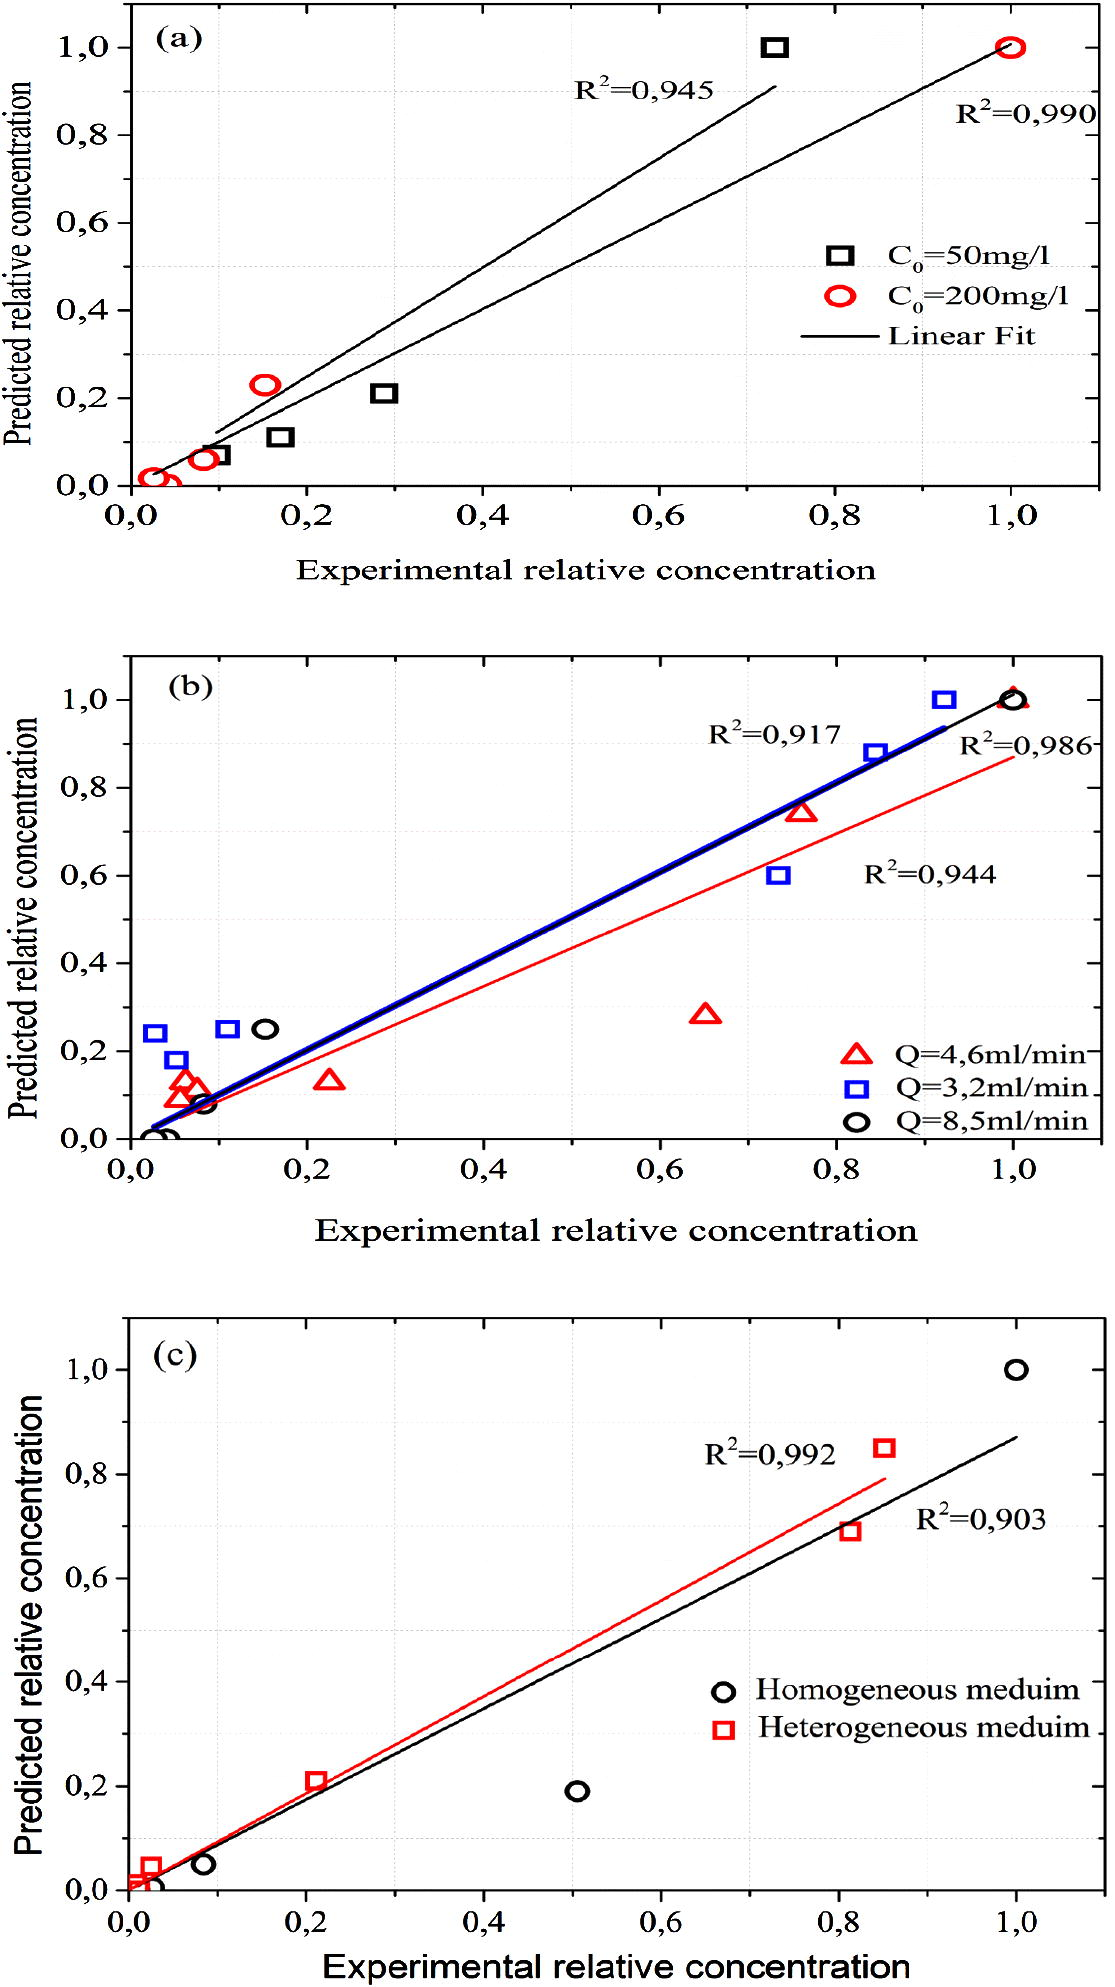
Predicted data from advection dispersion model against experimental data of MB desorption experiments at (a) different flow rate, (b) different initial concentration and (c) homogeneous and heterogeneous porous media.
5 Conclusion
From batch and fixed bed experimental data of MB adsorption and transport in soils and fixed bed column modeling, the following conclusions are taken:
-
The adsorption isotherm is described using Langmuir model for sand and Freundlich model for clay and sand/clay mixture.
-
The adsorption kinetic is described using pseudo second order model for both materials (sand and clay).
-
Experimental data revealed that the breakthrough curves depend on flow rate, MB inlet concentration, saturation condition of soil and soil heterogeneity.
-
The decrease in moisture content in porous media increases the amount of particles adsorbed onto substances, the adsorption capacity and the kinetic rate.
-
The increase in water pressure head associated with water accumulation at the interface of two materials increases the retention capacity in this interface and decreases the pore water velocity.
-
The decrease in pore water velocity is accompanied with a decrease in kinetic adsorption rate at the interface of sand and clay materials.
-
In heterogeneous medium, the equilibrium adsorption capacity (q0) of Thomas model has the higher value compared to homogeneous medium.
-
The comparative analysis between both models proves that advection–dispersion model is the suitable one to describe the adsorption and transportation of MB in saturated and unsaturated soil.
-
The comparison of the experimental breakthroughs with breakthrough simulations in desorption experiments shows that the advection–dispersion model provided the best description of MB desorption behavior in soil.
-
The methylene blue desorption in the unsaturated medium is slower than the saturated soil.
Acknowledgements
The authors would like to thank the personnel (H. Majdoub, S. Dhawadi and H. Ben Jannet; Faculty of Science, Monastir) that helped make this work a success. As well, the authors would like to thank A. Baffoun and A. Moussa for their assistance in the analysis by spectrophotometer.
References
- Chemical methods, Determination of Cation Exchange Capacity (CEC) and Cation Extraction. Paris: AFNOR; 1999.
- Chitosan–clay composite as highly effective and low-cost adsorbent for batch and fixed-bed adsorption of methylene blue. Chem. Eng. J.. 2014;237:352-361.
- [Google Scholar]
- Removal of methylene blue from aqueous solution by adsorption on sand. Dyes Pigm.. 2007;74(1):85-87.
- [Google Scholar]
- Fixed bed adsorption of methylene blue by ultrasonic surface modified chitin supported on sand. Chem. Eng. Res. Des.. 2015;100:302-310.
- [Google Scholar]
- Elovich S.J., Schulman J.H., eds. Proceedings of the Second International Congress on Surface Activity. Vol vol. 11. New York: Academic Press Inc.; 1959. p. :253.
- Preparation of activated carbon from date stones by microwave induced chemical activation: application for methylene blue adsorption. Chem. Eng. J.. 2011;170(1):338-341.
- [Google Scholar]
- Removal of methylene blue from aqueous solutions by chemically modified bamboo. Chemosphere. 2014;111:225-231.
- [Google Scholar]
- Dynamic sorption of methylene blue by cedar sawdust and crushed brick in fixed bed columns. J. Hazard. Mater.. 2006;B138:293-303.
- [Google Scholar]
- Comparison of linear and nonlinear analysis in estimating the Thomas model parameters for methylene blue adsorption onto natural zeolite in fixed-bed column. J. Hazard. Mater.. 2007;145(1):331-335.
- [Google Scholar]
- Adsorption of methylene blue by phoenix tree leaf powder in a fixed-bed column: experiments and prediction of breakthrough curves. Desalination. 2009;245(1):284-297.
- [Google Scholar]
- Pseudo second order kinetic models for safranin onto rice husk: comparison of linear and non-linear regression analysis. Process Biochem.. 2006;41(5):1198-1202.
- [Google Scholar]
- About the theory of so-called adsorption of soluble substances, K. Sven, Vetenskapsakad. Handl. Band.. 1898;24:1-39.
- [Google Scholar]
- Adsorption of gases on plain surfaces of glass mica platinum. J. Am. Chem. Soc.. 1918;40:1361-1403.
- [Google Scholar]
- Mechanism of methylene blue removal from water by swelling clays. Chem. Eng. J.. 2011;168(3):1193-1200.
- [Google Scholar]
- Numerical investigation of the performance of covers with capillary barrier effects in South China. Comput. Geotech.. 2013;48:304-315.
- [Google Scholar]
- New insights into pseudo-second order kinetic equation for adsorption. Colloids Surf. A. 2008;320:275-278.
- [Google Scholar]
- Adsorption of methylene blue by kapok fiber treated by sodium chlorite optimized with response surface methodology. Chem. Eng. J.. 2012;184:248-255.
- [Google Scholar]
- Adsorption of phenol and methylene blue from aqueous solutions by 2 pyrolytic tire char: equilibrium and kinetic studies. J. Environ. Chem. Eng.. 2015;3(1):574-582.
- [Google Scholar]
- Biosorption of methylene blue onto Arthrospira platensis biomass: kinetic, equilibrium and thermodynamic studies. J. Environ. Chem. Eng. 2015;3(2):670-680.
- [Google Scholar]
- Combined effect of capillary barrier and layered slope on water, solute and nanoparticle transfer in an unsaturated soil at lysimeter scale. J. Contam. Hydrol.. 2015;181:69-81.
- [Google Scholar]
- Adsorption of dyes from aqueous solutions onto sand and their kinetic behavior. Chem. Eng. J.. 2008;137(2):238-243.
- [Google Scholar]
- Comparative study of waste derived adsorbents for sequestering methylene blue 3 from aquatic environment. J. Environ. Chem. Eng.. 2015;3(1):395-404.
- [Google Scholar]
- Adsorption and transport of methane in landfill cover soil amended with waste-wood biochars. J. Environ. Manage.. 2015;158:11-23.
- [Google Scholar]
- Plasma-surface modification on bentonite clay to improve the performance of adsorption of methylene blue. Appl. Clay Sci.. 2015;116:46-53.
- [Google Scholar]
- Heterogeneous ion exchange in a flowing system. J. Am. Chem. Soc.. 1944;66(10):1664-1666.
- [Google Scholar]
- High mobility of SDBS dispersed single walled carbon nanotubes in saturated and unsaturated porous media. J. Hazard. Mater.. 2011;186(2–3):1766-1772.
- [Google Scholar]
- Colloid transport in unsaturated porous media: the role of water content and ionic strength on particle straining. J. Contam. Hydrol.. 2008;96(1):113-127.
- [Google Scholar]
- Adsorption of methylene blue from aqueous solution by jackfruit (Artocarpus heteropyllus) leaf powder: a fixed-bed column study. J. Environ. Manage.. 2009;90(11):3443-3450.
- [Google Scholar]
- A Closed-form equation for predicting the hydraulic conductivity of unsaturated soils. Soil Sci. Soc. Am. J.. 1980;44(5):892-898.
- [Google Scholar]
- Physical and chemical regeneration of zeolitic adsorbents for dye removal in wastewater treatment. Chemosphere. 2006;65(1):82-87.
- [Google Scholar]
- Efficient adsorption of methylene blue on an alginate-based nanocomposite hydrogel enhanced by organo-illite/smectite clay. Chem. Eng. J.. 2013;228:132-139.
- [Google Scholar]
- Kinetic studies of dyes sorption from aqueous solutions onto the strongly basic anion-exchanger Lewatit MonoPlus M-600. Chem. Eng. J.. 2009;150(2):509-515.
- [Google Scholar]
- Characterization of the heterogeneous flow and pollutant transfer in the unsaturated zone in the fluvio-glacial deposit. Procedia Environ. Sci.. 2013;19:955-964.
- [Google Scholar]
- Enhanced sorption of methylene blue by EDTAD modified sugarcane bagasse and photocatalytic regeneration of the sorbent. Desalination. 2010;259(1):187-191.
- [Google Scholar]
- Preparation of activated carbons from walnut shells via vacuum chemical activation and their application for methylene blue removal. Chem. Eng. J.. 2010;165:209-217.
- [Google Scholar]
- Removal of methylene blue from aqueous solutions by straw based adsorbent in a fixed-bed column. Chem. Eng. J.. 2011;173:429-436.
- [Google Scholar]


