

Translate this page into:
Chemical fingerprinting of three Anemone species and an adulteration study to detect cross mixing of medicinal plants by HPLC-HR-ESI-MS/MS method
⁎Corresponding authors at: Pharmacognosy Group, Department of Pharmaceutical Biosciences, BMC, Uppsala University, SE-751 23 Uppsala, Sweden (Hesham R. El-Seedi). H.E.J. Research Institute of Chemistry, International Center for Chemical and Biological Sciences, University of Karachi, Karachi 75270, Pakistan (Syed Ghulam Musharraf). hesham.el-seedi@farmbio.uu.se (Hesham R. El-Seedi), musharraf@iccs.edu (Syed Ghulam Musharraf)
-
Received: ,
Accepted: ,
This article was originally published by Elsevier and was migrated to Scientific Scholar after the change of Publisher.
Peer review under responsibility of King Saud University.
Abstract
The adulteration of plant raw materials used for the preparation of herbal drugs with foreign plant material is one of the important issues in the quality control of herbal products. Chemical fingerprinting is a well-known approach for the characterization of secondary metabolites associated with the plant species and can be used for quality control of plant material. The current study centred on the development of chemical fingerprinting of three medicinal plants of genus Anemone including A. obtusiloba, A. falconeri and A tetrasepala through identification of their metabolites using LC-ESI-QTOF-MS/MS analysis. Thirty compounds were identified by using high-resolution positive and negative electrospray- ionization (ESI) modes and MS/MS analysis. The identified compounds belong to diterpenoids, alkaloids, phenols, flavonoids and other classes and their distribution among the analysed species was studied using different statistical tools. Moreover, an LC-HR-ESI-MS/MS method was developed to detect the cross mixing of A. obtusiloba with Ziziphus jujuba. Seven chromatographically differentiative peaks confined to A. obtusiloba were selected to detect its contamination in adulterated samples. The method was able to detect as low as 20% mixing of A. obtusiloba in Z. jujuba. This study can play a significant role to manage the quality control of herbal medicines and to identify lead natural products of these plants.
Keywords
Anemone obtusiloba
Anemone falconeri
Anemone tetrasepala
Ziziphus jujube
LC-ESI-MS/MS

1 Introduction
Plants have been a rich source of therapeutics since early times. These herbal medicines have once again attracted interest of people and are widely consumed by a large portion of population not only in developing countries but also in the developed ones. The main reasons behind re-emerging popularity of herbal medicines are lack of new and effective drugs to counter emerging diseases such as drug-resistant infections, and the increased cost and side effects of pharmaceuticals. Herbal products are not always as safe to use as they are considered. These medicines are usually prepared from crude extract of a plant or a mixture of plants as polyherbal formulation, in both cases the product is a combination of thousands of chemical compounds. Due to the presence of such enormous number of compounds, the quality control of these medicines is quite difficult. Despite the traditional back-ground and present significance of herbal medicines, many countries have still not recognised these medicines due to their authenticity, safety and lack of quality control (Liang et al., 2004).
The raw herbal material acquired by herbal processing units is mostly in its dried form, which is almost impossible to identify physically, so there is an escalating risk of adulteration of other plant material. The adulteration can be intentional or unintentional mixing of other plant having different medicinal properties than the desired one or simply no medicinal values (Zhang et al., 2012). The presence of such undesired plant material not only affects the efficacy of these medicines but can also cause serious harm or mistreatment of diseases. World Health Organisation (WHO) also highlighted the presence of adulterants as the possible risk associated to traditional herbal drugs and insisted for its prevention (Qi, 2013; Organization, 2000).
To overcome the problem, reliable quality control protocols should be followed during production of these formulations. Extensive chemical profiles serve as the fingerprint for any plant material and thus can be used for quality control purpose. For the generation of these chemical profiles, chromatographic separation along with mass spectrometric detection is a reliable and high-throughput technique. High-resolution LC-ESI-MS/MS approach is one of the most useful tools for the detection and identification of metabolites without their prior isolation and purification (Schymanski et al., 2014).
Genus Anemone of family Ranunculaceae is known for its medicinal species. This genus is comprised of more than 150 plant species. Among them, more than 50 species have been used for the treatment of various diseases (Hao et al., 2017). In the Chinese medicine, 38 species of Anemone are reported to be used for the treatment of malaria, parasitic diseases, tinea, ulcers, sore, arthritis, and traumatic injuries (Xiao et al., 1989). These species are mostly widespread in mountainous regions of Pakistan, Tibet, Nepal and Burma. The genus Anemone is rich in low molecular weight compounds such as triterpenoids, saponins, steroids, fats and oils, saccharides, alkaloids, coumarins, flavonoids, lactones, lignans, phenolic compounds, and other compounds (Zou et al., 2004; Lu et al., 2001; Cao et al., 2004). Many compounds isolated from various Anemone species show interesting biological activities such as antimalarial, anti-convulsant, anti-histamine, anthelmintic, anti-inflammatory, antimicrobial, anticancer and antioxidant activities (HAO et al., 2015; Da et al., 2015; Lee et al., 2008).
Anemone obtusiloba grows as weed with many other crops. This plant is reported to be used in Unani and other medicine systems for its numerous biological activities such as antirheumatic, antispasmodic, antimicrobial, antifungal, antiviral, antipyretic, sedative, anti-inflammatory, nervine and diuretic effects (Quattrocchi, 2016). Anemone falconeri is used for fever, cold, pain and gastritis (Kaul, 1997) while Anemone tetrasepala is used in Tibetan medicines to treat stomach worms, bronchitis, gonorrhoea, cold tumour and as sedative (Hao et al., 2017).
In the present study, chemical profiles of three medicinal plant species of genus Anemone were developed using high-resolution LC-ESI-QTOF-MS/MS analysis. On the other hand, adulteration studies were performed to develop a method to detect cross mixing/adulteration of A. obtusiloba with Ziziphus jujuba. Z. jujuba is used in many herbal and polyherbal formulations for the cure of different bronchial and chest problems (Mirakilova et al., 2016).
2 Experimental
2.1 Sample collection
Plant material of A. obtusiloba (AO) and A. falconeri (AF) were collected from Neelum Valley, Azad Kashmir, A. tetrasepala (AT) from Hazara valley, while Z. jujuba (ZJ) was collected from Swat valley, Pakistan. Botanical authentication and identification of all the samples were done by taxonomist Mr. Shabbir Aijaz and a voucher specimen was deposited for each plant species at Herbarium, University of Karachi, Pakistan. The voucher numbers for A. obtusiloba, A. falconeri and A. tetrasepala were GH-95587, GH-95588 and GH-95589, respectively.
2.2 Chemicals and reagents
Chemicals used for LC-ESI-MS analysis were acquired from different sources. Formic acid was used as an additive for mobile phase and purchased from Daejung (Daejung Chemicals & Metals Co. Ltd., Korea). Analytical grade methanol for mobile phase and sample preparation was acquired from Merck (Merck KGaA, Germany). Type I water for chromatography was purified using Ultrapure Water Purification assembly (Barnstead™ GenPure™, USA). All sample solutions were filtered through 0.22 µm PTFE membrane before analysis.
2.3 Preparation of plant samples for LC-MS analysis
Shadow-dried whole plant materials were ground into powder form and one gram of each was accurately weighed and extracted with 10 mL methanol through sonication for 20 min at room temperature. These samples were then centrifuged at 6000 rpm for 30 min and the supernatant was filtered using 0.22 μm PTFE syringe-driven filter. 50 μL of each sample was diluted to 1000 μL with HPLC grade methanol for LC-MS analysis.
For adulteration, A. obtusiloba was mixed with another medicinal plant Ziziphus jujuba in different percentages with total weight of 10 g. In total, nine samples were homogenized with 1%, 2%, 5%, 10%, 20%, 30%, 40%, 50%, and 60% by weight of A. obtusiloba. One gram of each sample was accurately weighed and extracted with 10 mL methanol. The remaining sample preparation method was same for LC-MS analysis.
2.4 LC-MS/MS analysis
HPLC-MS/MS analysis for natural product identification was performed on Bruker maXis HR-QTOF mass spectrometer (Bremen, Germany) coupled to Dionex UltiMate 3000 series HPLC system (Thermo Fisher Scientific, Waltham, MA, USA) fitted with a binary RS pump, column thermostat and auto-sampler. Sample chromatography was performed on Macherey-Nagel Nucleodur C18 Gravity column (3.0 × 100 mm, 1.8 μm) which was kept at 40 °C. 4 μL sample was injected while mobile phase consisted of A (0.1% formic acid in water) and B (0.1% formic acid in methanol) with a constant flow rate of 0.7 mL/min. Chromatography was optimized using HPLC-DAD prior to LC-MS analysis. The mobile phase gradient was started at 10% B, increased to 90% B in 5.5 min, maintained for 1.5 min, and then returned to 10% B in 1 min. Total run time was 10 min including the equilibration (1mineach) at the start and end of the gradient. Mass spectra were recorded using electrospray ionization, employing the Bruker CaptiveSpray ion source. MS and MS/MS spectra were recorded separately both in positive and negative ionization modes to confirm that all types of compounds can be ionized, detected, and identified. Ion source parameters used are: capillary voltage for positive mode kept at 4500 V while −3500 V for negative mode, end plate offset at 500 V, nebulizer gas pressure at 45.0 psi, drying gas at 12.0 L/min flow rate and 270 °C temperature. All spectra were recorded in the mass range from 100 to 2000 m/z while the scan speed was set at 5 Hz for MS while 12 Hz for MS/MS spectra to make sure that maximum possible data could be recorded in a single HPLC-MS/MS run.
As many natural products tends to be abundant and may suppress the low abundant natural products, therefore it was necessary to make sure that compounds present in low abundance are not left without MS/MS. To resolve this issue, active exclusion feature of the instrument was used which removes repeated precursor ions from consideration after the set number of spectral averages have been achieved. To ensure mass accuracy, sodium formate (10 mM in 1:1 water:2-propanol) was used at the start of each LC-MS/MS analysis. MS and MS/MS files were presented using two efficient tools: Bruker Compass Data Analysis (ver. 4.4 SR1, 64-bit) and Bruker Compass Target Analysis (ver. 1.3). The spectral background subtraction algorithm was built using Data Analysis to remove noise from obtained data.
2.5 Identification of compounds and chemometric analysis
The profiling of Anemone species was performed through an untargeted metabolomics workflow. A custom-made database of reported phytochemicals from these species is developed after an extensive search using the Dictionary of Natural Products (DNP ver. 26.2) and other literature sources. On the other hand, different available ESI-MS/MS libraries were incorporated in NIST MS search. These libraries include, NIST MS/MS library, Mass bank of North America and Mass Bank of Europe. The compounds were identified by comparing high resolution masses, isotopic pattern and MS/MS fragmentation with libraries and databases. The tolerance levels were set at 5 ppm for exact masses and 50 mSigma value for isotopic pattern. Chemometric studies were done to visualise the distribution of identified compounds by generating heatmap clusters using software Perseus (ver: 1.6.2.1).
3 Results and discussion
3.1 LC-ESI-MS/MS analysis and identification of compounds
The overall workflow which is used in this study is summarized in Fig. 1. The base peak chromatograms (BPCs) of all the plant extracts were quite clear with well separated peaks. Fig. 2 shows the BPCs in positive and negative ion modes of all analysed species along with the numbers of identified compounds marked on each peak. Before data analysis, each mass spectrum was recalibrated by internal calibration using high-precision calibration (HPC) mode. A total of thirty compounds were identified in three anemone species. Twenty-seven compounds were identified using positive ionization mode of MS, twelve were identified in negative ionization mode while nine were appeared common in both modes. The identified compounds belong to triterpenoid, steroid, alkaloid, coumarin, carboxylic acid and flavonoid classes of compounds. Among the identified compounds, twenty-six were present in A. obtusiloba, twenty-five were present in A. tetrasepala while sixteen were present in A. falconeri. During the MS and MS/MS study it was noted that the most compounds were observed as protonated and deprotonated molecules under the positive and negative ionization modes, respectively (Table 1). Supplementary Fig. 1 compares the Base Peak Chromatograms from three species in positive and negative modes of ionization. a = identified in Anemone obtusiloba, b = identified in Anemone tetrasepala, c = identified in Anemone falconeri.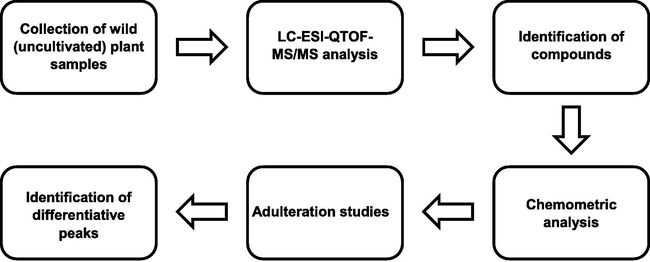
The overall workflow used in the study.
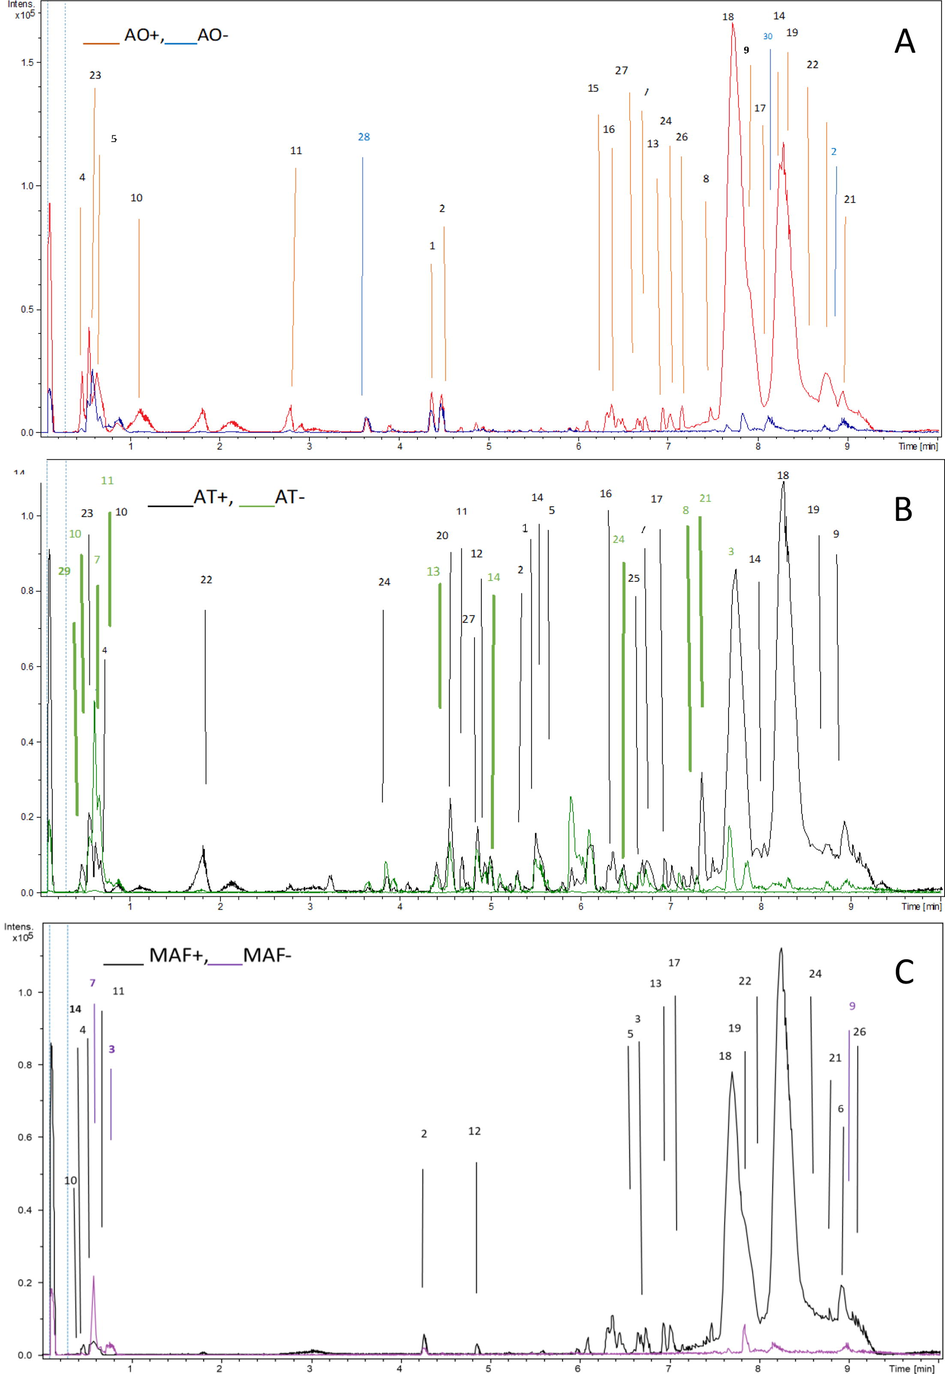
Base peak chromatograms (BPC) of AO (A), AT (B) and MAF (C) in positive and negative modes of ionization with peaks numbered with identified compounds.
S. No.
Compound Name
Formula
Exact Mass
Ion type
RT min
Observed m/z
Calculated m/z
Error ppm
Fragments m/z(% rel. abund.)
1
Cyanidin dihexoside a,b
C27H30O16
610.1533
[M + H]+
4.3
611.1608
611.1607
−0.16
449.1079(4.9)
2
Kaempferol hexosidea,b
C21H20O11
448.1005
[M + H]+
4.2
449.1079
449.1078
−0.22
287.0551(21.3), 288.0586 (20.1), 289.0611(18.1)
3
Mannobiose b
C12H22O11
342.1162
[M + H]+
0.6
343.1315
343.1311
1.16
341.1100(9.7)
[M−H]-
0.6
341.1091
341.1090
−1.10
179.0500(8.8)
4
Aminobenzoic acid a,b,c
C7H7N1O2
137.0480
[M + H]+
0.6
138.0550
138.0551
−0.72
120.0041(32.7)
5
Hydroxycoumarin a,b
C9H6O3
162.0316
[M + H]+
3.3
163.0391
163.0390
−0.61
163.0462(84)
6
Palmitic acid a,b,c
C16H32O2
256.2402
[M + H]+
8.0
257.2477
257.2475
−0.77
211.2426(17.2), 239.2375(9.1).
[M−H]-
9.0
255.3000
255.3003
−1.10
210.2426(20.2)
7
Caffeic acid a,b,c
C9H8O4
180.0422
[M + H]+
5.1
181.0501
181.0503
1.10
145.0278(31.9), 163.0381(12.7)
[M−H]-
0.6
179.0345
179.0348
1.67
134.0447(23.8)
8
Dihydroxyolean-enoic acid a,b
C30H48O4
472.3552
[M + H]+
7.3
473.3625
473.3630
−1.00
495.3445(37.1)
[M−H]-
4.5
471.3459
471.3455
0.80
355.6095(37.3), 370.2920(46)
9
Vinpocetine a,b
C22H26N2O2
350.1994
[M + H]+
9.1
351.2066
351.2067
0.28
294.1363(63.2)
10
Adenosine a,b,c
C10H13N5O4
267.0967
[M + H]+
0.6
268.1041
268.1040
−0.37
136.0620(45.7)
11
Tryptophan a,b,c
C11H12N2O2
204.0898
[M + H]+
2.8
205.0971
205.0972
0.48
146.0599(12.7), 159.0917(15.6), 170.0603(32.6), 188.0706y.
[M−H]-
0.5
203.0819
203.0819
0.00
Not found
12
Chlorogenic acid a,b,c
C16H18O9
354.0950
[M + H]+
3.6
355.1025
355.1024
0.28
163.0300(87.6), 337.0892(11.4)
13
Hydroxymethoxy cinnamic acid a,b,c
C10H10O4
194.0579
[M + H]+
3.8
195.0651
195.0652
0.51
177.0549(58.5)
[M−H]-
4.2
193.0506
193.0508
−1.03
134.0360(26.2),178.0260(15.0)
14
Quercetin hexoside a,b,c
C21H20O12
464.0955
[M + H]+
4.2
465.1027
465.1028
0.21
85.0285(41.2), 97.0801(20.2), 303.0489(19.2)
[M−H]-
3.1
463.0882
463.0882
0.00
300.0285(21.2), 301.0353(8.6)
15
Peonidin hexoside cation a
C22H23O11
463.1240
[M + H]+
5.3
463.1236
463.1235
−0.21
286.0496(7.6), 301.0718(19.0).
16
Triphenylphosphine oxide a,b,c
C18H15OP
278.0860
[M + H]+
6.6
279.0934
279.0933
−0.35
201.0462(31.2)
17
Triallyloxy triazine a,b,c
C12H15N3O3
249.1113
[M + H]+
6.5
250.1187
250.1186
−0.39
Not found
18
Glycerol stearate a,b,c
C21H42O4
358.3083
[M + H]+
7.7
359.3156
359.3156
0.00
267.2679(25.5), 285.2793(11.1), 341.3048(14.6).
19
Docosenamide a,b,c
C22H43NO
337.3344
[M + H]+
8.7
338.3417
338.3417
0.00
149.1332(23.7), 156.1384(12.6), 163.1487(7.5), 177.1630(6.6), 226.2138(2.8), 268.2635(10.2), 321.3162(0.9).
20
Hydroxymethoxy coumarin b
C10H8O4
192.0422
[M + H]+
4.5
193.0495
193.0496
0.50
176.0473(14.3)
21
Hydroxycoumarin hexoside a,b,c
C15H16O9
340.0794
[M + H]+
0.6
341.0867
341.0868
0.29
179.0348(17.0), 341.1804(12.7).
[M−H]-
2.0
339.0716
339.0716
0.00
133.0304(34.0), 177.0194(18.8)
22
Candenatenin D a,b,c
C16H20O3
260.1410
[M + H]+
8.3
261.1484
261.1485
0.50
Not found
23
Acetylneuraminic acid a
C11H19NO9
309.1059
[M + H]+
0.6
310.1133
310.1133
0.00
274.0922(10.4), 292.1030(17.5).
24
Geniposidic acid a,b,c
C16H22O10
374.1212
[M + H]+
3.8
375.1263
375.1263
0.00
217.0476(20.9), 185.0424(7.1).
[M−H]-
3.0
373.1178
373.1176
0.50
Not found
25
Methylprostaglandin b
C21H36O5
368.2557
[M + H]+
6.7
369.2635
369.2635
5.00
367.2503(10.4).
26
Octadecatrienoic acid a,c
C18H30O2
278.2250
[M + H]+
7.9
279.2319
279.2319
0.00
261.2218(52.5).
27
Anemonin a,b
C10H8O4
192.0422
[M + H]+
4.1
193.0495
193.0495
0.00
Not found
28
Heptadecanoic acid a
C17H34O2
270.2560
[M−H]-
3.9
269.2493
269.2491
0.70
251.2378(21.4), 271.2540(18.2)
29
Cuminoid E b
C24H26O10
474.1520
[M−H]-
0.7
473.145
473.1453
0.60
373.1651(40.3), 355.1545(19.6)
30
Stearic acid a
C18H36O2
284.2720
[M−H]-
8.0
283.2654
283.2654
0.00
267.2688(27.0), 285.2794(13.4).
3.2 Heatmap cluster analysis
Perseus (ver: 1.6.2.1) was used to generate heatmap clusters based on log2(X) transformed peak areas of all the identified compounds in Anemone spp. in both positive and negative modes of ionization. Difference in metabolite distribution can be visualized in cluster analysis of all three species. Compounds, hydroxycoumarin hexoside, docosenamide, aminobenzoic acid, hydroxycoumarin, triallyloxy triazine, quercetin hexoside, triphenylphosphine oxide, chlorogenic acid, gycerol stearate, caffeic acid, adenosine, tryptophan, hydroxy methoxy cinnamic acid and palmitic acid were found common in samples of all three species. Hydroxycoumarin hexoside and glycerol stearate were the two most abundant compounds with high peak area in all the samples. Species A. obtusiloba and A. tetrasepala are physically similar but have shown different chemical profiles. Compounds 15, 23, 28 and 30 were only present in A. obtusiloba while compounds 03, 20, 25 and 29 were specifically found in A. tetrasepala. These differentiative compounds can be used as their distinguishing character. Heatmap clusters of identified compounds through positive and negative modes of ionization is given in Figs. 3 and 4, respectively.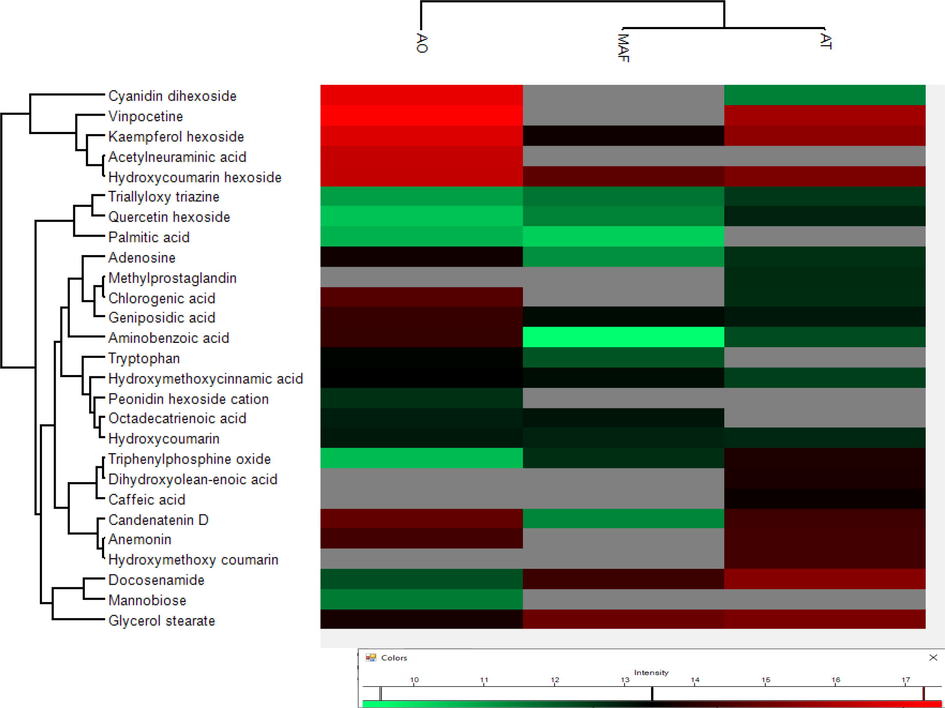
Heat map cluster analysis of identified compounds in positive mode.
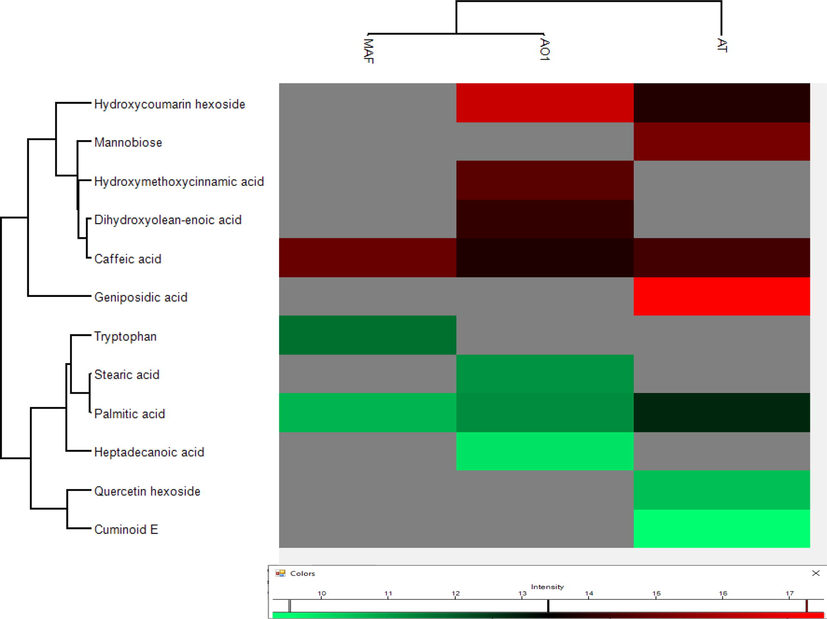
Heat map cluster analysis of identified compounds in negative mode.
3.3 Adulteration studies by using LC-ESI-QTOF-MS/MS
Adulteration study was conducted by taking two medicinal plants, A. obtusiloba and Z. jujuba. These two plants found proximately together and well distributed in Northern regions of Pakistan, so have a huge chance of mixing together. Profiles of A. obtusiloba and Z. jujuba were generated using LC-ESI-QTOF MS/MS analysis and chromatograms were compared in Supplementary Fig. 2. Seven peaks A, B, C, D, E, F, H and G having retention times 0.7, 1.1, 1.3, 1.9, 4.3, 8.1 and 8.5 min, respectively, were taken as distinguishing character of A. obtusiloba (Fig. 5). These peaks were absent in profile of Z. jujuba and were thus used to detect the presence of A. obtusiloba as adulterant. One of the peaks was identified as compound, cyanidin dihexoside (E), while rest were unidentified compounds. Samples with different percentages (w/w) of A. obtusiloba mixed in Z. jujuba were analysed and peak areas of selected marker peaks were checked (Fig. 6). All the samples showed significantly intense peaks up to limit of 20% mixing while in samples with less ratio of mixing, peak intensities were not much clear. It was deduced that the developed method was able to detect as low as 20% adulteration of A. obtusiloba in Z. jujuba. A detailed chemical fingerprinting of Z. jujuba has already been reported (Khan et al., 2020).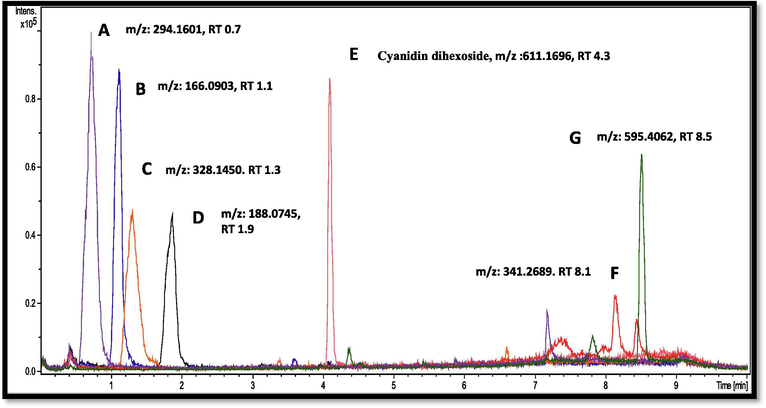
Extracted ion chromatogram (EIC) of selected peaks from Anemone obtusiloba.
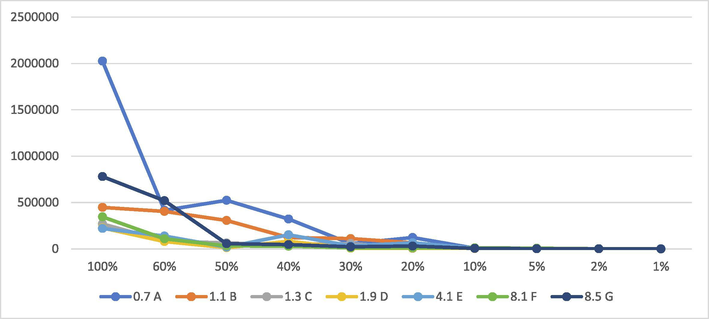
Areas of differentiative peaks with different ratios of A. obtusiloba mixed in Z. jujuba.
4 Conclusion
The present work is focused on the development of a method for the identification of natural products in three Anemone species. A total of thirty compounds belonging to various classes of natural products were identified using LC-ESI-MS/MS approach. A sensitive and simple method was designed to identify the adulteration of A. obtusiloba (grows as weed) with Ziziphus jujuba. The method was able to detect as low as 20% mixing of A. obtusiloba in medicinal plant using seven distinguishing peaks.
5 Future prospects
This work will help to develop quality control procedures for prevention of accidental adulteration of A. obtusiloba in Ziziphus jujuba. The developed chemical profiles of three species will also be useful in natural product study, drug discovery, plant taxonomy and targeted isolation of bioactive metabolites.
Acknowledgements
The authors acknowledge the support of Organization for the Prohibition of Chemical Weapons (OPCW) for research funding under project number L/ICA/ICB/210500/17. The authors also like to acknowledge Mr. Arsalan Tahir and Mr. Junaid Ul Haq for their technical assistance in UHPLC-MS/MS analysis and Mr. Shabir Ijaz for plants collection.
Declaration of Competing Interest
The authors declare that they have no known competing financial interests or personal relationships that could have appeared to influence the work reported in this paper.
References
- Quality of herbal medicines: challenges and solutions. Complementary therapies in medicine.. 2012;20(1-2):100-106.
- [Google Scholar]
- Who traditional medicine strategy 2014–2023. Geneva: World Health Organization; 2013.
- General guidelines for methodologies on research and evaluation of traditional medicine. World Health Organization; 2000.
- Identifying small molecules via high resolution mass spectrometry: communicating confidence. ACS Publications. 2014;48(4):2097-2098.
- [Google Scholar]
- Chemical Compositions of Fruit and Dry Aqueous Extract of Ziziphus jujuba. Chem. Nat. Compd.. 2016;52(3):472-474.
- [Google Scholar]
- Anemone medicinal plants: ethnopharmacology, phytochemistry and biology. Acta pharmaceutica sinica B.. 2017;7(2):146-158.
- [Google Scholar]
- Statistical analysis of ethnopharmacologic data based on Chinese medicinal plants using a computer (II) Hamamelidae and Caryophyllidae. Zhong xi yi jie he za zhi= Chinese journal of modern developments in traditional medicine.. 1989;9(7)
- Chemical constituents and pharmacological activities of genus Anemone. CHINESE PHARMACEUTICAL JOURNAL-BEIJING-.. 2004;39(7):493-495.
- [Google Scholar]
- Effect of six compounds isolated from rhizome of Anemone raddeana on the superoxide generation in human neutrophil. Biochem. Biophys. Res. Commun.. 2001;280(3):918-922.
- [Google Scholar]
- Advances in the studies on the chemical constituents and biologic activities for Anemone species. Natural Product Research and Development.. 2004;16(6)
- [Google Scholar]
- Mining chemodiversity from biodiversity: pharmacophylogeny of medicinal plants of Ranunculaceae. Chinese journal of natural medicines.. 2015;13(7):507-520.
- [Google Scholar]
- Medicinal plants: Chemistry, biology and omics. Woodhead Publishing; 2015.
- Anemonin, from Clematis crassifolia, potent and selective inducible nitric oxide synthase inhibitor. J. Ethnopharmacol.. 2008;116(3):518-527.
- [Google Scholar]
- Quattrocchi U. CRC World Dictionary of Medicinal and Poisonous Plants: Common Names, Scientific Names, Eponyms, Synonyms, and Etymology (5 Volume Set): CRC Press; 2016.
- Medicinal Plants of Kashmir and Ladakh: Temperate and Cold Arid Himalaya. Indus Publishing Company 1997
- [Google Scholar]
- Metabolite distribution and correlation studies of Ziziphus jujuba and Ziziphus nummularia using LC-ESI-MS/MS. J. Pharm. Biomed. Anal.. 2020;178:112918.
- [CrossRef] [Google Scholar]
Appendix A
Supplementary data
Supplementary data to this article can be found online at https://doi.org/10.1016/j.jksus.2021.101461.
Appendix A
Supplementary data
The following are the Supplementary data to this article:


