

Translate this page into:
Characterization and discrimination of Indian propolis based on physico-chemical, techno-functional, thermal and textural properties: A multivariate approach
⁎Corresponding authors. vikasnanda@sliet.ac.in (Vikas Nanda), mjavedansari@gmail.com (Mohammad Javed Ansari), rahulmedcure@gmail.com (Rahul Datta)
-
Received: ,
Accepted: ,
This article was originally published by Elsevier and was migrated to Scientific Scholar after the change of Publisher.
Peer review under responsibility of King Saud University.
Abstract
Objective
The present study assessed physico-chemical, techno-functional, thermal and textural characteristics of propolis samples (n = 30) collected from four Northern zones of India.
Methods
The propolis samples were analyzed according to the Association of Official Analytical Chemists (AOAC) official protocols for their ash, moisture, and protein content. Soxtech, Fiber tech, Hunter LAB Colorimeter, TA.XT2i Texture Analyzer, Thermo gravimetric Analyzer, Discovery DSC 25 have been used to assess the crude fat, fibre content, colour, texture and thermal properties, respectively.
Results and conclusions
Physico-chemical properties of propolis differed significantly (p < 0.05) and reportedthe highest balsam content (47.66%), protein (9.41%) and wax content (22.9%) in Punjab propolis (PP) where as the moisture content and water activity ranged from 4.89 to 7.37% and 0.73–0.81, respectively in propolis samples. Regarding techno-functional properties, PP had highest oil holding capacity (1.09–1.90 g/g), foaming capacity (11.08–17.03%), foam stability (67.3–75.43%), emulsifying activity (4.18–7.62%), and emulsion stability (3.24–4.77%). The positive a* and b* values of colour in this investigation indicated that the samples from all four zones lied in reddish yellowish areas of LAB colour space and relatively dull or gray as indicated by chroma values. Results of texture profile analysis demonstrated that all propolis samples were hard, cohesive, chewy and showed resilience. Differential scanning calorimetry predicted semi-crystalline behaviours of all samples. Three principal components, accounting for 98.95% variation were abstracted from fourteen physiochemical, seven techno-functional, seven textural and four thermal variables. Further, hierarchical cluster analysis successfully classified the propolis samples into four zones.
Keywords
Propolis
Physico-chemical and techno-functional properties
Textural profile analysis
DSC
PCA

1 Introduction
Propolis is an intricate natural resin mix of honeybees derived from substances extracted from fruit, bud and exudate compounds (Cornara et al., 2017). It has a distinctive and appealing aroma and taste and its colour differs from yellow green to red to dark brown depending on the source (Anjum et al., 2019). The constituents as well as various properties of propolis are significantly influenced by geographical location, climatic zones, flora, strength of bee colony and production season which gives diversity and uniqueness to propolis of each country, state and zone (Miguel et al., 2013). Now-a-days, the emerging evidences revealed the ever increasing demand of propolis as a nutraceuticals, functional food and food supplements, which is attributed to its imperative health-promoting bioactive constituents and biological factors (Galeotti et al., 2018; Abdullah et al., 2020). In view of the presence of 50% resin, 30% wax, 10% essential oils, 5% pollen and 5% of the specific organic compounds, the various characteristics of propolis are important to research for food use and establishing various quality standards (Stan et al., 2011). Nonetheless, the prior information is required along with conception of propolis attributes and its behaviour in systems while various unit operations of collection, processing, and product development. Honey has, till date, a comparative edge over other bee products, but other bee products must be recognized, developed and tested for their potential. The propolis offers plenty of untapped possibilities, but its development and sustainable application thereof have been hampered by inadequate knowledge. In India, few studies have been published on propolis (Naik et al., 2013; Wagh, 2013; Kasote, 2017), however, no comprehensive research work, as per our knowledge, is available to explore the propolis according to physico-chemical, techno-functional, textural and thermal properties. Therefore, this research was designed to investigate the above-mentioned properties of propolis obtained in four different areas of North India from various geographical sites.
2 Materials and methods
2.1 Chemicals
In this study, all the chemicals including sodium hydroxide, ethanol, n-hexane, sulphuric acid, and potassium bromide were obtained from Loba Chemie, Mumbai (India).
2.2 Collection of propolis samples
The propolis samples (n = 30) were obtained from four zones viz. Punjab, Rajasthan, Haryana and Himachal Pradesh, falling under the Northern region of India. These samples were collected during different months throughout the year, 2019 and designated as PP (Punjab Propolis), RP (Rajasthan Propolis), HP (Haryana Propolis) and HPP (Himachal Pradesh Propolis) (Table 1). It is observed that the trees from Genus Dalbergia, Acacia, Ziziphus and Azadirachta were found in abundance around the collection sites which would be major source of resins’ collection by bees. The propolis samples were stored under refrigeration conditions (4 °C) for subsequent analysis.
No. of Samples
GeographicalRegion
Name of state
Collection location
Collection time (2019)
Consistency
Location of beehives
n = 7
Northern
Himachal Pradesh
Hamirpur (n = 2)
Apr/May
Sticky
31.6862° N/ 76.5213° E
Una (n = 2)
Mar/Apr
31.4685° N/ 76.2708° E
Bilaspur (n = 3)
Mar/Apr/Sept
22.0797° N/ 82.1409° E
n = 11
Northern
Punjab
Sangrur (n = 4)
Mar/Apr/Aug/Sept
Sticky
30.2458° N/ 75.8421° E
Ludhiana (n = 3)
Apr/Aug/Sept
30.9010° N/ 75.8573° E
Moga (n = 2)
Mar/Aug/Sept
30.8230° N/ 75.1734° E
Barnala (n = 2)
Aug/Sept
30.3819° N/ 75.5468° E
n = 6
Northern
Haryana
Sirsa (n = 3)
Apr/Aug/Sept
Sticky
28.1920° N/ 76.6191° E
Mahendragarh (n = 3)
Mar/Apr/Sept
28.2734° N/ 76.1401° E
n = 6
Northern or Northwestern
Rajasthan
Sriganganagar (n = 3)
Mar/Apr/Aug
Sticky
29.9094° N/ 73.8800° E
Hanumangarh(n = 3)
Apr/Aug/Sept
25.5876° N/ 85.1628° E
2.3 Physico-chemical properties
The propolis samples were analyzed in triplicate according to AOAC (2002) official protocols for their ash, moisture, and protein content. Soxtech (Model-2045 Foss) and Fibertech (Model-2023 Foss) have been used to assess the crude fat and fibre content, respectively.
2.3.1 Color analysis
The Hunter LAB Colorimeter (CM-508d Model, Minolta, Japan), was used to measure the colour of propolis in triplicates (Lamberts et al., 2006). The chroma (c*) and hue angle (ho) were calculated using the formula:
2.3.2 Total balsam content (Ethanol extract of propolis)
Propolis samples were extracted using 70% (v/v) ethanol and filtration of the ensuing suspension was done. The collected extract was evaporated to dryness till fixed weight was obtained (Bankova et al. 2019).
2.3.3 Total wax content
Propolis (500 mg) was treated with n-hexane to whichmethanol (20 mL) was mixed after drying. It was boiledand methanol phase was filtered. The flasks (which had some solid residues) and paper with residues were weighed (Falcão et al., 2013).
2.3.4 Volatile oil content
Standard hydro-distillation was carried out for the preparation of essential oil by means of a Clevenger type apparatus equipped with a heating mantle (Naik, et al., 2013).
2.4 Techno-functional properties
2.4.1 Water solubility
The process consisted of mixing sample (0.2 g) and distilled water (20 mL). After centrifugation, the aliquot (5 mL) was dried in oven at 105 °C. Solubility was determined as the sample mass obtained after drying (Cano-Chauca et al., 2005).
2.4.2 Water and oil absorption capacities
Propolis (10%w/v) was thoroughly mixed with distilled water/oil for 30 s, centrifuged and volume of free water or oil (supernatant) was recorded. The water/oil absorbed was converted in weight (g) by multiplying the respective density (Abbey and Ibeh, 1988).
2.4.3 Emulsion activity/capacity and stability
Propolis (2 g) was mixed with distilled water (25 mL) and after thorough dispersion; soy oil (25 mL) was added slowly and mixed. The mixture was centrifuged at 1600 rpm for 5 min and volume of oil separated from sample was read. The emulsion activity (%) was measured as a ratio of height of emulsion to the total height (Okezie and Bello, 1988).
To determine the emulsion stability, fully-prepared emulsion was heated to 80 °C for 30 min and held in cold water for 15 min. The emulsion was centrifuged at 1300 × g for 5 min and the emulsion stability was calculated as follows:
Emulsion stability (%) = (Height of remaining emulsified layer/ Height of whole layer in tube) × 100
2.4.4 Foam capacity and stability
Propolis sample (1 g) was mixed with 50 mL distilled water for 5 min and the prepared blend was poured to graduated cylinder. The change in foam volume was recorded after30 min to obtain foam stability of sample (Okezie and Bello, 1988) as:
2.5 Texture profile analysis
The texture profiles of propolis samples (cylindrical shape, 2 cm of radius and 3 cm of height) were measured using TA.XT2i Texture Analyzer (Stable Micro Systems, Godalming, Surrey, UK) equipped with a load cell of 50 kg.
2.6 Differential scanning calorimetry (DSC)
It was performed using Discovery DSC 25 (TA Instruments, New Castle, Delaware, USA) for measuring the thermal characteristics of propolis. Indium was used to calibrate the DSC system. 10–15 mg propolis solution (20% w/v) was prepared and was scanned through the temperature range from −20 °C to 200 °C at 10 °C/min.
2.7 Statistical analysis
The statistical analysis (ANOVA and Duncan post-hoc tests) was applied utilizing the SPSS version 16.0 (Chicago, United States). Principal Component Analysis (PCA) and Hierarchical Cluster Analysis (HCA) was performed using Statistica v.12 (Stat Soft, Tulsa, Oklahoma, USA).
3 Results and discussion
3.1 Physicochemical characterization
The physico-chemical composition (Table 2) showed significant differences (p < 0.05) in propolis samples from different zones of North India. The moisture content for all analyzed samples was showing a significant variation (p < 0.05) and ranged from 4.89 to 7.37% (Table 2). These differences might be justified due to the differences in geographical area, flora, relative air humidity, precipitation and temperature between the chosen zones. Our findings were consistent with the results of Dias et al. (2012) in Portuguese propolis (3.4–5.4%). The propolis samples from different geographical locations demonstrated the water activity range of 0.73 to 0.81 (Table 2). Likewise, in a study carried out by Devequi-Nunes et al. (2018) on Brazalian propolis high value equal to 0.76 for red, 0.8 for green and 0.87 for brown propolis was reported. Further studies of sorption isotherms in propolis would be helpful in predicting the exact shelf-life in different packaging materials. In the present study, ash content demonstrated a significant difference (p < 0.05) among all samples from four different geographical locations and ranged from 3.01 to 4.71% (Table 2) which was in good agreement with those found in Portugese propolis (around 4–5%) (Falcão et al., 2013). Values are means ± SD of triplicate analysis. Means with different letters in the same row indicate significant differences at p < 0.05 HPP: Himachal Pradesh Propolis; PP: Punjab Propolis; HP: Haryana Propolis, and RP: Rajasthan Propolis
Parameter
HPP(n = 7)
PP(n = 11)
HP(n = 6)
RP(n = 6)
Moisture (%)
7.37
0.68a
4.89
0.23d
6.26
0.36b
5.15
c
Water Activity (aw)
0.73
0.23d
0.75
0.1c
0.81
0.14 a
0.77
0.18b
Ash Content (%)
3.56
c
3.01
d
4.71
a
3.79
b
Crude Fat (%)
68.89
a
53.62
c
56.6
b
54.5
c
Crude Protein (%)
7.28
c
9.41
a
8.36
b
8.7
0.42b
Crude Fiber (%)
1.94
d
3.15
a
2.29
c
2.56
b
Balsam Content (%)
40.9
d
47.66
a
43.64
c
45.90
b
Wax content (%)
16.5
d
22.9
a
20.6
2c
21.30
b
Pollen Content (%)
8.4
c
15
a
9.43
c
12.8
b
Volatile oil content (%)
1.13
b
1.01
c
0.93
d
1.84
a
L*
40.34
ab
38.9
b
38.15
0b
41.99
a
a*
1.2
c
2.64
a
1.6
b
1.09
d
b*
7.36
b
5.4
d
6.22
c
10.2
a
c*
7.4
b
6.0
0.0
d
6.45
c
10.35
a
h°
14.53
c
32.91
a
17.59
b
11.09
d
The crude fat content showed significant effect of the geographical location in North Indian propolis, ranged from 53.62 to 68.89%, where the HPP contained significantly higher (p < 0.05) crude fat value (Table 2). In contrast to our work, a very high value of 73.47% (Ibrahim et al., 2016) in Malaysian propolis was reported. The crude protein content of propolis samples varied from 7.28 to 9.41% which was significantly (p < 0.05) altered by different geographical location (Table 2). The highest content (9.41%) was obtained from the PP. Devequi-Nunes et al. (2018) reported crude protein content of brown propolis (2.49%) from Vitoria da Conquista (Brazil), and Ibrahim et al. (2016) in Malaysian propolis (3.80%). Since Brazilian legislation approved a very low protein content (>0.7%) to establish propolis as a quality product, therefore, based on protein content, the North Indian propolis can be recommended as best quality among the available propolis from literature.
The crude fiber content ranged between 1.94 and 3.15% showing the significant differences (p < 0.05) among samples (Table 2). Devequi-Nunes et al. (2018) determined a very high content of fiber (70.82%) in the brown propolis produced in Vitoria da Conquista (Brazil) which was similar to Malaysian propolis (44.36–67.48%) reported by Ibrahim et al. (2016).
The balsam content of North Indian propolis varied from 40.97 to 47.66% among all four zones’ samples and was observed to be maximum in PP. The obtained values follow the Brazilian legislation (minimum 35%) regulations for green propolis which determines the quality of product (Devequi-Nunes et al. (2018). Usually, the balsam content is associated with the higher bioactive compounds in propolis. Hence, the Punjab propolis could be considered as a dense source of biologically active components. The propolis samples from different geographical regions exhibited a significant variation (p < 0.05) in wax content from 16.5% for HPP and 22.9% for PP. A recent report showed the variation in wax content from 20.16 to 75.34% in propolis collected from several areas of Morocco (Touzani et al., 2018).
The results of total volatile oil content showed the variation from 0.93 to 1.84% where HP sample was significantly different (p < 0.05) from others (Table 2).The results found was lower than the value (3.2%) published by Naik et al., (2013) from propolis produced in Western India.
L* value was maximum in RP (41.99) followed by HPP, PP and HP which indicates the higher and lower degree of lightness, respectively. The positive a* value of propolis showed the reddish color being dominated in PP (2.64) that varied significantly than propolis from other three zones. The yellowness of propolis from different zones presented in Table 2 showed significant difference (p < 0.05).
The positive a* and b* values in this investigation indicated that the samples from all four zones lied in reddish yellowish areas of LAB color space. The hue angle values for the propolis samples from four different states ranged from 11.09 to 32.91° (Table 2) signifying R (Red) to YR (Yellow red) in Hunter L a b system. The hue angle of HPP was 14.53° indicating red whereas angle of 32.91° indicating yellow red color in PP. As the hue angles of HP and RP were 17.59° and 11.09°, respectively so they showed middle red color. Thus, it could be inferred that in the four studied zones there was no propolis with the hue of yellow greenish or greenish blue or bluish red and all belongs to yellowish red. The propolis samples from all four zones were found to be different significantly (p < 0.05) and relatively dull or gray as their chroma values were in the range of 6.03 and 10.35.
3.2 Techno-functional properties
Water Solubility varied from 8.71 (HPP) to 19.28% (PP) (Table 3) which showed significant variations (p < 0.05) among propolis samples. The result of water holding capacity (WHC) of propolis samples showed significant variations (p < 0.05), ranging from 0.6
(HPP) to 0.89 g/g (PP) whereas, the oil holding capacity values ranged between 1.09 and 1.90 g/g. Regarding emulsification properties, PP had the highest emulsifying activity (7.62%), followed by RP (6.68%), HP (5.58%) and HPP (4.18%). In current study, PP had the highest value (4.77%) of emulsion stability, followed by HP (4.34%) and RP (3.36%). Foaming capacity of propolis ranged between11.08% and 17.03%. Difference in protein content can lead to variations in the sample's foam ability.The foam stability varied significantly (p < 0.05) among propolis samples where PP showed markedly higher foam stability (75.43%) than RP (72.78%), HP (68.04%) and HPP (67.3%) (Table 3). Thus, all propolis samples showed the higher foaming capacity and stability and may find applications in baked and confectionery products. Values are means ± SD of triplicate analysis. Means with different letters in the same row indicate significant differences at p < 0.05 HPP: Himachal Pradesh Propolis; PP: Punjab Propolis; HP: Haryana Propolis, and RP: Rajasthan Propolis
Parameters
HPP (n = 7)
PP (n = 11)
HP (n = 6)
RP (n = 6)
Water Solubility (%)
19.29
a
8.71
d
10.97
b
9.97
c
Water Holding Capacity (g/g)
0.61
d
0.89
a
0.72
c
0.80
b
Oil Holding Capacity (g/g)
1.09
d
1.90
a
1.67
0b
1.49
c
Emulsifying Activity (%)
4.18
d
7.62
a
5.58
c
6.68
b
Emulsion Stability (%)
3.24
d
4.77
a
3.36
c
4.34
b
Foaming Capacity (%)
11.8
cd
17.03
a
12.26
c
14.41
b
Foam Stability (%)
67.30
d
a
70.04
c
b
3.3 Texture profile analysis (TPA)
TPA characteristics of propolis (Table 4) revealed that PP had a significantly high (p < 0.05) hardness value of 90.44 N followed by propolis of RP, HP, and HPP due the lowest moisture content and high balsam content of PP which helps to bind the molecules firmly together. Rahman and Al-Farsi (2005) reported that easy-to-deform converted into tough-to-deform condition in date flesh below the humidity of 21.50% due to loss of effect of water molecules as a plasticizer at low moisture content (Rahman et al., 2012). Values are means ± SD of triplicate analysis. Means with different letters in the same row indicate significant differences at p < 0.05. HPP: Himachal Pradesh Propolis; PP: Punjab Propolis; HP: Haryana Propolis, and RP: Rajasthan Propolis
Textural attributes
HPP (n = 7)
PP (n = 11)
HP (n = 6)
RP (n = 6)
Hardness (N)
54.68
d
90.04
a
73.67
c
85.98
b
Adhesiveness (N s)
−0.04
a
−0.06
a
−0.05
a
−0.02
b
Gumminess (N)
5.34
d
11.51
a
8.87
c
9.98
b
Chewiness (N)
6.40
b
6.09
b
7.04
a
6.14
b
Springiness
0.15
b
0.16
a
0.14
ab
0.11
bc
Cohesiveness
0.78
a
0.52
c
0.67
ab
0.65
bc
Resilience
5.46
c
7.84
a
7.11
ab
6.78
b
It can be seen from Table 4 that the adhesiveness value has been obtained for RP (−0.02 Ns) and −0.06 Ns for PP. Such results were due to presence of sticky component on propolis surface, which after contact with analyzer’s working body, would lead to an increase in work required for overcoming the adhesion forces. Further, PP (11.51 N) had a significantly higher (p < 0.05) gumminess value than other samples. Similar results (8.28 N-15.49 N) were reported for various plasticized poly (D,L-lactic acid) caffeine biodegradable chewing gum formulations reported by Mehta et al. (2017).
The cohesiveness values of samples varied from 0.67 to 0.78 showing the significant variations (p < 0.05). The high value of cohesiveness means that propolis samples are having high degree of organization, structure and not crumbly. RP showed the lowest springiness (0.11) (Table 4) whichdid not vary significantly (p > 0.05) compared to other samples. Higher springiness needs more energy in the mouth for mastication (Shafiur Rahman and Al-Mahrouqi, 2009). The chewiness of samples, in this study, varied from 6.09 to 7.04 N. Thus, it becomes clear that all propolis samples require low energy for chewing. Resilience, a textural property “the fight back capability of material” was found highest in PP (7.84) and lowest in HP Propolis (5.46).
3.4 Thermal properties
In propolis samples, only thermal phenomenon of endothermic reaction due to fusion was observed (Fig. 1) and none of sample exhibited glass transition (Tg) due to high degree of crystallinity and their melting without using the highly elastic state. PP, HP and RP propolis samples exhibited two endothermic transitions (Fig. 1) whereas HPP showed three endothermic transitions. The reason of existence of more than one endothermic transition was the presence of multiple solutes in the samples which did not interact to act as a single solute (Rahman, 2004). Table 5 shows the temperatures (onset [To], peak [Tp], and end set [Te]) and enthalpy ΔH, for propolis from different geographical locations which varied significantly (p < 0.05). This might be linked to differences in composition, and internal arrangement of various components. Values are means ± SD of triplicate analysis. Means with different letters in the same row indicate significant differences at p < 0.05 HPP: Himachal Pradesh Propolis; PP: Punjab Propolis; HP: Haryana Propolis, and RP: Rajasthan Propolis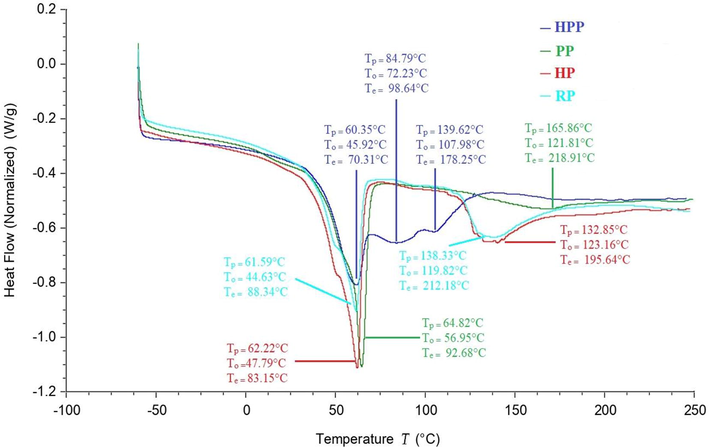
A typical DSC thermogram of Indian propolis from different botanical origins. HPP = Himachal Pradesh propolis; PP = Punjab propolis; HP = Haryana propolis; RP = Rajasthan propolis.
Sample
Peak
HPP (n = 7)
PP (n = 11)
HP (n = 6)
RP (n = 6)
Peak temperature Tp(°C)
1st
60.35 ± 0.02d
64.82 ± 0.08a
62.22 ± 0.06b
61.59 ± 0.03c
2nd
84.79 ± 0.13d
165.86 ± 0.25a
132.85 ± 0.15c
138.33 ± 0.19b
3rd
139.62 ± 0.17a
–
–
–
Onset temperature To (°C)
1st
45.92 ± 0.13c
56.95 ± 0.11a
47.79 ± 0.09b
44.63 ± 0.07d
2nd
72.23 ± 0.16d
121.81 ± 0.23b
123.16 ± 0.26a
119.82 ± 0.18c
3rd
107.98 ± 0.13a
–
–
–
End set temperature Te(°C)
1st
70.31 ± 0.07d
92.68 ± 0.14a
83.15 ± 0.10c
88.34 ± 0.11b
2nd
98.64 ± 0.13d
218.91 ± 0.22a
195.64 ± 0.17c
212.18 ± 0.20b
3rd
178.25 ± 0.10a
–
–
–
Enthalpy (J/g)
1st
20.81 ± 0.06d
61.54 ± 0.08b
69.29 ± 0.09a
54.78 ± 0.08c
2nd
3.55 ± 0.04d
21.47 ± 0.05c
28.92 ± 0.07b
38.00 ± 0.10a
3rd
18.28 ± 0.07a
–
–
–
3.5 Multivariate analysis
The principal component analysis (PCA) was employed for determining the similarities and differentiation among propolis samples and three principal components (PCs) were obtained (Table 6) which contributed to 98.95% variation in all propolis samples. PC1 alone showed 56.17% variation in samples where moisture, ash, proteins, balsam content, fibre, a*,h°, volatile oil content, crude fat, water and oil holding capacity, emulsion stability, foam stability, hardness, gumminess, cohesiveness, resilience, onset, peak and end set temperature and enthalpy were the major factors (Fig. 2a). Moisture, ash, crude fat, emulsion stability, foam stability and cohesiveness were placed on the positive side of PC1 (Fig. 2a) which made them strong contributor for propolis classification. These results also showed that moisture, ash and crude fat were the major physicochemical properties, responsible for emulsion and foam stability and cohesiveness. The remaining factors of PC1 were closely positioned on the negative side of PC1 axis showing that balsam content, protein, fibre and volatile oil content of propolis mainly accounted for functional properties like water and oil holding capacity, textural properties like hardness, gumminess and resilience, and thermal properties (onset, peak and end set temperature and enthalpy) imparting similar effect (Fig.4a). PC2 accounted for 30.77% variation with b*, C*, water solubility, emulsion activity and springiness being main factors while PC3 was responsible for 12.02% variation in samples with water activity and foam capacity as dominating parameters. Fig.4b reveals the projection of propolis samples collected from different zones of Northern India on PC1 and PC2 axes where all the sub-samples of HPP, PP, HP and RP were positioned near to each other indicating an extremely high level of correlation among them based on physicochemical, functional, textural and thermal properties. All samples were clearly classified according to the studied variables where one cluster at upright of PC1 categorized the RP samples into 6 sub-samples, second bunch distributed compactly around below of right-hand side of PC1 grouped the HPP samples and third cluster nearly the centre of PC 1 and PC2 grouped the HP samples while the cluster present in down of left-hand side categorized the PP samples. Thus, all propolis samples of Northern India region were differentiated using PCA. Besides this, the results of hierarchical cluster analysis (HCA) showed four distinguished clusters of samples (Fig. 3) from top to bottom, namely HPP, PP, HP and RP which corresponds to their different locations in North India. Thus, the propolis samples were clearly classified into four groups using HCA. *: Significant values (p ≤ 0.05) BC: Balsam content; VOC: Volatile oil content; CF: Crude fat; WS: Water solubility; WHC: Water holding capacity; OHC: Oil holding capacity; EA: Emulsifying activity; ES: Emulsion stability; FC: Foam capacity; FS: Foam stability; H: Hardness; Adh: Adhesiveness; G: Gumminess; Chw: Chewiness; S: Springiness; Coh: Cohesiveness; R: Resilience; Tp: Peak temperature; To: Onset temperature; Te:Endset temperature; E: Enthalpy
Parameters
PC1
PC2
PC3
Moisture
0.84*
−0.50
−0.23
Ash
0.75*
0.64
−0.16
BC
−0.90*
0.36
0.23
Protein
−0.95*
0.31
0.08
aw
−0.18
0.56
−0.77*
Fibre
−0.96*
0.10
0.26
L*
0.41
0.58
0.70
a*
−0.88*
−0.47
0.03
b*
0.48
0.79*
0.37
C*
0.39
0.82*
0.41
h°
−0.85*
−0.52
0.09
VOC
−0.76*
−0.56
0.33
Wax
−0.68
0.58
−0.45
CF
0.82*
−0.55
0.14
WS
0.01
0.97*
0.22
WHC
−0.92*
0.25
0.24
OHC
−0.96*
0.10
−0.26
EA
0.14
−0.98*
0.15
ES
0.79*
−0.47
−0.40
FC
−0.03
0.50
−0.86*
FS
0.72*
0.63
0.27
H
−0.85*
0.50
0.13
Adh
0.57
0.66
0.38
G
−0.93*
0.39
0.04
Chw
−0.66
−0.57
0.49
S
−0.24
−0.93*
−0.04
Coh
0.99*
−0.09
−0.12
R
−0.95*
0.20
−0.21
Tp
−0.99*
−0.13
0.02
To
−0.87*
−0.48
0.12
Te
−0.89*
0.44
0.06
E
−0.74*
0.41
−0.52
Eigenvalue
17.97
9.85
3.85
Total variance (%)
56.17
30.77
12.02
Cumulative variance (%)
56.17
86.93
98.95
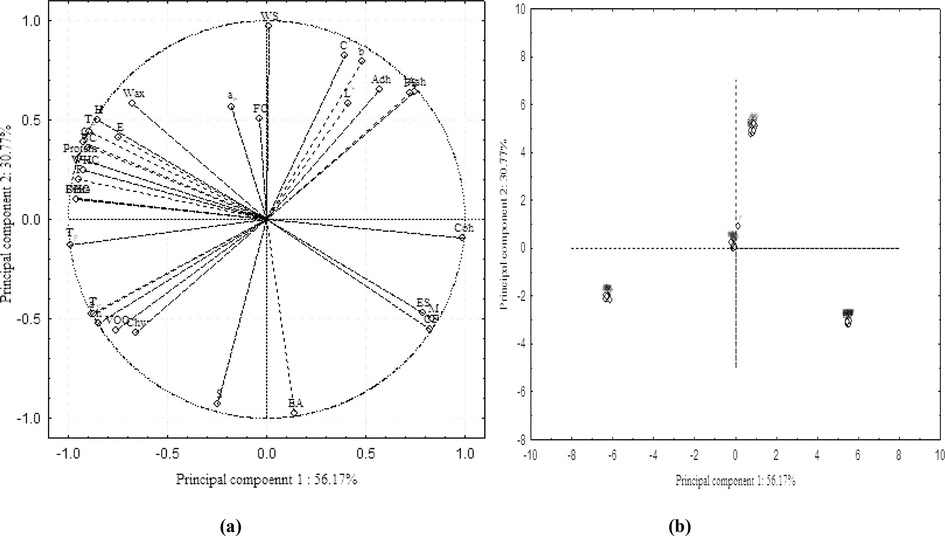
Projection of (a) studied variables and (b) Indian propolis samples based on PC1 and PC2. M: Moisture; BC: Balsam content; VOC: Volatile oil content; CF: Crude fat; WS: Water solubility; WHC: Water holding capacity; OHC: Oil holding capacity; EA: Emulsifying activity; ES: Emulsion stability; FC: Foam capacity; FS: Foam stability; H: Hardness; Adh: Adhesiveness; G: Gumminess; Chw: Chewiness; S: Springiness; Coh: Cohesiveness; R: Resilience;Tp: Peak temperature; To: Onset temperature; Te: Endset temperature; E: Enthalpy. HPP = Himachal Pradesh propolis; PP = Punjab propolis; HP = Haryana propolis; RP = Rajasthan propolis.
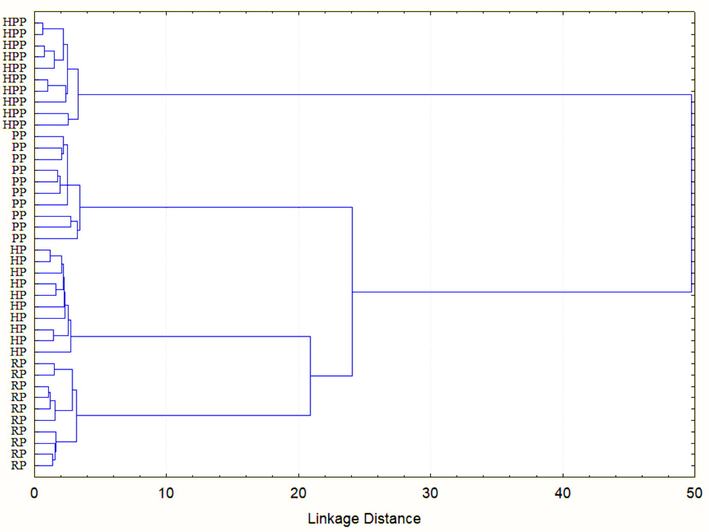
Hierarchical cluster analysis of Indian propolis samples. HPP = Himachal Pradesh propolis; PP = Punjab propolis; HP = Haryana propolis; RP = Rajasthan propolis.
4 Conclusion
The physico-chemical, functional, textural and thermal characteristics of the propolis samples from four various zones varied from one zone to another. The outcomes of study of techno functional properties reveal that addition of propolis may have a strong impact on emulsifying and foaming properties and could be used effectively in various food products. Based on this outcome, further work can be carried to explore the profile of various compositional components to further establish its potential as food additive. Bee products like propolis which are normally underutilized can also be brought under the umbrella of food security on account of its constituents. However, extensive research work on compositional profiling of propolis is crucial to completely comprehend it.
Acknowledgement
This project was supported by Researchers Supporting Project number (RSP-2020/283) King Saud University, Riyadh, Saudi Arabia.
Declaration of Competing Interest
The authors declare that they have no known competing financial interests or personal relationships that could have appeared to influence the work reported in this paper.
References
- Functional properties of raw and heat processed cowpea (Vigna unguiculata, Walp) flour. J. Food. Sci.. 1988;53(6):1775-1777.
- [Google Scholar]
- Phytochemicals, mineral contents, antioxidants, and antimicrobial activities of propolis produced by Brunei stingless bees Geniotrigona thoracica, Heterotrigona itama, and Tetrigona binghami. Saudi J. Biol. Sci.. 2020;27(11):2902-2911.
- [Google Scholar]
- Composition and functional properties of propolis (bee glue): A review. Saudi J. Biol. Sci.. 2019;26(7):1695-1703.
- [Google Scholar]
- Official methods of analysis (17th Edition). Washington DC, USA: Association of Official Analytical Chemists; 2002.
- Standard methods for Apis mellifera propolis research. J. Apic. Res.. 2019;58(2):1-49.
- [Google Scholar]
- Effect of the carriers on the microstructure of mango powder obtained by spray drying and its functional characterization. Innov. Food Sci. Emerg. Technol.. 2005;6(4):420-428.
- [Google Scholar]
- Therapeutic properties of bioactive compounds from different honeybee products. Front Pharmacol.. 2017;8:1-20.
- [Google Scholar]
- Chemical characterization and biological activity of six different extracts of propolis through conventional methods and supercritical extraction. PLoS ONE. 2018;13(12):e0207676.
- [CrossRef] [Google Scholar]
- Comparative study of different Portuguese samples of propolis: Pollinic, sensorial, physicochemical, microbiological characterization and antibacterial activity. Food Chem. Toxicol.. 2012;50(12):4246-4253.
- [Google Scholar]
- A proposal for physicochemical standards and antioxidant activity of Portuguese propolis. J. Am. Oil Chem. Soc.. 2013;90(11):1729-1741.
- [Google Scholar]
- Chemical composition and antioxidant activity of propolis prepared in different forms and in different solvents useful for finished products. Foods.. 2018;7:1-10.
- [Google Scholar]
- Chemical and biological analyses of Malaysian stingless bee propolis extracts. Malaysian J. Anal. Sci.. 2016;20(2):413-422.
- [Google Scholar]
- Propolis: A neglected product of value in the Indian beekeeping sector. Bee World.. 2017;94(3):80-83.
- [Google Scholar]
- Effect of processing conditions on colour change of parboiled rice. J. Agric. Food Chem.. 2006;54:9924-9929.
- [Google Scholar]
- Formulation and characterization of caffeine biodegradable chewing gum delivery system for alertness using plasticized poly (D, L-lactic acid) as gum base. Trop. J. Pharm. Res.. 2017;16(7):1489.
- [CrossRef] [Google Scholar]
- Phenols, flavonoids and antioxidant activity of aqueous and methanolic extracts of propolis (Apis mellifera L.) from Algarve. South Portugal. Food Sci. Technol. (Campinas). 2013;34(1):16-23.
- [Google Scholar]
- Essential oil of Indian propolis: Chemical composition and repellency against the honey bee Apis florea. Chem Biodivers.. 2013;10:649-657.
- [Google Scholar]
- Physicochemical and functional properties of winged bean flour and isolate compared with soy isolate. J. Food Sci.. 1988;53(2):450-454.
- [Google Scholar]
- State diagram of date flesh using differential scanning calorimetry (DSC) Int. J. Food Prop.. 2004;7(3):407-428.
- [Google Scholar]
- Instrumental texture profile analysis (TPA) of date flesh as a function of moisture content. J. Food Eng.. 2005;66(4):505-511.
- [Google Scholar]
- Instrumental texture profile analysis of gelatin gel extracted from grouper skin and commercial (bovine and porcine) gelatin gels. Int. J. Food Sci. Nutr.. 2009;60(sup7):229-242.
- [Google Scholar]
- Classification of commercial Omani halwa by physico-chemical properties and instrumental texture profile analysis. Ital. J. Food Sci.. 2012;24:292-304.
- [Google Scholar]
- Quality criteria for propolis standardization. Anim. Sci. Biotechnol.. 2011;44:137-140.
- [Google Scholar]
- Chemical analysis and antioxidant content of various propolis samples collected from different regions and their impact on antimicrobial activities. Asian Pac. J. Trop. Med.. 2018;11(7):436.
- [CrossRef] [Google Scholar]
- Propolis: A wonder bees product and its pharmacological potentials. Adv. Pharmacol. Sci.. 2013;2013:1-11.
- [Google Scholar]


