

Translate this page into:
Cancer screening by fluorescence spectra of blood and urine – A double blind study
⁎Corresponding author. malsalhi@ksu.edu.sa (Mohamad S. AlSalhi)
-
Received: ,
Accepted: ,
This article was originally published by Elsevier and was migrated to Scientific Scholar after the change of Publisher.
Peer review under responsibility of King Saud University.
Abstract
Objective
Absorption spectroscopy and calorimetry has been a very convenient tool in the diagnosis of a variety of diseases. In recent times, fluorescence emission spectroscopy is proposed to be a more sensitive technique for disease detection.
Methods
In this context, fluorescence emission spectra have been obtained from blood and urine samples from clinically suspected subjects of cancer (N = 40) as compared with normal control samples.
Results
Based on a certain set of fluorometric ratio parameters the samples of suspected subjects were scored positive or negative to assess the validity of the spectral technique in detecting cancer, irrespective of organ or stage. This study was done in the premises of a hospital with the blinded sets of blood and urine samples and it has classified correctly 30 out of 40 (75% true positive) indicating a reasonable level of accuracy of this new, simple technique
Conclusion
It could be of significant value as the first-line defense in the screening process of any cancer.
Keywords
Optical biopsy
Field study of cancer diagnosis
Spectra of blood and urine
Double-blind study

1 Introduction
Outreach camps for early detection of cancer of the breast, cervix, mouth or colon, etc., are common in different parts of the world (Warner, 2011; Ebenezar et al., 2010; Neil et al., 2011; Ho et al., 2017). Among all these, only early detection of breast cancer has proved to be effective in terms of reduced mortality and morbidity. There is no technique, as yet, for generic cancer detection so that the clinically suspected cases could be filtered for the second battery of more accurate tests. The essential requirement of such a screening test is the highest value of sensitivity, even at the risk of moderate specificity. One such test already in practice is the PSA (prostate-specific antigen) measurement for prostate cancer screening among the elderly population. When the PSA score is reached above 2.5 ng/ml is concluded as an abnormal condition. The average PSA ranges for this age range is 0.6 to 0.7 ng/ml. Based on the observation for men in their 60 s: PSA score elevated above 4.0 ng/ml is concluded abnormal stages. The sensitivity of the PSA test is about 90%, but the specificity, is only around 60%; yet such screening is recommended and practiced worldwide (Magklara et al., 1999).
In a similar fashion, colonoscopy permits the visual examination of the entire colorectal regions. Abnormal regions biopsies can be removed through the scope during the exam. It is gold standard technique to detect/screening the colon cancer among the larger region of intestine (Wilkins et al., 2018). In this context, a set of researchers has been carrying out spectral analyses of blood components and urine to identify and quantify cancer indicative biomarkers for the last few years and have reached a significant level of accuracy. The earliest report was from Leinier and his group, investigating mostly on the fluorescence of plasma and urine (Rajasekaran et al., 2014; Madhuri et al., 2003). The stokes shift spectra is an emerging approach toward cancer detection with sensitivity and specificity above 90% as for level elevated fluorescent biomolecules (Ebenezar et al., 2012).
According to them fluorescent biomolecules like tryptophan, tyrosine, flavins adenine dinucleotide (FAD), etc., were markedly different for cancer patients. This was followed by Madhuri et al who focused mostly on plasma samples of liver diseases and oral cancer (Madhuri et al., 2003). Another set of research works came from our group which mostly related quantification of porphyrin in the acetone extract of cellular components and also fluorescent biomarkers of blood plasma and urine (Masilamani et al., 2020, 2012; AlSalhi et al., 2020; Atif et al., 2020; Devanesan et al., 2021). The essential features of all these investigations are that a certain set of fluorescent biomarkers go out of proportion when malignancy sets in (Masilamani et al., 2010).
The present report is a preliminary trial, done in the hospital premises, to check the proof of the above concepts. The results of this investigation indicate the potentials of this technique for generic cancer screening camps. This report must be regarded as the continuation of our earlier papers (Masilamani et al., 2012, 2010; AlSalhi et al., 2011). It is important to note this technique has been extended to the detection of a variety of diseases (Zelingmani, 1950; Courrol et al., 2007; da Silva et al., 2014; Gotardelo et al., 2018), including the recent pandemic Covid-19, by a host of other workers (San Juan et al., 2020). The investigation presented here is an attempt to evaluate the efficacy of the above said spectral diagnosis with a blinded set of samples in the premises of the cancer hospital.
2 Methods and materials
2.1 Study population
The blood and urine samples from clinically suspected subjects of cancer (N = 40) were collected from at King Khalid University Hospital, Riyadh Saudi Arabia. To standardize the spectral features of blood plasma, urine, and the acetone extract of cellular compounds. The only one requirement on the part of the normal controls was that they must be free from any known disease, on their own self-assessment. They were informed about the procedure and consents were obtained. Most of the controls were normal office going persons, staff nurses, attendants or researchers. Blood samples (EDTA vial) and urine samples (in sterile vials) were collected and spectral analyses were done on the same day. The disease group only selected cancer with different stages and also eliminated those who had other medical complications including hypertension, hyperglycemia and also excluded those who underwent major operations. Institutional Review Board approval of the study centers was obtained for this research protocol (E-15-1518).
2.2 Blood sample
5 ml of blood sample was collected from normal control and diseased person into an EDTA vial and mixed gently for even mixing to avoid unwanted clumsy in the blood sample. The collected samples were centrifuged (3000 rpm, 15 min); the precipitated supernatant part (blood plasma) was drawn out and discarded. Then the buffy coat separating the cellular fraction was pipeted out and also discarded; the left over cellular fraction (1 ml) was lysed with 2 ml of pure acetone. Then the RBC lysed samples thoroughly mixed acetone and cellular fraction. Furthermore, the samples were centrifuged (3000 rpm, 15 min) so that the supernatant acetone extract was rich with fluorescent biomarkers.
2.3 Urine sample
5 ml of first voided urine were collected from each subject in a sterile, urine container commonly which was used to collect the samples for laboratory experimental uses. Such urine samples were analyzed without any other treatment. These were used a fresh, on the same day for the spectral analysis.
2.4 Methods
The instrumentation was used for PerkinElmer LS 55 USA. The Fluorescence spectrometer is highly reliable with easy use especially, discrimination of each samples based on spectral features. The in-build software have support our tested samples to differentiate each set of samples. The experimental procedure for fluorescence emission spectra of blood and urine were same as our earlier reports, particularly of single blind study (Masilamani et al., 2012, 2010; AlSalhi et al., 2011). In short, we have obtained fluorescence emission spectra (FES) of acetone extract of red blood cell (RBC), with excitation at 400 nm, emission spectral scan range of 425–675 nm only and synchronous excitation spectra (SXS) of blood plasma of (λΔ = 70) scan range of 200–600 nm. Very similar spectra were obtained for plain, untreated urine.
2.5 Statistical analysis
To provide statistical validity for the observed spectral results, a set of ratio parameters (R1, R2, etc.,) were introduced. A particular ratio parameter—say, R1—is defined as the ratio of fluorescence intensities of two bands (I630 nm ∕I585 nm). Mean ± SD values of all the ratio parameters were calculated for each group of experimental subjects. One-way factorial ANOVA was used to calculate the level of physical significance (p) with a 95% confidence interval, (Table 1). Note: p value is a measure of overlap in the data points of two different sets. When it is less than 0.05 the classification reliability becomes greater than 90%. Similarly, the area under the ROC (receiver operator curve) is a measure of reliability of statistics and it should be above 0.8 See our earlier papers for details (Masilamani et al., 2010, 2012).
S. No
Ratio
Controls
Ear. Cancer
Adv Cancer
P- value
Contrast
Area in ROC
1
R1 = 630∕I585
1 ± 0 0.3
1.7 ± 0.4
3.1. ± 0.5
<0.04
3
0.85
2
R2 = I510∕I457
1.2 ± 0.2
1.72 ± 0.5
2 ± 0.5
<0.05
1.7
0.9
3
R3 = I290∕I360
4.2 ± 0.1
6.4 ± 0.2
8 0.1 ± 0.4
<0.001
5
0.95
4
R4 = I510∕I460
1.8 ± 0.3
2. 1 ± 0.5
3.2 ± 0.6
0 < 0.2
2.3
0.83
3 Results
Fig. 1 (a) gives the FES of acetone extract of RBC typical of normal control. There are four bands; the one at 475 nm is due to Raman signal of acetone; that at 490 nm is due to flavin of residual plasma; that at 585 nm and 630 nm and are due to the basic and neutral forms of porphyrin. Out of a number of ratio parameters possible, only R1 = I630/ I585 gave consistent classification tool between the control set and cancer patient set. So only this would be discussed further on. This ratio was 1.1 ± 0.3 for the control. Here 1.1 was the mean and 0.3 the standard deviation (SD), with a lower bound at 0.85 and an upper bound at 1.45 for the 95% confidence interval. That is, any R1 value above 1.45 may be classified as abnormal, or cancer indication, in our investigation, with a 95% probability. Fig. 1 (b) and (c) give the FES of acetone extract of RBC of cancer suspected subjects. The spectral features were very similar to those of the normal control, with the major difference being that the R1 = 1.7 ± 0.5 perhaps for an early stage of cancer (b) and 3.1 ± 0.5for the advanced stages of the tumor (c).
(a) Gives fluorescence emission spectra (FES) of acetone extract of RBC typical of normal control; (b) for subjects of early cancer; (c) for subjects of advanced cancer.
Fig. 2 (a) gives typical FES of urine of normal control (N = 32). There were two bands, the primary peak at 520 nm (due to flavin) and shoulder at 475 nm (due to NADH). The intensity ratio for the control was R2 = I520/I475 = 0.97 ± 0.12 (with the lower bound at 0.77 and upper bound at 1.11, of the 95% confidential intervals). That is, any value of R2 greater than 1.14 may be regarded as indicative of malignancy, with a 95% probability. With this ratio parameter as benchmarks or cut-off values, the spectral parameters of suspected samples were scored as positive or negative. Fig. 2 (b) and (c) give the FES of a plain urine sample of suspected subjects. There was a close similarity for these two curves to that given in Fig. 2 (a) for the control. The major difference was that the band at 520 nm was far more elevated than that for normal control, given in Fig. 2 (a). The ratio R2 was 1.5 ± 0.2 for probably for early cancer 2 (b) and 2.2 ± 0.5 for the advanced stage of cancer (c). The peak at 500 nm in 2 (a) got red-shifted to 520 nm in 2(b) and (c) as the urine sample of cancer subjects had a higher concentration of FAD.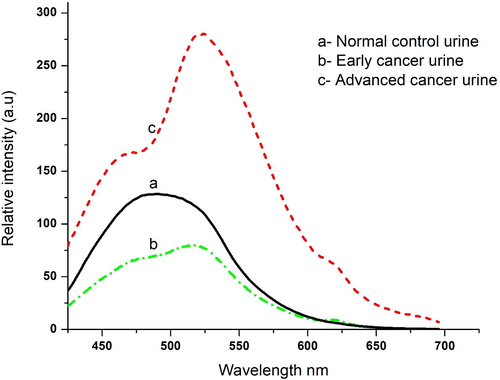
(a) Gives average of FES of urine of normal control; (b) for subjects of early cancer, (c) for subjects of advanced cancer.
Fig. 3 shows SXS with Δλ = 70 nm, which gives the distinct stokes shift of relevant fluorophores of blood plasma. Here Fig. 3 (a) is for the controls and (b) is for the patients, both cases being typical, representative spectra. There are three peak were recorded for each set of tested samples. The peaks are at 290 nm, second peak at 360 nm, and the third at 460 nm for both control and diseases samples, at the same time relative intensities are distinctly dissimilar. We define R3 = I290/I360; this is above 4.3 ± 0.1 for control and more than 8.5 ± 0.4 for suspected cases. Based on the results the elevation of fluorescent biomarkers got elevated 200%, in plasma as malignancy sets. Later 290 nm is to be identified with tryptophan and 360 nm with NADH. Also, note that the ratio of intensities of bands at 450 and 360 nm (R4 = I450/I360) is about 0.5–0.55 for controls and 0.8–0.86 for possible cancer patients. That is, 450 nm bands (due to flavin) is elevated about 1.6 times than 360 nm due to NADH. Fig. 4 shows SFXS with Δλ = 70 nm, which gives the fluorophores (NADH and FAD) of urine or normal control and cancer samples. A contrast between the normal and malignant sample is more conspicuously brought out in the above spectra. There are two bands, one at 360 nm (due to NADH) and a double hump around 460 nm (due to flavin and bilirubin) for the controls and patients. But in 4 (a), for R4 = I460/I360, about 0.34 ± 0.5 for controls and 1.56 ± 0.3 for the patients.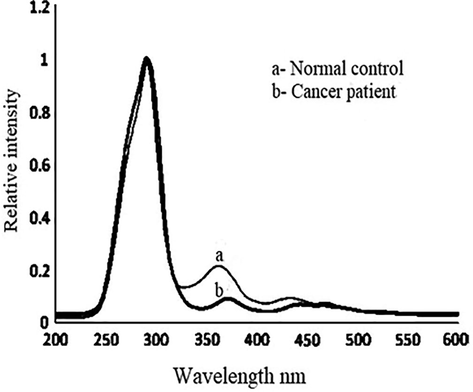
(a) Gives synchronous fluorescence excitation spectra (SFXS) of blood plasma of typical normal control; typical for cancer patients.
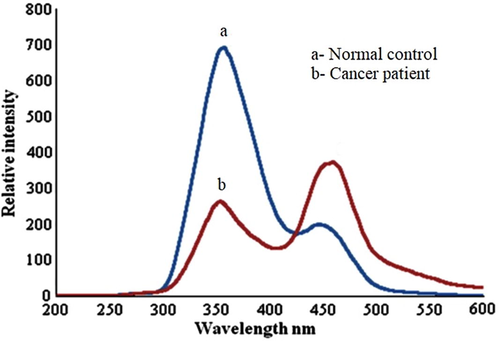
(a) Gives synchronous fluorescence excitation spectra (SFXS) of urine of typical normal control.; (b) typical for cancer patients.
The close similarity between the SFXS of blood plasma is surprisingly remarkable, with one major difference that the peak at 290 nm due to tryptophan is entirely absent in urine. This is because tryptophan is an essential amino acid, very important to many biological processes, and hence filtered from the blood and circulated back into the system. Others like FAD and NADH are excreted and hence their proportions are maintained intact in plasma as well as in the urine.
3.1 Stepwise discriminant analysis
The present study is for discriminating between healthy and cancer (group I); healthy and advanced cancer (group II); the ratio variables (R1 to R4) were the inputs for stepwise discriminant analyses to determine the sensitivity. Table 2 summarizes the true positive (sensitivity) values of optical diagnosis which is 75%. It is reasonably good with reference to the complexity of task and simplicity of the technique. Out of Total = 40 subjects Total= 30 cases classified correctly Sensitivity 75%.
R1 = 1.45; R2 = 1.51; R3 = 4.61 R4 = 1.8
Subject No.
Conventional Diagnosis
Number of cases
Correlation
1
Invasive ductal carcinoma of the breast
9 cases
7cases classified correctly
2
Cervical squamous cell carcinoma
8 cases
6 cases classified correctly
3
Thyroid carcinoma
4 cases
2 cases classified correctly
4
Esophageal carcinoma
7 cases
5 cases classified correctly
5
Other organs (cheek, ovary, testis, mouth)
Each 3 cases (Total 12)
10 cases classified correctly
4 Discussion
The fluorescence spectrometer contains an optical core which uses highly sensitive photodiodes and four LED sources (UV, Blue, Green, and Red). We could measure based on the fluorescence of a blood or tissue or blood plasma its endogenous fluorophores. Particularly, the blood plasma fluorescent biomolecules, tryptophan, NADH, FAD, aromatic amino acids and lipopigments (Monici, 2005). When the cancerous elevation in the blood/blood plasma endogenous fluorophores undergo a variation due to often excess amount of blood flow leads to a lesser fluorescence (Pålsson, 2003). The decay or low level of fluorophores absorb excess light which helps to discriminate analysis of normal and malignant samples (Masilamani et al.,2010; Masilamani et al., 2012; AlSalhi et al., 2011). FAD and NADH are predominantly presented in the mitochondrial tricarboxylic acid cycle and electron transfer chain and involve (FAD) ATP synthesis process and reactive oxygen species as part of the apoptosis pathway (Alam et al., 2017). Each sample was identified as the spectral alteration and variation in the relative intensity profile/value.
Cancer represents a major health issues due to high level of specific illness and death rates associated with it, despite of the recent improvements in therapeutic modalities. Spectral diagnosis is a subset of optical biopsy, wherein light is being employed as a tool to identify and quantity cancer biomarker in tissue or body fluids. Our earlier papers, such investigations have been reported for the detection of the liver, lung, breast cancer, etc. from the fluorescent features of biomolecules such as tryptophan, FAD, NADH and porphyrin (Masilamani et al., 2012; AlSalhi et al., 2011; Pu et al., 2013; Shi et al., 2017).
Two sets of samples namely blood components and urine were taken through FES and SFXS from which four spectral parameters had been evaluated. We have obtained a ratio parameter R1 which is a measure of porphyrin present in the cellular fraction (from FES of RBC) and another parameter R2, which is a measure of FAD/NADH ratio in urine (from FES of urine). With the upper limit of R1 = 1.45 and of R2 = 1.54 as the cut off ratio parameters, any sample of subjects exhibiting value greater than 1.45 for R1 or 1.51 to R2 was scored cancer positive and compared with results of the conventional diagnosis. This was the first trial, which gave 11 misclassifications out of 40, based on R1 alone; 14 out of 40 based on R2 alone. That is, sensitivities were 72.5% and 65% only respectively. In addition from the SFXS another two more ratios R3 = 4.61 and R4 = 1.81 were identified as the normal values of tryptophan/NADH in plasma and FAD/NADH in urine respectively.
With two more ratios only when all the four ratios were individually higher than the cutoff level, the subject was classified as indicative of some malignancy in some part of the body. When such criteria were taken into consideration only 10 out of 40 cases were misclassified, with the resultant sensitivity of 75% (See Table 2). This indicates that a blood parameter was elevated in some cases of cancer, even when the urine parameter was normal and vice versa.
Now the possible reasons for elevation of porphyrin (which leads to R1 higher for any type of malignancy) and depression of NADH (as manifested by the higher values of R2) must be addressed when cells multiply abnormally as in the case of malignancy the bone marrow gets signal for enhanced hemopoiesis (Sibon et al., 2019; Ray, 2016). This leads to the imbalance in the heme pathways, most likely the excess of protoporphyrin in the blood circulation as enough essential components, particularly iron, may not be available for proper production of heme of hemoglobin (of RBC). This is the most often cited reason for universal enhancement of porphyrin with distinct red fluorescence whenever malignancy sets (Ebenezar et al., 2015; Uttamlal and Sheila Holmes-Smith, 2008; Tsolekile et al., 2019).
The study reported related to NADH role of all types of cancers, the NADH level has been reduced as the abnormal metabolism of the respiration of cancer cells. Which leads to reduced form of oxygen and high level of sugar in cancer. The cancerous cells have less ATP as compared to normal cells. When the ATP level decreases in cells which lead to cell proliferation, where enough amount of NADH in cells get more ATP which helps to reduce the cell proliferation or even no chance to get oxygen demand in each cell (Liberti and Locasale, 2016). FAD is a coenzyme involved in many redox processes and it is enhanced in any abnormal cell growth (Mansoorabadi et al., 2007). Between the two opposing trends, the decrease in NADH appears to be stronger than the increase in FAD so that the ratio R2 for any malignancy is three to four times higher than the normal. Perhaps because of the same reason R3 is twice higher for cancer plasma, not because of enhanced tryptophan but because of depressed NADH. It is important to draw attention to two major results.
The gist of conclusion at the end of all these exercises:
-
This technique open up a new field in clinical biochemistry which could complement other modalities
-
In principle, any cancer in any part of the body could be detected by spectral analysis of blood and urine.
-
The sensitivity of this technique is 75%
-
The biggest advantage of this work is that if blood and urine analysis of a person show no abnormality the person can be sure that he/ she has no malignancy in any part of the body. However, if the spectral features are abnormal malignancy indication is one of the many other possible diseases. The person must go through other battery of tests to eliminate the possibility of malignancy. It is the negative result which is more valuable than the positive result, as in many other indications
5 Conclusion
This report is the first-ever double-blind study done fora generic cancer screening based on the biomarkers of blood and urine. The idea underlying such an attempt is that since blood circulates in every part of the tissue, the abnormal malignant growth could be detected in the abnormal concentration of a few fluorescent biomolecules.
For this purpose, FES of acetone extract of RBC to quantify porphyrin, and FES and SFXS of urine to quantify FAD and NADH had been done in this investigation. In addition, SFXS of plasma also was done to quantify the ratio between tryptophan and NADH. Based on benchmark levels of the above biomarkers a “double-blind study” had been done in the hospital premises. In comparison to the conventional biopsy reports, this fluorescence spectroscopy technique has shown a sensitivity of 75%. Such a simple technique could be of significant value as a “first-level defense” in cancer screening camps. This work just could show whether someone has some malignancy or not. More work must be done to identify the origin and etiology of the malignancy. From this point of view, this work is the beginning of a long series of work to be done in the future.
Acknowledgment
The authors extend their appreciation to the Deanship of Scientific Research at King Saud University for funding the work through the research group project number RGP-023.
Declaration of Competing Interest
The authors declare that they have no known competing financial interests or personal relationships that could have appeared to influence the work reported in this paper.
References
- Investigation of mitochondrial metabolic response to doxorubicin in prostate cancer cells: an NADH, FAD and tryptophan FLIM assay. Sci. Rep.. 2017;7(1):10451.
- [CrossRef] [Google Scholar]
- Detection of cancer by optical analysis of body fluids-a single blind study. Technol. Cancer Res. Treat.. 2011;10(2):145-152.
- [CrossRef] [Google Scholar]
- Detection of hemophilia by fluorescence spectroscopy: A photodiagnosis approach. Photodiagnosis Photodyn. Ther.. 2020;29:101598
- [CrossRef] [Google Scholar]
- An experimental and algorithm-based study of the spectral features of breast cancer patients by a photodiagnosis approach. Photodiagnosis Photodyn. Ther.. 2020;101851
- [CrossRef] [Google Scholar]
- Courrol, L.C, de Oliveira Silva, F. R., Bellini, M. H., Mansano, R.D., Schor, N., Vieira Junior, N.D., 2007. Optical Methods for Tumor Treatment and Detection: Mechanisms and Techniques in Photodynamic Therapy XVI, ed D Kessel pp Y4270-Y (2007).
- Fluorescence spectroscopy as a novel technique for premarital screening of sickle cell disorders. Photodiagnosis Photodyn. Ther. 2021
- [CrossRef] [Google Scholar]
- Liquid biopsy of atherosclerosis using protoporphyrin IX as a biomarker. Analyst. 2014;139(6):1383-1388.
- [CrossRef] [Google Scholar]
- Synchronous fluorescence spectroscopy for the detection and characterization of cervical cancers in vitro. Photochem. Photobiol.. 2010;86(1):77-86.
- [CrossRef] [Google Scholar]
- Stokes shift spectroscopy pilot study for cancerous and normal prostate tissues. Appl. Opt.. 2012;51:3642-3649.
- [CrossRef] [Google Scholar]
- Native fluorescence spectroscopic characterization of DMBA induced carcinogenesis in mice skin for the early detection of tissue transformation. Analyst. 2015;140(12):4170-4181.
- [CrossRef] [Google Scholar]
- Porphyrins are increased in the faeces of patients with prostate cancer: a case-control study. BMC Cancer.. 2018;190
- [CrossRef] [Google Scholar]
- Feasibility of clinical detection of cervical dysplasia using angle-resolved low coherence interferometry measurements of depth-resolved nuclear morphology. Int. J. Cancer. 2017;140(6):1447-1456.
- [CrossRef] [Google Scholar]
- The Warburg Effect: How Does it Benefit Cancer Cells? Trends Biochem. Sci.. 2016;41(3):211-218.
- [CrossRef] [Google Scholar]
- Native fluorescence spectroscopy of blood plasma in the characterization of oral malignancy. Photochem. Photobiol.. 2003;78(2):197-204. 10.1562/0031-8655(2003)078<0197:nfsobp>2.0.co;2
- [Google Scholar]
- The combination of human glandular kallikrein and free prostate-specific antigen (PSA) enhances discrimination between prostate cancer and benign prostatic hyperplasia in patients with moderately increased total PSA. Clin. Chem.. 1999;45(11):1960-1966. PMID: 10545066
- [Google Scholar]
- Fluorescence spectral detection of acute lymphoblastic leukemia (ALL) and acute myeloid leukemia (AML): A novel photodiagnosis strategy. Photodiagnosis Photodyn Ther.. 2020;101634
- [CrossRef] [Google Scholar]
- Antonisamy B. Cancer detection by native fluorescence of urine. J. Biomed. Opt.. 2010;15(5):057003
- [CrossRef] [Google Scholar]
- Fluorescence Spectra of blood and urine for Cervical Cancer Detection. J. Biomed. Opt.. 2012;17(9):098001-98006.
- [CrossRef] [Google Scholar]
- The diverse roles of flavin coenzymes–nature's most versatile thespians. J. Org. Chem.. 2007;72(17):6329-6342.
- [CrossRef] [Google Scholar]
- Cell and tissue autofluorescence research and diagnostic applications. Biotechnol Annu Rev.. 2005;11:227-256.
- [CrossRef] [Google Scholar]
- Detection of intestinal dysplasia using angle-resolved low coherence interferometry. J. Biomed. Opt.. 2011;16(10):106002
- [CrossRef] [Google Scholar]
- Methods, Instrumentation and Mechanisms for Optical Characterization of Tissue and Treatment of Malignant Tumours. Sweden (ISSN 0281-2162): Department of Physics, Lund Institute of Technology; 2003. Ph.D. dissertation
- Native fluorescence spectroscopy reveals spectral differences among prostate cancer cell lines with different risk levels. J. Biomed. Opt.. 2013;18(8):87002.
- [CrossRef] [Google Scholar]
- Synchronous luminescence spectroscopic characterization of urine of normal subjects and cancer patients. J. Fluoresc.. 2014;24(4):1199-1205.
- [CrossRef] [Google Scholar]
- Abnormal concentration of porphyrins in serum from COVID-19 patients”. Br. J. Haematol. 2020
- [CrossRef] [Google Scholar]
- Label-Free Fluorescence Spectroscopy for Detecting Key Biomolecules in Brain Tissue from a Mouse Model of Alzheimer's Disease. Sci. Rep.. 2017;7(1):2599.
- [CrossRef] [Google Scholar]
- Enhanced Renewal of Erythroid Progenitors in Myelodysplastic Anemia by Peripheral Serotonin. Cell Rep.. 2019;26(12):3246-3256.e4.
- [CrossRef] [Google Scholar]
- Porphyrin as Diagnostic and Therapeutic Agent. Molecules. 2019;24(14):2669.
- [CrossRef] [Google Scholar]
- The excitation wavelength dependent fluorescence of porphyrins. Chem. Phys. Lett.. 2008;454(4–6):223-228.
- [CrossRef] [Google Scholar]
- Clinical practice. Breast-cancer screening. N Engl J Med.. 2011;365(11):1025-1032.
- [CrossRef] [Google Scholar]
- Red fluorescence of urine in Wood's light as aid in office diagnosis of porphyria. Arch. Derm. Syphilol.. 1950;61(5):853-854.
- [CrossRef] [Google Scholar]


