

Translate this page into:
Blue LED light exposure induces metabolic rewiring in vitreous tissues in rat models
⁎Corresponding author. sudarsshan.s@manipal.edu (Sudarshan Surendran)
-
Received: ,
Accepted: ,
This article was originally published by Elsevier and was migrated to Scientific Scholar after the change of Publisher.
Peer review under responsibility of King Saud University.
Abstract
Blue light exposure induced retinal damage has been extensively studied. Retinal damages are closely associated with cellular and biochemical changes occurring in the vitreous and hence, understanding metabolic changes in vitreous tissue might serve as clinical importance to indicate ocular/vision health. In the present study, we have investigated the influence of blue light-emitting diodes (LED) on the vitreous metabolome and further, we show amelioration of altered metabolite levels upon blue light blocking lenses (BBLs). A total of n = 24 (n = 6 in each group; control, light exposure without lenses, two different BBLs) male Wistar rats were subjected to blue light exposure (LEDs, 450–500 lx) without or with BBLs (400–490 nm) for 28 days on a 12:12 h light–dark cycle. Post-exposure the vitreous fluid aspirated was subjected for untargeted liquid chromatography/mass spectrometry-based metabolomics analysis. Analyzed vitreous revealed blue light significantly modulated metabolites such as Tyrosine, L-Histidine (p = 0.02), L-Isoleucine (p = 0.007), Valine (p = 0.04) and D-Proline (P < 0.001) along with affected homocysteine degradation and nitric oxide signalling pathway. Our findings suggest exposure to blue LED poses a significant hazard to the vitreous as it alters the vitreous metabolites, and it is partially ameliorated by commercially available BBLs.
Keywords
Metabolites
Blue light blocking lenses
Amino acids
Mass spectrometry
Light exposure

1 Introduction:
The widespread use of light-emitting diodes (LED) and the modern lifestyle is accompanied by self-imposed changes to patterns of light–dark exposure (Behar-Cohen et al., 2011; Gomes and Preto, 2015). Artificial light is an important source of light in the modern lifestyle with a large segment of the population being exposed to LEDs from a few minutes to several hours a day. Exposure to blue LEDs has a cumulative effect as well as various characteristics such as peak emission and higher energy (Tosini et al., 2016) compared to other light sources. The blue wavelength of light from 400 to 490 nm in the visible spectrum contains higher energy, unlike other wavelengths. This can damage the retinal cells as compared to other wavelengths (Grimm et al., 2018) and significantly influences the regulation of the neuroendocrine system such as circadian rhythm and neuronal behavioural regulations in mammals (Weng et al., 2013). Blue light also alters the physiological rhythm including sleepiness, alertness and fluctuations in the glucose metabolism with an increase in cortisol level (Cheung et al., 2016; Wahnschaffe et al., 2013).
The effects of blue light and LED light-induced irradiation on retinal function and morphology are studied extensively (Behar-Cohen et al., 2011; Shang et al., 2014). Exposure to blue light stimulates the cell death programs through oxidation, inducing a large number of free radicals, degrading messenger ribonucleic acid (mRNA) and proteins, causing necrosis of photoreceptor cells and pigment epithelial cells (Zhao et al., 2018).
The vitreous fluid (VF) plays an important role in ocular health and maintains a physiological interface with the retina, alleged to be involved in normal oxygen metabolism (Shui et al., 2009) and accelerate as an energy damper (Rossi et al., 2018). The vitreous consumes O2 in an acellular, ascorbate-dependent manner this biophysical property of the vitreous is to tightly regulate intraocular oxygen tension so that the vitreous surrounding vascular structures are highly oxygenated while the adjacent avascular structures are kept in a hypoxic environment, thought necessary for the health of the eye (Holekamp, 2010). Studies suggested that the vitreous may protect the lens and the trabecular meshwork from oxidative stress, by metabolizing the oxygen diffused from the retina into ascorbate (Bito, 1977; Laíns et al., 2019; Siegfried and Shui, 2019). The concentration of ascorbic acid in VF is considerably higher than plasma it's expected to be caused by active transport by the ciliary epithelium (McGahan, 1985). Consumption of oxygen in an ascorbate-dependent manner identifies a novel biochemical property of the human vitreous and links it to an important physiologic function. It may serve to maintain lower levels of molecular oxygen near the lens, protecting the lens from nuclear cataracts (Shui et al., 2009). This ascorbic acid compound can absorb ultraviolet light (UV) (Ringvold, 1980) and serve as a free-radical inhibitor this might protect the retina and lens from the unfortunate effects of light-induced singlet oxygen generation. It also protects the vitreous against oxidative stress and presumably provides additional antioxidant protection.
Few studies observed significant changes in metabolites in rabbit eye aqueous fluid (Tessem et al., 2005) and rat lens (Tessem et al., 2006) following UV-B exposure, and an increase in lactate in vitreous was observed in the rabbit model of ocular hypertension. Although the effect of blue light exposure on the retina and cornea have been extensively studied (Green et al., 2018; Shang et al., 2014) no research has investigated the effect of blue light on the vitreous. In this study, we investigated blue LED induced metabolomics alterations in vitreous and amelioration by blue light blocking lenses (BBLs).
2 Methodology
2.1 Ethical statement
All experimental procedures in this study were approved by the Institutional Animal Ethics Committee (IAEC) of Kasturba Medical College, Manipal Academy of Higher Education, (IAEC/KMC/02/2017), India. Animal handling and investigational procedures were carried out under CPCSEA (No:94/PO/Re Bi/5/99/ CPCSEA) guidelines.
2.2 Experimental setup and animal resources
Eight weeks old male Wistar rats were procured from the central research animal facility laboratory at Manipal Academy of Higher Education (MAHE), Manipal, India. Fig. 1: summarizes the experimental approach. In brief, rats were divided into four groups light exposure (LE), and two lens protection groups, one with Crizal Prevencia (CP) Lenses (Essilor, Charenton-le-Pont, France) and the other lens using Duravision Blue (DB) lenses (Carl Zeiss, Oberkochen, Germany). The light exposure group animals were subjected to the blue LED (400–490 nm, 102.3 μW/cm2) light (Ack LED Panels, 3 W, Epistar, ES-EMBCF22L-A, InGan -series Blue LED chip, Hsinchu, Taiwan). The light source was fitted on top of the cage (L = 100 cm, W = 70 cm and H = 50 cm) with a 50 cm distance between the light source and rat. In the lens protection (CP and DB) groups, rats were exposed to the same light as in light exposure groups. The Illumination measurements were taken vertically and horizontally and averaged to account for the geometry of the rat anatomical eye position. The absolute transmittance of CP and DB lenses was measured using a Zeiss Humphrey lens analyzer (LA360, Oberkochen, Germany) and the absolute transmittance integrated across 420–500 nm was reduced to 93.7% for DB and 88.3% for CP lenses relative to unfiltered blue LEDs. The control group rats were maintained in a standard research laboratory environment provided with food, water with ad-libitum. In LE, CP and DB groups, rats were exposed for 28 days to a light cycle of (12:12 h) with uniform illumination (450–500 lx). However, the commercially available blue light blocking lenses (BBLs) were fitted on top of the LED to filter out the blue light. Post-exposure, all animals were sacrificed with a lethal dose of pentobarbital intraperitoneal injection (i.p. 100 mg/kg) (Euthasol®) and xylazine (10 mg/kg) (Proxylaz®). Eyes were enucleated by using watchmaker forceps (number 5) and Sklar's blunt enucleation scissors. Immediately after enucleation, the vitreous was extracted by aspiration (21-gauge hollow needle) technique and stored at −20 °C for liquid chromatography/mass spectrometry (LC-MS).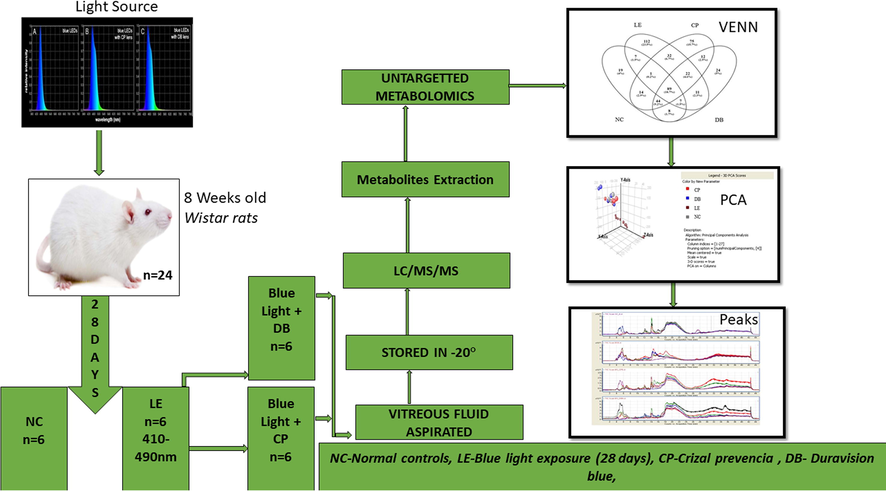
Flow chart of the methodology used in this study.
2.3 Sample size calculation
We have used the following formula to calculate the required minimum sample size (Arifin and Zahiruddin, 2017). DF = N - k = kn-k = k (n-1), Rearranging n = DF/k + 1. DF = degrees of freedom. where N = total number of animals, k = number of groups, and n = number of animals per group. Maximum n = 20/4 + 1 = 6 animals per group. Maximum sample size n = 6 per group (NC, LE, CP and DB).
2.4 Mass spectrometry analysis of vitreous
The mass spectrometry technique and analysis performed in this study were adopted (Patnaik et al., 2019). Vitreous fluid metabolites were extracted using frozen methanol (RCI Labscan, Bangkok, Thailand). One part (20 μl) vitreous was combined with two parts frozen methanol and centrifuged for 15 min at 12,000 rpm. The extract was desiccated under vacuum and combined with 30 μl of H2O (Millipore, São Paulo, Brazil): acetonitrile (95:5) containing 0.1% formic acid (Fluka, Buch’s, Switzerland). An 8 µl aliquot was injected into an Agilent 1290 LC system coupled to an ESI-Q-TOF instrument (Agilent 6520, Agilent Technologies, Santa Clara, CA, USA). HPLC column (Phenomenex, Torrance, CA, USA (P/No:00G-4601-E0; Desc: Kinetex 5 μm C18 100A; Size: LC Column 250X 4.6 mm; S/No H18-343854; B/No 5701-0060) was maintained was at 25 °C. Vitreous samples from each group were run in LC-MS mode. Peaks obtained from raw MS data were aligned and subjected to bioinformatics and statistical analysis.
The metabolite peaks were attained in NC, LE, and BBLs (CP and DB) groups separately (Fig. 2). Partial least squares-discriminant analysis (PLS-DA) and Principal components analysis (PCA) using spectral profiles derived from positive mode exhibited a significant discernment of defined subgroups of 98.07% which allowed us to perform further statistical analysis. Subsequently, the data narrowed down to metabolites present in at least 70% of the samples in each group and subjected to identification of metabolites using mass within a tolerance of 15 ppm in METLIN and human metabolome database (HMDB).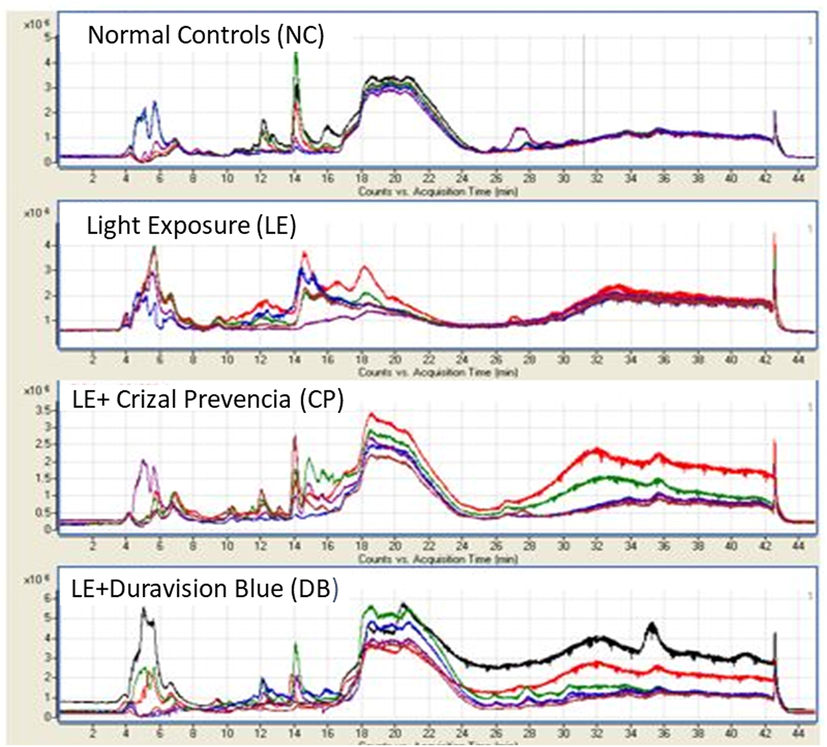
Represents the spectra features of metabolite peaks were obtained in control, LE with BBLs (CP and DB) groups separately. The X-axis represents the count versus acquisition of metabolites time in minutes and Y-axis represents the generated distinct peaks on the total ion chromatogram (TIC) traces (*106).
2.5 PCA and PLS-DA
The PCA was applied to the transformed datasets with mass spectrometer data (Agilent Mass Profiler Professional (MPP) software (p/n G3835-90021)). The calculated covariance around the mean of the data in each “bin” was evaluated relay to each other. The principal components (PCs) extracted from the data refer to the path of the largest discrepancy in the data, and often, a relatively small number of principal components are described as the major covariance trends within the data. PCA analysis of the spectra from all samples indicated that two PCs were accounted for over 90% of the covariance, and these PCs are plotted against each other (Fig. 3). Controls, LE and BBLs groups showed a definite fragmented on the plot of PC1 against PC2. Samples were spread widely across the control and BBLs group axes with no noticeable trends. However, discrimination based on the value of light exposure (LE) PC1 samples had positive PC1 values, while controls and BBLs (CP and DB) samples had negative PC2 values. Similarly, the LE was clustered with samples from NC and BBLs (CP and DB) groups. Raw data files were segregated aligned, transformed to log10, and baselined to the median of all samples in MPP. Features that were present in at least 75% of individuals in each group were considered for further analysis. Partial least square discriminant analysis (PLS-DA) was performed on metabolome data to discriminate the study groups. Compounds were identified in METLIN and HMDB databases based on isotopic pattern distribution and accurate mass within a specified tolerance (15 ppm error). Peaks obtained from raw MS data were aligned and subjected to bioinformatics and statistical analysis. The metabolite peaks were attained in NC, LE, and BBLs (CP and DB) groups separately. The pathway enrichment analysis was performed for the very significant 15 metabolites in the NC, LE and BBLs (CP and DB) groups using the MetaboAnalyst program.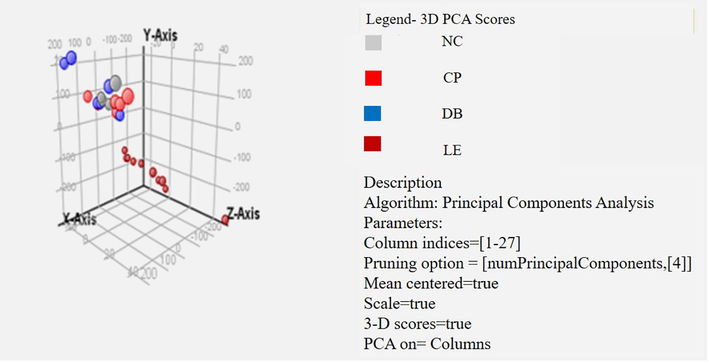
PCA of Mass spectrometry of vitreous fluid from controls, light exposure (LE) and BBLs (CP and DB) group. The processed and binned Masses endeavoured to PCA analysis and the two primary PC, which accounted for 90 % of the variation have been mapped.
We steered PCA on all detected metabolites. The parting of the NC, LE, and BBLs groups demonstrated their difference in metabolomic expression. The most metabolites with extreme abundance were certainly isolated in the light exposure group. Furthermore, we did a summary of frequency normalization for abundance values (log10) across the groups out of it 99% of samples were normally distributed. We took only significant metabolites into account, the molecules in the same group clustered to each other which stated less difference among the light exposure group. Through partial least square discriminant analysis, we found the pattern of metabolomics, with a sensitivity of 90% and a specificity of 87%. Notably, the amino acids and small molecule levels were elevated in the LE and BBLs groups.
2.6 Statistical analysis
The raw data obtained from each run was processed using a molecular feature extraction tool in Qualitative Mass Hunter Analysis Software B.04.00 (Agilent Technologies). The data files containing monoisotopic mass, respective abundance and retention time were used for data alignment and filtering in Mass Profiler Plus software (MPP) (Agilent Technologies, version B.12.5). Statistical analysis was undertaken using R software (version 3.6.3). One way ANOVA was used to compare the abundance values across the groups and Tukey HSD post-hoc comparisons were used to compare between the groups. For all post-hoc comparisons, p-values were adjusted for multiple comparisons.
3 Results
A total of 24 vitreous samples were extracted from NC, LE and BBLs (CP and DB) groups (Time 10:00 AM-10:30 AM) and analyzed. We obtained 8,286 spectral features across the groups in MPP software. These features were filtered out by frequency, out of it 496 molecules were presented across the samples. These 496 molecules were statistically significant (p < 0.05) for the entity of 2.0-fold change (FC). Further, we performed a t-test against zero, kept the p-value as asymptotic across the samples with an FC of 3.1. Out of 496 molecules, 348 molecules had a (p < 0.02), 169 molecules had p < 0.001, 63 molecules had p < 0.001 and 15 molecules had p < 0.001. We took significant 63 molecules (p < 0.001) and a very significant 15 molecules (p < 0.001) for subsequent analysis.
Fig. 4a shows the heat map of up/down-regulation of abundance values for 63 significant molecules. As shown, a clear upregulation of molecules was noted in the LE group and these molecules were downregulated in NC, CP, and DB. Fig. 4b shows the Circos representation of 63 molecules.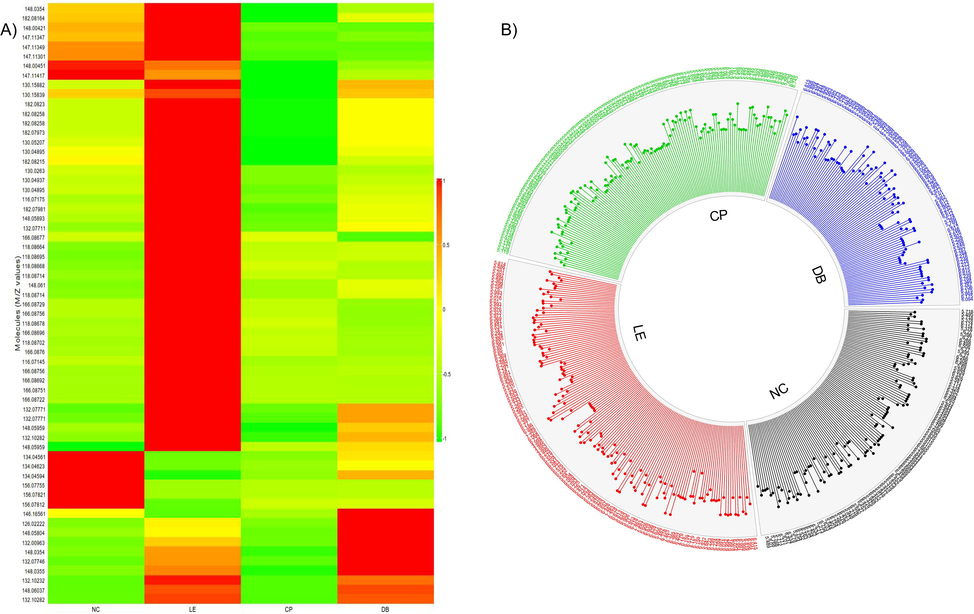
A) Heat map for measuring altered metabolites in vitreous. The ratio of precursor to metabolite for each sample value is calculated, and only significance metabolites were selected and plotted. Rows represent control (NC), light exposure (LE), BBLs (CP and DB) groups, and metabolic column ratio. Red represents upregulation of metabolites and green downregulation, respectively. B) An overview of vitreous metabolome patterns in NC, LE, CP, and DB groups. Circos diagram demonstrates a comparison of log10 altered abundance values of 63 identified metabolites (excluding xenobiotics) detected in all 4 groups.
We compared the abundance values across the groups using ANOVA for biologically significant 15 molecules. Table 1 shows the p-values obtained using ANOVA and Tukey HSD post-hoc comparisons. Out of 15 molecules, 8 molecules showed significant difference across 4 groups D-Proline (p < 0.001), Valine (p = 0.04), L-Isoleucine (p = 0.007), L-Lysine (p = 0.002), N-Acetylserine (p = 0.012), L-Histidine (p = 0.001), Phenylalanine (p = 0.017) and L-Tyrosine (p = 0.002).
S.no
Mass
Compounds
ANOVA P-Value
Tukey HSD Post-Hoc comparison
NC-LE
NC-CP
NC-DB
LE-CP
LE-DB
CP-DB
1
115.0633
D-Proline
<0.001
0.003
0.479
0.423
<0.001
0.06
0.011
2
117.1463
N-Methyl-a-a acid
0.128
0.282
0.861
0.99
0.549
0.113
0.543
3
117.079
Valine
0.04
0.179
0.729
0.977
0.507
0.043
0.267
4
125.147
Taurine
0.221
0.789
0.99
0.977
0.477
0.955
0.247
5
129.157
Cycloleucine
0.059
0.959
0.276
0.977
0.064
0.775
0.297
6
131.1729
Aminocaproic acid
0.069
0.147
0.999
0.977
0.231
0.998
0.324
7
131.1729
L-Isoleucine
0.007
0.042
0.979
0.977
0.179
0.912
0.077
8
131.0946
L-Leucine
0.139
0.669
0.61
0.977
0.115
0.989
0.29
9
145.2459
Spermidine
0.251
0.944
0.956
0.977
0.998
0.362
0.276
10
146.1055
L-Lysine
0.002
0.999
0.008
0.997
0.031
0.073
0.996
11
147.1293
N-Acetylserine
0.012
0.413
0.986
0.977
0.242
0.58
0.015
12
149.051
L-Glutamate
0.057
0.579
0.733
0.0977
0.035
0.283
0.81
13
155.1546
L-Histidine
0.001
<0.001
0.01
0.977
0.379
0.365
0.998
14
165.079
Phenylalanine
0.017
0.192
0.998
0.977
0.185
0.287
0.986
15
181.0739
L-Tyrosine
0.002
0.182
0.181
0.977
0.004
0.975
0.012
Fig. 5 shows within metabolites Pearson’s correlations in all four groups. We observed significant correlation variations among different metabolite levels in LE groups compared to NC and BBLs (CP and DB). A significant positive correlation between L-tyrosine, N-Methyl-a-a acid, valine, Taurine, Aminocaproic acid, Spermidine, L-lysine, N-Acetylserine and L-Isoleucine levels (R1 = 0.99; p = 0.001) and (R1 = 0.240; p = 0.002) was found in control and DB. However, a negative correlation was observed in LE and CP groups, where valine, L-Tyrosine, L-Glutamate, L-Histidine, Cycloleucine, Phenylalanine and L-Glutamate levels were reduced to R2 = −0.77 and R2 = −0.99 respectively. In the control group, valine (R2 = −0.97; p = 0.149) proline (R2 = −1.00; p = 0.053) Taurine, Aminocaproic acid showed a negative correlation which was disturbed in the light exposure group wherein values for valine to L-leucine was R2 = −0.062, p = 0.952 and proline to L-tyrosine R2 = −0.95, respectively. Also, we observed altered correlations between controls (NC), light exposure (LE) and BBLs (CP and DB) group.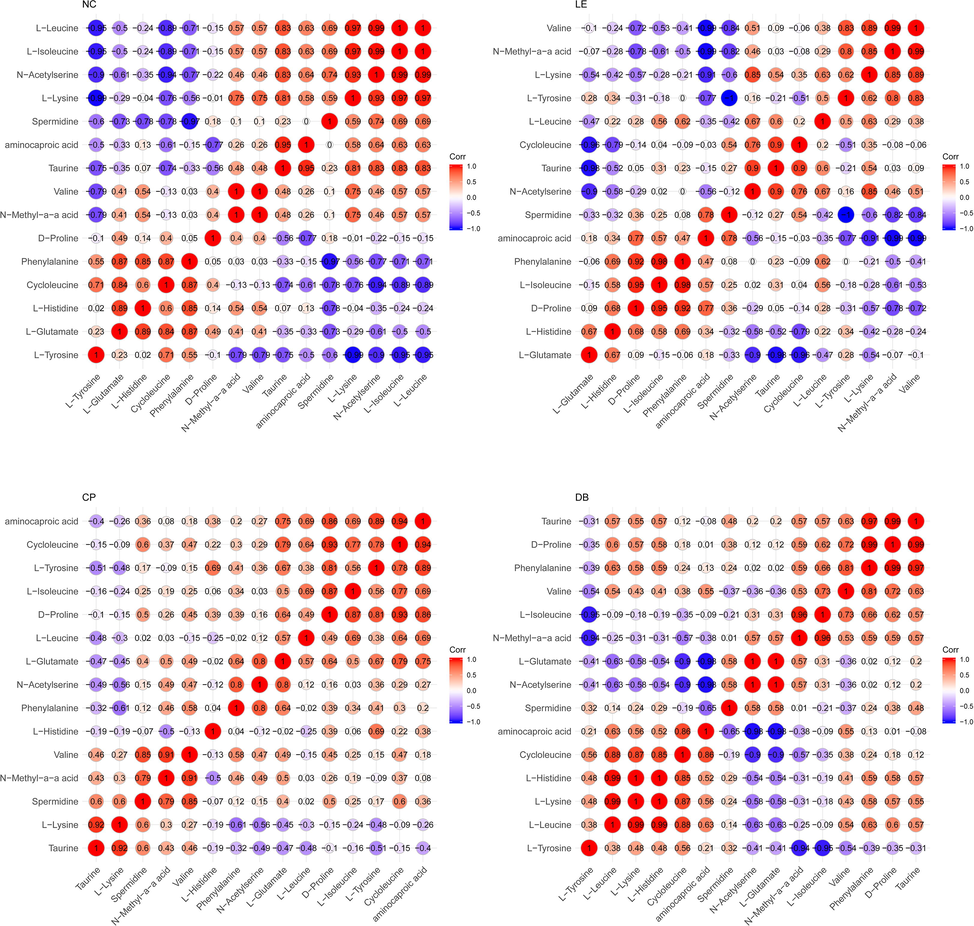
Significant correlations were observed between the control (a), light exposure (b), CP (c) and DB (d) in the vitreous. R1 indicates a positive correlation (Red) and R2 Indicates a negative correlation (Blue). The Colour of the circle indicates a sign of the correlation and the size of the circle indicates the strength of the correlation.
Fig. 6 Using pooled vitreous samples, a univariate statistic (ANOVA) revealed a significant alteration in lipids, amino acids, and its derivatives in the NC, LE and BBLs group (CP and DB). A significant alteration in 8 out of 15 molecules compared with control group versus LE group (Fig. 6), branched chain amino acids such as D-proline (p < 0.001), Valine (p = 0.04), L-isoleucine (p = 0.007), L-lysine (p = 0.002), N-Acetylserine (p = 0.012), L-Histidine (p = 0.001), Phenylalanine (p = 0.017), and L-Tyrosine (p = 0.002). The large degree of interindividual variability in the number of metabolites between LE and BBLs groups (post-Hoc). There are 4 out of 15 molecules were significant LE, CP and DB (Fig. 6) D-Proline (P < 0.001), (P = 0.06), (P = 0.011), L-Lysine (P = 0.031), (P = 0.073), L-Histidine (P = 0.01) and L-Tyrosine (P = 0.04), (P = 0.012). Overall, our results suggest that the variability in metabolites in a specific track in experimental animals, but that a large degree of differences exist between LE and BBLs (CP and DB) groups.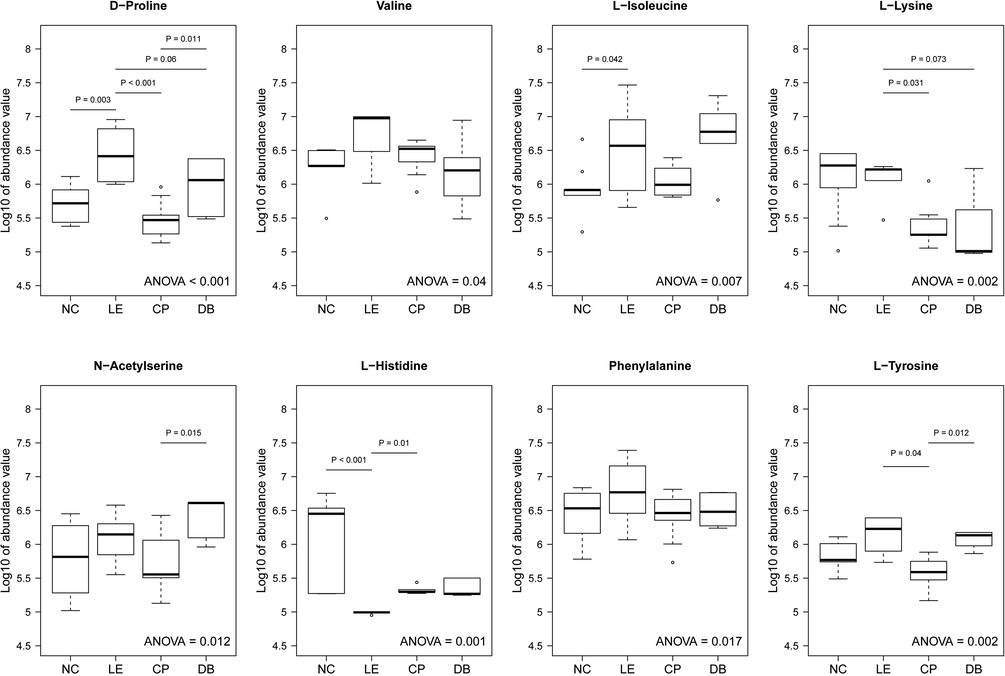
Distinguish altered vitreous metabolites in controls (NC), light exposure (LE) and BBLs (CP and DB). Metabolite intensities of most abundant and significant molecules values transformed to log10 unit and represented as Box-Whiskers plots. Statistically significant changes in metabolite intensity between the NC, LE, BBLs (CP and DB) groups are represented by an asterisk.
The pathway enrichment analysis revealed that the identified significant metabolites for the comparison of LE and BBLs (CP and DB) groups revealed significance in lysine (p = 0.053), serine (p = 0.001), phenylalanine (p = 0.004), and tyrosine (p = 0.040) and homocysteine degradation (Fig. 7) was the most perturbed pathways in LE conditions. This augments a growing frame of evidence to suggest that photo-chemical metabolism is particularly compromised in LE animals that potentially disrupts homocysteine dysregulation a pathway that might rescue by BBLs (CP and DB).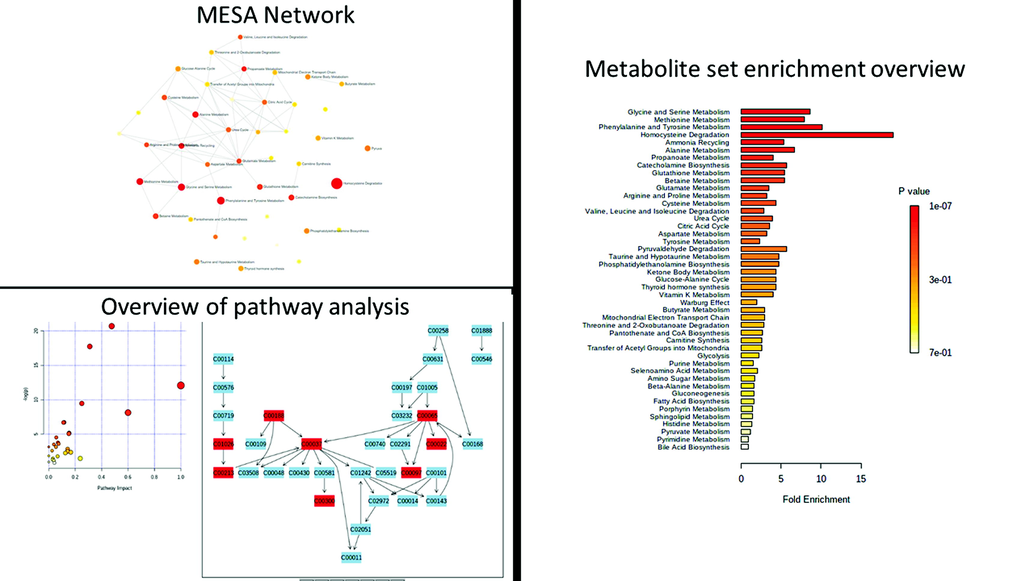
Metabolite set pathway enrichment analysis. The glycine, serine, methionine, and homocysteine metabolic pathways are the most significantly affected in the upper panel; 4 Upregulated FDR = 2.99E-01 and 4/20; FDR = 1.00E + 00) and in the lower panel; 4 dysregulated features out of 20; False discovery rate (FDR) = 1.00E + 00).
4 Discussion
The metabolic perturbations in the vitreous are being recognized as a key factor in ocular pathogenesis (Laíns et al., 2019). Vitreous might protect ocular tissues from oxidative stress, by metabolizing the oxygen diffused from the retina (Shui et al., 2009). The application of metabolomics is to detect risk factors linked to ailments (Tan et al., 2016). Observation from this study shows for the first time of metabolomic analysis of vitreous samples of blue light exposure and its amelioration by BBLs. The total vitreous metabolites were upregulated significantly in the LE group compared to NC, CP, and DB groups. The alteration might be due to cumulative light exposure, probably due to augmented hydrolysis through phosphodiesterase and accumulation of inosine monophosphate (IMP). The stress response of ganglion cells shows a more significant change in amino acid distribution compared with photoreceptors, which can be due to glutamate homeostasis (Bui et al., 2009). Similarly, we observed an alteration in homocysteine (Hcys), Phenylalanine, Tyrosine, Glycine and Serine metabolism pathways (Fig. 7). Hcys triggers ROS by auto-oxidation of the amino acid involved lysyl oxidase (LOX) inhibition (Coral et al., 2009; Fang et al., 2016; Navneet et al., 2019). These alterations could be due to the apoptotic signal relating pathway related to retinal ganglion cell damage (Ganapathy et al., 2011). We hypothesized that blue light led homocysteine elevations might lead to oxidative stress in the retina and other ocular tissues. The glutamate plays a major role in retinal inflammatory conditions (Bertram et al., 2008; Diederen et al., 2006) and it plays a vital role in preventing neurotoxicity in vitreous (Laíns et al., 2019). Likewise, we found a significant change in glutamate levels in LE which might initiate neuronal apoptosis by producing ROS in the retina and ocular tissues.
The concentration of Amino acids (AA) valine and isoleucine in the aqueous were found to increase after UV-B exposure (Tessem et al., 2005). Upregulation of AA was observed in the LE group, which might diminish the protein synthesis and degrade the metabolic activities in ocular tissues, especially in the lens and aqueous (Tessem et al., 2005). However, the most perceptible perturbations observed in D-proline, L-Isoleucine, and histidine were in the LE group. This AA might play a role as an osmolyte (Mitton et al., 1999) and as antioxidants in the lens (Kilic et al., 1999). These altered biochemical changes could contribute to hyperoxia-induced retinal neurodegeneration (Narayanan et al., 2014). D-Proline acts as the main collagen component, supportive protein, and the blood-retinal barrier to connective tissue. It promotes their health and healing from any damage (Yoneyama et al., 2010). Here, in our findings, D-Proline levels were significantly altered in the LE group, and this upregulation might be either due to photothermal injury or environmental stress (Tessem et al., 2005) to protect retinal layers/glial cells/ganglion cells from oxidative stress. The D-proline function, such as direct hunting of reactive oxygen species will restore ATP from ADP, by acting as a catalyzer (Locci et al., 2014). Taurine levels were altered in light exposure groups compared to the NC group and BBLs (CP and DB) group. Taurine is one of the utmost abundant amino acids in the retina and brain, particularly taurine, which plays a major role in photoreceptor growth, neurotransmitter and acts as a cytoprotectant contrary to stress-related neuronal injury (Harris and Mrsic-Flogel, 2013). Enriched taurine nutrition inhibits the retinal ganglion cell survival via retinal ganglion intracellular pathways (Froger et al., 2012). These findings indicated that a cumulative blue LED light could contribute to metabolic alteration in the vitreous; it may lead to the said consequences to the vitreous, retina, and ocular barriers. The studies on light stress in the retina metabolome show that the mechanisms of light preconditioning of acute light exposure mechanism are endured (de la Barca et al., 2017). Studies suggest that light stimulation-induced changes in lipid and amino acid metabolism, with likely involvement of nitric oxide-related signalling pathways (de la Barca et al., 2017; Laíns et al., 2019).
In this study, we found significantly increased levels of the nitric oxide (NO) metabolic signalling pathway when rats were exposed to blue LED light. NO plays an important role in protecting the anterior and posterior segments of the eye, it depends on the condition and concentration (Erdinest et al., 2021) excessive concentration levels of NO might damage the retina (Morgan et al., 1999). NO acts as a light response modulator by activation of specific ion conductors in retinal photoreceptors (Park et al., 2017). Excessive NO was observed in glaucoma, macular degeneration, and oxidative stress conditions (Agurto et al., 2017; Bhutto et al., 2010; Pittalà et al., 2017). Since LED exposure causes retinal damage (Theruveethi et al., 2022), visual cortex neuronal changes (TN et al., 2021) and increases oxidative stress (Shang et al., 2014). These light-induced alterations might be due to the nitric oxide signal relating to the pathway (Laíns et al., 2019). The influence of LE and BBLs on vitreous metabolite is a new-fangled observation that may have important alarming implications to blue light exposure and the protection ability of BBLs against blue light exposure.
The changes occurring in the retina are closely linked to biochemical changes occurring in the vitreous fluid (Yoshimura et al., 2009), as it could provide valuable information about pathological changes occurring in the retina post light exposure. There are well-documented studies on blue light exposure and retinal damage (Krigel et al., 2016; Lee et al., 2016; Shang et al., 2014; Song et al., 2016). Besides, altered levels of vitreous metabolites are interrelated with increased apoptosis in the light-induced retina (Jaadane et al., 2015; Karl et al., 2008; Shang et al., 2014). There are no documented studies on blue light exposure and alteration in vitreous metabolites.
This study has some limitations. The rat lens is more transparent when compared to other mammals, and are known to be more susceptible to light damage. In particular, for the smaller eye of the rat effective retinal illuminance can be 25× higher than that seen in human eyes. Thus, care should be taken when extrapolating our findings to prolonged blue light exposure in human eyes. Our study has only assessed a single time point, which was designed to model a scenario of prolonged blue light exposure and triplicating the samples with targetted metabolomic analysis would help to understand this observed damage in a better way.
To conclude, we observed that prolonged exposure to moderate blue light causes altered metabolites in the vitreous. These metabolomic variations may lead to alteration in the intra-ocular environment which might cause mutilation to vitreous bounded tissues. Importantly, we have shown that the extent of metabolomic alteration induced by blue light exposure can be in part ameliorated by both (CP and DB) commercially available BBLs.
Conflict of interest
The authors declare no conflict of interest.
Acknowledgements
This study is funded by science & engineering research board (SERB) (a statutory body of the Department of Science & Technology, Government of India) EMR/2017/004341.
Declaration of Competing Interest
The authors declare that they have no known competing financial interests or personal relationships that could have appeared to influence the work reported in this paper.
References
- Sample size calculation in animal studies using resource equation approach. Malays. J. Med. Sci.. 2017;24:101-105.
- [CrossRef] [Google Scholar]
- Light-emitting diodes (LED) for domestic lighting: Any risks for the eye? Prog. Retin. Eye Res.. 2011;30:239-257.
- [CrossRef] [Google Scholar]
- Amino-acid levels in subretinal and vitreous fluid of patients with retinal detachment. Eye. 2008;22:582-589.
- [CrossRef] [Google Scholar]
- Low nitric oxide synthases (NOSs) in eyes with age-related macular degeneration (AMD) Exp. Eye Res.. 2010;90:155-167.
- [CrossRef] [Google Scholar]
- The physiology and pathophysiology of intraocular fluids. Exp. Eye Res.. 1977;25:273-289.
- [CrossRef] [Google Scholar]
- Glutamate metabolic pathways and retinal function. J. Neurochem.. 2009;111:589-599.
- [CrossRef] [Google Scholar]
- Morning and evening blue-enriched light exposure alters metabolic function in normal weight adults. PLoS One. 2016;11:1-18.
- [CrossRef] [Google Scholar]
- Coral, K., Angayarkanni, N., Gomathy, N., Bharathselvi, M., Pukhraj, R., Rupak, R., 2009. Homocysteine levels in the vitreous of proliferative diabetic retinopathy and rhegmatogenous retinal detachment: Its modulating role on Lysyl oxidase. Investig. Ophthalmol. Vis. Sci. 50, 3607–3612. 10.1167/iovs.08-2667
- Retinal metabolic events in preconditioning light stress as revealed by wide-spectrum targeted metabolomics. Metabolomics. 2017;13
- [CrossRef] [Google Scholar]
- Increased glutamate levels in the vitreous of patients with retinal detachment. Exp. Eye Res.. 2006;83:45-50.
- [CrossRef] [Google Scholar]
- Erdinest, N., London, N., Ovadia, H., Levinger, N., 2021. Nitric Oxide Interaction with the Eye. 10.3390/vision5020029.
- Homocysteine induces glyceraldehyde-3-phosphate dehydrogenase acetylation and apoptosis in the neuroblastoma cell line Neuro2a. Brazilian J. Med. Biol. Res.. 2016;49
- [CrossRef] [Google Scholar]
- Froger, N., Cadetti, L., Lorach, H., Martins, J., Bemelmans, A., Chicaud, L., Dubus, E., Degardin, J., Jammoul, F., Benosman, R., 2012. Taurine Provides Neuroprotection against Retinal Ganglion Cell Degeneration 7. 10.1371/journal.pone.0042017.
- Homocysteine-mediated modulation of mitochondrial dynamics in retinal ganglion cells. Investig. Ophthalmol. Vis. Sci.. 2011;52:5551-5558.
- [CrossRef] [Google Scholar]
- Comparing the response to acute and chronic exposure to short wavelength lighting emitted from computer screens. Chronobiol. Int.. 2018;35:90-100.
- [CrossRef] [Google Scholar]
- Grimm, C., Wenzel, A., Williams, T.P., Rol, P.O., Hafezi, F., Reme, C.E., 2018. Rhodopsin-Mediated Blue-Light Damage to the Rat Retina : Effect of Photoreversal of Bleaching 42.
- The vitreous gel: more than meets the eye. Am. J. Ophthalmol.. 2010;149:32-36.e1.
- [CrossRef] [Google Scholar]
- Retinal damage induced by commercial light emitting diodes (LEDs) Free Radic. Biol. Med.. 2015;84:373-384.
- [CrossRef] [Google Scholar]
- Stimulation of neural regeneration in the mouse retina. Proc. Natl. Acad. Sci. U. S. A.. 2008;105:19508-19513.
- [CrossRef] [Google Scholar]
- Modelling cortical cataractogenesis 22: Is in vitro reduction of damage in model diabetic rat cataract by taurine due to its antioxidant. Exp. Eye Res.. 1999;69:291-300.
- [CrossRef] [Google Scholar]
- Light-induced retinal damage using different light sources, protocols and rat strains reveals LED phototoxicity. Neuroscience. 2016;339:296-307.
- [CrossRef] [Google Scholar]
- Laíns, I., Gantner, M., Murinello, S., Lasky-Su, J.A., Miller, J.W., Friedlander, M., Husain, D., 2018. Metabolomics in the study of retinal health and disease. 10.1016/j.preteyeres.2018.11.002.
- Influence of light emitting diode-derived blue light overexposure on mouse ocular surface. PLoS One. 2016;11:e0161041.
- [Google Scholar]
- A metabolomic approach to animal vitreous humor topographical composition: a pilot study. PLoS One. 2014;9
- [CrossRef] [Google Scholar]
- Ascorbic acid levels in aqueous and vitreous humors of the rabbit: effects of inflammation and ceruloplasmin. Exp. Eye Res.. 1985;41:291-298.
- [CrossRef] [Google Scholar]
- Modelling cortical cataractogenesis 21: In diabetic rat lenses taurine supplementation partially reduces damage resulting from osmotic compensation leading to osmolyte loss and antioxidant depletion. Exp. Eye Res.. 1999;69:279-289.
- [CrossRef] [Google Scholar]
- Nitric oxide mediates excitotoxic and anoxic damage in rat retinal ganglion cells cocultured with astroglia. Arch Ophthalmol. (Chicago, Ill. 1960). 1999;117:1524-1529.
- [CrossRef] [Google Scholar]
- Arginase 2 deficiency reduces hyperoxia-mediated retinal neurodegeneration through the regulation of polyamine metabolism. Cell Death Dis.. 2014;5
- [CrossRef] [Google Scholar]
- Excess homocysteine upregulates the NRF2-antioxidant pathway in retinal Müller glial cells. Exp. Eye Res.. 2019;178:228-237.
- [CrossRef] [Google Scholar]
- Effect of nitric oxide on human corneal epithelial cell viability and corneal wound healing. Sci Rep. 2017;71(7):1-10.
- [CrossRef] [Google Scholar]
- Metabolomics applicable to retinal vascular diseases. Methods Mol. Biol.. 2019;1996:325-331.
- [CrossRef] [Google Scholar]
- Pittalà, V., Fidilio, A., Lazzara, F., Bianca, C., Platania, M., Salerno, L., Foresti, R., Drago, F., Bucolo, C., 2017. Effects of novel nitric oxide-releasing molecules against oxidative stress on retinal pigmented epithelial cells. 10.1155/2017/1420892.
- Aqueous humour and ultraviolet radiation. Acta Ophthalmol.. 1980;58:69-82.
- [CrossRef] [Google Scholar]
- Does the Bursa Pre-Macularis protect the fovea from shear stress? A possible mechanical role. Exp. Eye Res.. 2018;175:159-165.
- [CrossRef] [Google Scholar]
- White light-emitting diodes (LEDs) at domestic lighting levels and retinal injury in a rat model. Environ. Health Perspect.. 2014;122:269-276.
- [CrossRef] [Google Scholar]
- The gel state of the vitreous and ascorbate-dependent oxygen consumption. Arch. Ophthalmol.. 2009;127:475-482.
- [CrossRef] [Google Scholar]
- Intraocular oxygen and antioxidant status: new insights on the effect of vitrectomy and glaucoma pathogenesis. Am. J. Ophthalmol.. 2019;203:12-25.
- [CrossRef] [Google Scholar]
- Effect of green light spectra on the reduction of retinal damage and stress in goldfish, Carassius auratus. Biochem. Biophys. Res. Commun.. 2016;476:96-101.
- [CrossRef] [Google Scholar]
- Introduction to metabolomics and its applications in ophthalmology. Eye 2016
- [CrossRef] [Google Scholar]
- Biological response in various compartments of the rat lens after in vivo exposure to UVR-B analyzed by HR-MAS 1 H NMR spectroscopy. Investig. Opthalmol. Vis. Sci.. 2006;47:5404.
- [CrossRef] [Google Scholar]
- Effect of UV-A and UV-B irradiation on the metabolic profile of aqueous humor in rabbits analyzed by 1H NMR spectroscopy. Investig. Ophthalmol. Vis. Sci.. 2005;46:776-781.
- [CrossRef] [Google Scholar]
- Blue light-induced retinal neuronal injury and amelioration by commercially available blue light-blocking lenses. Life. 2022;2022(12):243.
- [CrossRef] [Google Scholar]
- Nagarajan, T.N., Sudarshan, S., Joshi Manjunath, B., Valiathan, M., Ganeshrao, S.B., 2021. Blue light-induced alterations in visual cortex layer5pyramidal neuron and amelioration by Blue light blocking lenses (BBLs) in-Wistar rats. ARVO Annual Meeting Abstract/nvest. Ophthalmol. Vis. Sci. 62, 621.
- Effects of blue light on the circadian system and eye physiology. Mol. Vis.. 2016;22:61-72.
- [Google Scholar]
- Out of the lab and into the bathroom: evening short-term exposure to conventional light suppresses melatonin and increases alertness perception. Int. J. Mol. Sci. 2013;14:2573-2589.
- [CrossRef] [Google Scholar]
- Weng, S., Estevez, M.E., Berson, D.M., 2013. Mouse ganglion-cell photoreceptors are driven by the most sensitive rod pathway and by both types of cones 8. 10.1371/journal.pone.0066480.
- Involvement of system A in the retina-to-blood transport of l-proline across the inner blood-retinal barrier. Exp. Eye Res.. 2010;90:507-513.
- [CrossRef] [Google Scholar]
- Comprehensive analysis of inflammatory immune mediators in vitreoretinal diseases. PLoS One. 2009;4:e8158.
- [Google Scholar]
- Research progress about the effect and prevention of blue light on eyes. Int. J. Ophthalmol.. 2018;11:1999-2003.
- [CrossRef] [Google Scholar]


